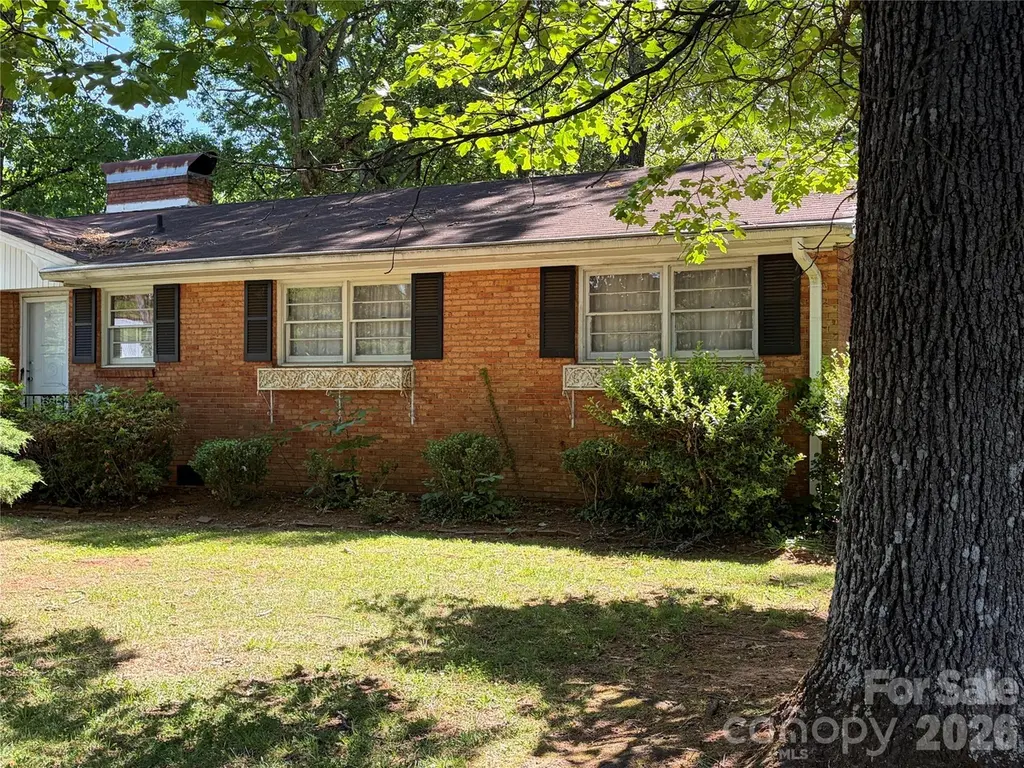
1202 Fallston Rd · Shelby, NC
Flood risk 1/10 · Minimal
- FEMA flood zone
- X (unshaded)
- Chance of flooding over 30 yrs
- 0.0%
- Est. flood insurance / yr
- $507 – $1,088
Fire risk 3/10 · Minor
- Est. fire insurance / yr
- $906 – $1,684
Heat risk 5/10 · Moderate
- Hot days now (above 104°F)
- 7 days/yr
- Hot days in 30 yrs
- 17 days/yr
Wind risk 3/10 · Minor
- Chance of severe wind over 30 yrs
- 4.0%
Air-quality risk 3/10 · Minor
- Unhealthy air days now
- 3 days/yr
- Unhealthy air days in 30 yrs
- 4 days/yr
Risk factors via First Street. Map © Google.
Why this score? — see what drove the C grade
The composite is a weighted blend of 9 inputs, each scored 0–100. Each bar is that input's sub-score; the figure is the points it added to the 100-point composite (weight × sub-score).
- Cash flow +17.4/30.0
- ARV discount +15.0/15.0
- DSCR +5.4/10.0
- 1% rule +4.3/10.0
- Rent growth +4.2/5.0
- Schools +4.0/10.0
- Livability +3.8/5.0
- Condition / age +2.5/5.0
- Appreciation +0.5/10.0
$145,000
🖨 Deal sheet 📄 Offer letter ✓ Due diligence
Listing remarks
This house has not been lived in since 2022. A solid brick home on a level lot in need of some renovation, being sold together with the adjoining lot (#2 BLK A BLANTON S/D . 31 acres: 22388 ) The listing is being sold as is, no repairs will be undertaken. Both lots have mature trees.
Key facts
- 0.38 acre lot
- Parking
- Built 1964
Property features AI
Finance
- Other: No representation restrictions listed
- HOA & community: Not subject to an HOA
Exterior
- Parking: Attached carport; 1 carport space; 3 open parking spaces
- Utilities: City water; Public sewer
- Home design: Single-family residence (residential); One level
- Construction: Site-built construction; Brick exterior; Composition roof; Crawl space foundation; R10 zoning
- Exterior features: Concrete and paved roads with public maintenance; Shed(s) on the property; Additional parcel(s) included
Interior
- Kitchen: No appliances included
- Bedrooms: 3 bedrooms on the main level
- Bathrooms: 1 full bath; 1 half bath
- Heating & cooling: Central heating; Forced air heating; Central air conditioning
- Interior features: 8 total rooms; Fireplaces in the family room and living room
- Laundry & utility: No laundry hookups or room specified
Neighborhood map
What this means for you Summary
Snapshot
- This is a 3-bed/1.5-bath single-family listed at $145k.
Deal economics
- At list price, monthly cash flow is $108 ($1k/yr) — positive.
- The deal already cash-flows at list — no discount required.
- To meet the 1% rule (rent ≥ 1% of price), the offer needs to be $135k (6.8% below list).
- Recommended offer: $135k (6.8% below list) — sets the bar for 1% rule.
- Cap rate 7.2% vs local median 2.9% in Shelby — top-decile yield for the area; either an underpriced asset or a hidden risk that comps aren't pricing in. Stress-test before assuming the spread holds.
Location & tenants
- Location reads 75/100 on livability (#52 in NC, #4,349 nationally) — a middle-class / working-renter tenant base. Strengths: commute A+, cost of living A+, housing A+; Watch: crime F, employment F.
- Cleveland County Schools (rural): math 47% / reading 49% proficiency, ranked #76 of 178 in NC (top 43%) — families likely to look elsewhere, expect single-tenant / working-renter base with shorter leases.
- Zoned schools: Washington Elementary (math 42% / reading 37%, grade F, #694 of 1,410 statewide, top 53%, 415 students, 99% FRL); Burns High (math 42% / reading 59%, grade D+, #306 of 535 statewide, top 57%, 934 students, 60% FRL) — zoned schools average 80% FRL vs 59% district-wide (20 pts higher); higher-poverty schools than district average — tighter screening recommended.
- Market conditions: Rents rising fast (+6.7%/yr); 241 active listings in the ZIP; 461 units permitted in Cleveland County in 2024 (38 in 5+ unit buildings).
Forward outlook
- Local home prices are declining (-3.0%/yr); year-one equity from $1k of loan paydown is wiped out by about $4k of value loss. Plan a longer hold.
- Cleveland County population projected at -15% by 2050 — secular population decline; favor cash flow + early exit over multi-decade hold.
Negotiation context
- Only 2 days on market — expect competitive offers; lowballing is unlikely to land.
Risks & watch-outs
- Climate carrying-cost: extreme-heat days projected 7→17/yr by 2055 (HVAC capex compounding) — expect insurance premiums to compound above CPI over the hold.
Questions for the listing agent
- Built in 1964 — when were the roof, HVAC, electrical panel, plumbing, and water heater last replaced?
- Is there a deadline driving the sale (1031 exchange, divorce, estate, relocation)? That informs how much negotiation room exists.
- Schools are D-rated, which usually means shorter tenancies and higher turnover. Who's the typical renter profile here, and what's been the actual vacancy rate?
- Crime grade is F in this area — have there been break-ins, vandalism, or insurance claims at this property in the last 3 years? What carrier currently insures it and at what premium?
- What's the average days-on-market for RENTAL listings here right now (not sales)? A rising rental-DOM trend means longer vacancies and softer asking-rent achievability than the comps imply.
- What's the recent tenant-quality profile in this submarket — average credit score on applications, eviction rate, late-payment / NSF rate, and stable-employment percentage? A property-management company in the area should have these aggregated.
- How much new for-sale + rental construction is in the pipeline within 1–3 miles? Heavy new supply typically softens prices + rents 12–24 months out; constrained supply supports both.
Investment metrics
- 1% rule
- 0.93% ✗
- Cap rate
- 7.18%
- Cash-on-cash
- 3.18%
- DSCR
- 1.14
- GRM
- 8.9
CMA / ARV
- ARV (on-the-fly)
- $242,649
- Comps found
- 9
Show comp detail 9 sales within ~0.75 mi
| Address | Dist | Beds/Ba | Sqft | Sold | Price | $/sf | Match |
|---|---|---|---|---|---|---|---|
| 746 Vale St | 0.55mi | 3/1.5 | 1,428 (+1%) | 1mo | $200,000 | $140 | 72 |
| 1200-1 Stanton Dr | 0.26mi | 4/2.0 (+1) | 1,501 (+6%) | 8mo | $257,000 | $171 | 64 |
| 915 Airport Rd | 0.25mi | 3/1.5 | 1,626 (+15%) | 4mo | $340,000 | $209 | 61 |
| 226 T R Harris Dr #56 | 0.40mi | 2/2.0 (-1) | 1,505 (+6%) | 9mo | $415,000 | $276 | 57 |
| 412 E Ross Grove Rd | 0.40mi | 3/1.0 | 1,272 (-10%) | 13mo | $174,400 | $137 | 52 |
| 1013 Hardin Dr | 0.41mi | 4/2.0 (+1) | 1,350 (-5%) | 23mo | $200,000 | $148 | 47 |
| 951 Hardin Dr | 0.49mi | 3/2.0 | 1,225 (-14%) | 8mo | $265,000 | $216 | 46 |
| 513 Piedmont Ave | 0.49mi | 3/1.5 | 1,553 (+9%) | 22mo | $210,000 | $135 | 44 |
| 206 Merit Dr | 0.72mi | 3/2.0 | 1,349 (-5%) | 18mo | $259,000 | $192 | 41 |
Match score weights: distance 35% · size 25% · config 20% · recency 20%. Top-matched comps best support the ARV.
Projected returns pro-forma
-3.0% appreciation · 6.66% rent growth · sell at horizon
- IRR
- -7.4%
- Equity multiple
- 0.72×
- Total profit
- $-11,487
- Equity at exit
- $21,620
- IRR
- 6.2%
- Equity multiple
- 1.53×
- Total profit
- $21,625
- Equity at exit
- $12,537
Cash invested: $40,600 (down + closing). Projections, not guarantees.
Landlord ↔ Tenant lean methodology
- Overall (STATE)
- 85 Strongly Landlord-Friendly
- State North Carolina
- 85 Strongly Landlord-Friendly · R+3
- County
- — inherits STATE
- City
- — inherits STATE
ZIP-level market 28150
- Home prices YoY
- -2.0%
- Rents YoY
- 6.7%
- Active inventory
- 241
- Price-to-rent
- 8.9×
Monthly cashflow live
- Estimated rent
- $1,351 medium interval (Pro) →
- Mortgage (P&I)
- −$760
- Tax from tax record
- −$139 /mo · $1,664/yr
- Insurance
- −$60
- HOA
- −$0
- Vacancy / Maint / Mgmt
- −$284
- Net cashflow
- $108
Break-even live
UW: 25.0% down · 7.5% · 30yr · 1.5% tax · 5.0% vac · 8.0% maint · 8.0% mgmt
Financing live
Cash to close
- Down payment
- $36,250
- Closing costs
- $4,350
- Reserves months
- —
- Total cash needed
- —
Loan-product check · same deal, 3 products live
Conventional
25% down · 7.5% · 30yr
- Down + closing
- —
- Monthly P&I
- —
- Monthly cashflow
- —
- DSCR
- —
- Eligible?
- —
Personal DTI + credit; lowest rate.
DSCR
20% down · 8.5% · 30yr
- Down + closing
- —
- Monthly P&I
- —
- Monthly cashflow
- —
- DSCR
- —
- Eligible?
- —
No personal income docs; deal must DSCR.
Hard money
10% down · 12.0% · 12mo
- Down + closing
- —
- Monthly P&I
- —
- Monthly cashflow
- —
- DSCR
- —
- Eligible?
- —
Short-term bridge; refi at stabilization.
Listing history 3 events
-
2026-05-16status Pending
-
2026-05-15$145,000 Active
-
2026-05-13historical $145,000
ⓘ Source: listings_history table (triggers on properties + properties_extension) + one-shot
backfill from property_details.listing_events for pre-trigger history.
Tax reassessment forecast NC · Resets to sale price
- Current annual tax
- $1,664 · $139/mo
- Projected year-2 tax
- $1,664 · $139/mo
- Expected delta
- $0/yr ($0/mo · 0.0%)
ⓘ Screening estimate from a state-policy table — verify with the county assessor before closing.
Climate risk First Street
- Flood 1/10 Low FEMA zone X (unshaded) · 0% chance over 30 yrs
- Wildfire 3/10 Moderate
- Heat 5/10 Major 7 d/yr ≥104°F today · 17 d/yr by 30 yrs out
- Wind 3/10 Moderate 4% chance of damaging wind over 30 yrs
- Air quality 3/10 Moderate 3 unhealthy d/yr today · 4 by 30 yrs out
Nearby sold comps map
Loading sold comps map…
Walkable amenities ~0.75 mi
Loading nearby amenities…
Taxation est. · year 1
- Rental income
- $16,210
- − Mortgage interest
- −$8,122
- − Property taxes
- −$1,664
- − Insurance
- −$725
- − Repairs & maintenance
- −$1,297
- − Management
- −$1,297
- − Depreciation
- −$4,218
- Taxable loss
- −$1,113
- Est. tax savings @ 24.0%
- +$267
- After-tax cash flow
- $1,559/yr
For passive investors: Depreciation is non-cash, so a rental often shows a tax loss while cash-flowing — sheltering income. Rental losses are passive: they offset passive income freely, and up to $25,000/yr can offset ordinary (W-2) income if you actively participate and your MAGI is under $100k (phasing out to $0 by $150k); unused losses carry forward. On sale, claimed depreciation is recaptured at up to 25%, and gains may owe capital-gains tax (a 1031 exchange can defer both). Figures are a year-1 estimate at your 24.0% rate — not tax advice; consult a CPA.
Schools (NCES district)
- District
- Cleveland County Schools
- NCES district ID
- 3700900
- Math proficiency
- 47% ▬ 0.00%
- Reading proficiency
- 49% ▲ 4.00%
- Median HH income
- $38,501
- Composite
- 40.03/100
- National rank
- #3823
- State rank
- #76 of 178 in NC
Livability — Shelby
- Score
- 75/100
- State rank
- #52
- US rank
- #4349
Category grades
Schools grade is shown separately in the Schools card above.
Census & demographics
- Census place
- Shelby, NC
- County
- Cleveland County · 83,736 people
- City population
- 26,134
- Metro
- Shelby, NC
- Population (ZIP)
- 28,142
- Household income
- $55,832
- Rent vs Own
- Severe rent burden
- 790.0
Population outlook (Cleveland County) Hauer SSP2
- Today (2025)
- 93,671 people
- By 2030
- 91,157 · -2.7%
- By 2040
- 85,519 · -8.7%
- By 2050
- 79,708 · -14.9%
- By 2075
- 68,317 · -27.1%
- By 2100
- 57,145 · -39.0%
Race, ethnicity, and origin ACS 2023
- Neighborhood character
- Majority White (62%)
- Race & ethnicity
- White 62% Black 27% Two or more races 5% Hispanic / Latino 5%
- Common ancestry
- Serbian 2% Italian 2% Lithuanian 1%
- Foreign-born
- 3% · Canada, Jamaica
- Languages at home
- 95% English-only · Spanish 4%
Political lean MEDSL · Cleveland
- 2024 margin
- Solid R (+35.0) · D 32.2% · R 67.2%
- 2008→2024 swing
- -15.1pp toward R · 2008: -19.9pp · 2024: -35.0pp
- All cycles
- 2024: R+35.0 2020: R+32.8 2016: R+30.6 2012: R+20.5 2008: R+19.9
Not yet ingested
- Civics
- —
Market trends
- HPI YoY
- ▼ -8.92%
- Current HPI
- 447.16
- Rent YoY
- ▲ 6.66%
- Metro
- Shelby, NC
- State GDP YoY
- ▲ 3.28%
- F500 in state
- 26
Industry mix (Fortune 500 HQ in NC)
| Industry | F500 HQs | Revenue |
|---|---|---|
| Financial Services | 2 | $213B |
|
||
| Retail | 2 | $95B |
|
||
| Industrial Conglomerate | 1 | $38B |
|
||
| Metals / Steel | 1 | $35B |
|
||
| Utilities | 1 | $30B |
|
||
| Industrial Machinery | 1 | $19B |
|
||
Price history
+0.0% since first listed3 events — show timeline
- 2026-05-16 Pending — CANOPYMLS as Distributed by MLS Grid
- 2026-05-15 Listed $145,000 CANOPYMLS as Distributed by MLS Grid
- 2026-05-13 Coming Soon $145,000 CANOPYMLS as Distributed by MLS Grid
Property tax history
+4.1%/yrLatest (2025): $1,664 · +24.1% YoY. Source: county tax records.
Cash-flow waterfall
monthlySold comps — $/sqft
last 12 mo · ≤1 miLoading sold comps…