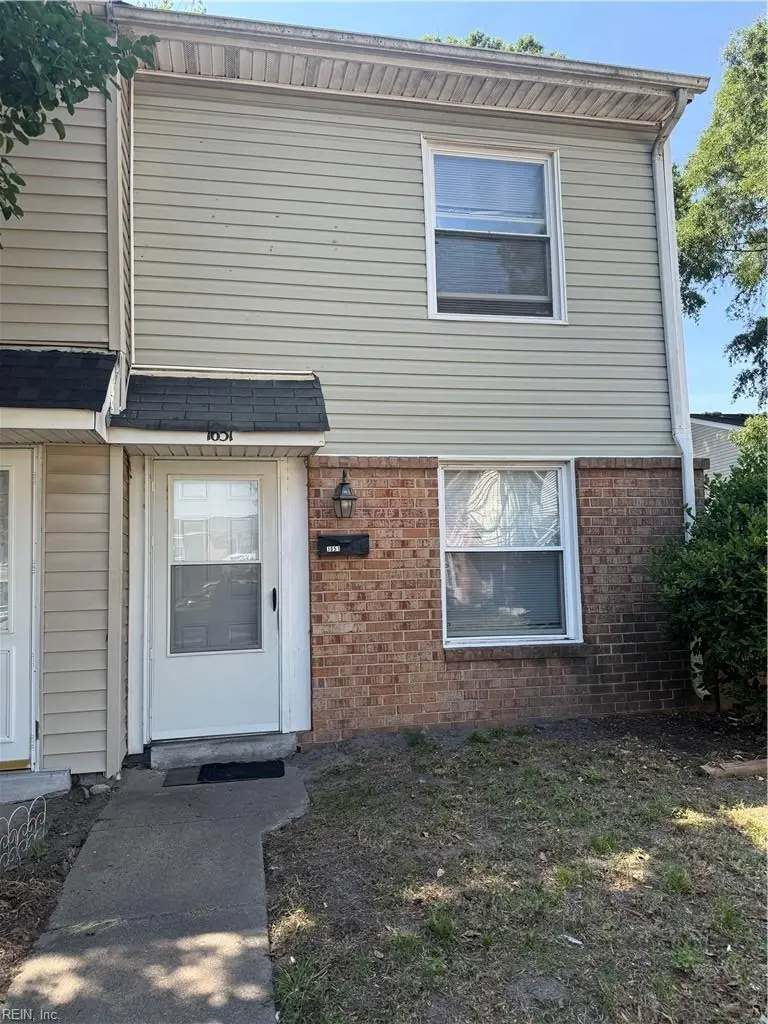
1651 Darren Cir · Portsmouth, VA
Flood risk 1/10 · Minimal
- FEMA flood zone
- X (unshaded)
- Chance of flooding over 30 yrs
- 0.0%
- Est. flood insurance / yr
- $507 – $1,088
Fire risk 1/10 · Minimal
- Est. fire insurance / yr
- $666 – $1,236
Heat risk 9/10 · Severe
- Hot days now (above 106°F)
- 7 days/yr
- Hot days in 30 yrs
- 16 days/yr
Wind risk 8/10 · Major
- Chance of severe wind over 30 yrs
- 80.0%
Air-quality risk 2/10 · Minimal
- Unhealthy air days now
- 2 days/yr
- Unhealthy air days in 30 yrs
- 2 days/yr
Risk factors via First Street. Map © Google.
Why this score? — see what drove the B- grade
The composite is a weighted blend of 9 inputs, each scored 0–100. Each bar is that input's sub-score; the figure is the points it added to the 100-point composite (weight × sub-score).
- Cash flow +25.2/30.0
- 1% rule +9.7/10.0
- DSCR +8.3/10.0
- ARV discount +7.5/15.0
- Rent growth +5.0/5.0
- Schools +3.9/10.0
- Livability +3.7/5.0
- Condition / age +2.5/5.0
- Appreciation +0.0/10.0
$105,000
🖨 Deal sheet 📄 Offer letter ✓ Due diligence
Listing remarks
Very well maintained. Tenant is very cooperative and pays $1200.00 a month.
Key facts
- $300 HOA
- Parking
- Built 1977
Property features AI
Finance
- HOA & community: HOA: Charlestown Condominiums; Managed by Management Association Group; Condo fee $300 per month
Exterior
- Parking: 1 space
- Utilities: City/County water; City/County sewer; Electric water heater; Electric power
- Home design: Attached condo; Contemporary style; 2 stories; Condo on level 2; Entry on slab foundation
- Construction: Asphalt shingle roof; Slab foundation
- Exterior features: Brick siding; Back fenced
Interior
- Kitchen: Dishwasher; Microwave; Electric range; Refrigerator
- Bedrooms: Bedroom; Master bedroom
- Flooring: Carpet; Vinyl
- Bathrooms: 1 full bathroom
- Heating & cooling: Heat pump; Central air
- Interior features: Scuttle access; Attic; Breakfast area; Utility closet
- Laundry & utility: Washer; Dryer; Utility room (on level 1)
Neighborhood map
What this means for you Summary
Snapshot
- This is a 2-bed/1.0-bath condo listed at $105k.
Deal economics
- At list price, monthly cash flow is $236 ($3k/yr) — positive.
- The deal already cash-flows at list — no discount required.
- Meets the 1% rule at list price ($2k rent vs $105k).
- Recommended offer: $102k (3.0% below list) — sets the bar for market timing.
- Cap rate 9.0% vs local median 4.6% in Portsmouth — top-decile yield for the area; either an underpriced asset or a hidden risk that comps aren't pricing in. Stress-test before assuming the spread holds.
Location & tenants
- Location reads 73/100 on livability (#172 in VA) — a middle-class / working-renter tenant base. Strengths: amenities A+, cost of living A+, housing A+; Watch: employment C-, crime F, commute F.
- Portsmouth City Public School District (urban): math 34% / reading 58% proficiency, ranked #107 of 131 in VA (top 82%) — families likely to look elsewhere, expect single-tenant / working-renter base with shorter leases.
- Zoned schools: Hodges Manor Elementary (math 32% / reading 57%, grade F, #827 of 1,108 statewide, top 77%, 499 students, 100% FRL); I.C. Norcom High (math 39% / reading 58%, grade D, #301 of 319 statewide, top 95%, 1,043 students, 100% FRL) — zoned schools average 100% FRL vs 60% district-wide (40 pts higher); higher-poverty schools than district average — tighter screening recommended.
- Market conditions: Rents rising fast (+11.9%/yr); 167 active listings in the ZIP; 12 comparable units currently listed for rent nearby; rentals at typical pace (median 24d on market — plan ~3-4 weeks tenant-placement turnaround); 300 units permitted in Portsmouth city in 2024 (112 in 5+ unit buildings).
Forward outlook
- Local home prices are declining (-3.0%/yr); year-one equity from $726 of loan paydown is wiped out by about $3k of value loss. Plan a longer hold.
- At projected returns (-3.0% appreciation + 8.0% rent growth), your $29k cash investment doubles in ~7 years — after that, you're playing with house money.
Negotiation context
- It's been on market 31 days — a 3% lower offer ($102k) is reasonable based on typical stale-listing flexibility.
- 10 sale attempts since 7y ago with the ask held roughly flat each time — persistent listings suggest the price (not the market) is what's stuck; bring a comps-based counter.
Risks & watch-outs
- Climate carrying-cost: severe wind risk, 80% chance of damaging wind over 30y; extreme-heat days projected 7→16/yr by 2055 (HVAC capex compounding) — expect insurance premiums to compound above CPI over the hold.
Questions for the listing agent
- It's been on market 31 days. Have you received any prior offers? Is the seller open to a 3% concession, seller financing, or rate buy-down credit?
- Built in 1977 — when were the roof, HVAC, electrical panel, plumbing, and water heater last replaced?
- What does the HOA fee cover, when was the last increase, and are there any pending special assessments or reserve-fund shortfalls?
- Any open or pending special assessments — roof, HVAC, plumbing, elevator, façade? What's the per-unit balance and payoff schedule, and is the seller paying it off at close or rolling it to the buyer?
- Is there a deadline driving the sale (1031 exchange, divorce, estate, relocation)? That informs how much negotiation room exists.
- Schools are B-rated — typically a magnet for longer-tenancy family renters. What's the average tenant stay here, and is there a school-zone premium baked into asking?
- Crime grade is F in this area — have there been break-ins, vandalism, or insurance claims at this property in the last 3 years? What carrier currently insures it and at what premium?
- What's the average days-on-market for RENTAL listings here right now (not sales)? A rising rental-DOM trend means longer vacancies and softer asking-rent achievability than the comps imply.
- What's the recent tenant-quality profile in this submarket — average credit score on applications, eviction rate, late-payment / NSF rate, and stable-employment percentage? A property-management company in the area should have these aggregated.
- How much new apartment / multifamily construction is in the pipeline within 1–3 miles? Heavy new supply (>2% of stock underway) typically softens rents 12–24 months out; light construction supports rent growth.
Investment metrics
- 1% rule
- 1.47% ✓
- Cap rate
- 8.99%
- Cash-on-cash
- 9.63%
- DSCR
- 1.43
- GRM
- 5.7
CMA / ARV
No comps found within radius.
Projected returns pro-forma
-3.0% appreciation · 8.0% rent growth · sell at horizon
- IRR
- 5.2%
- Equity multiple
- 1.22×
- Total profit
- $6,360
- Equity at exit
- $15,656
- IRR
- 19.6%
- Equity multiple
- 3.14×
- Total profit
- $62,794
- Equity at exit
- $9,078
Cash invested: $29,400 (down + closing). Projections, not guarantees.
Landlord ↔ Tenant lean methodology
- Overall (STATE)
- 55 Moderately Landlord-Leaning
- State Virginia
- 55 Moderately Landlord-Leaning · D+2
- County
- — inherits STATE
- City
- — inherits STATE
ZIP-level market 23701
- Rents YoY
- 11.9%
- Active inventory
- 167
- Price-to-rent
- 5.7×
Monthly cashflow live
- Estimated rent
- $1,545 high interval (Pro) →
- Mortgage (P&I)
- −$551
- Tax from tax record
- −$90 /mo · $1,084/yr
- Insurance
- −$44
- HOA
- −$300
- Vacancy / Maint / Mgmt
- −$324
- Net cashflow
- $236
Break-even live
UW: 25.0% down · 7.5% · 30yr · 1.5% tax · 5.0% vac · 8.0% maint · 8.0% mgmt
Financing live
Cash to close
- Down payment
- $26,250
- Closing costs
- $3,150
- Reserves months
- —
- Total cash needed
- —
Loan-product check · same deal, 3 products live
Conventional
25% down · 7.5% · 30yr
- Down + closing
- —
- Monthly P&I
- —
- Monthly cashflow
- —
- DSCR
- —
- Eligible?
- —
Personal DTI + credit; lowest rate.
DSCR
20% down · 8.5% · 30yr
- Down + closing
- —
- Monthly P&I
- —
- Monthly cashflow
- —
- DSCR
- —
- Eligible?
- —
No personal income docs; deal must DSCR.
Hard money
10% down · 12.0% · 12mo
- Down + closing
- —
- Monthly P&I
- —
- Monthly cashflow
- —
- DSCR
- —
- Eligible?
- —
Short-term bridge; refi at stabilization.
Rent comps 12 comps
| Address | Beds | Baths | Sqft | Rent | $/sqft | DOM | Units | Dist |
|---|---|---|---|---|---|---|---|---|
| 4642 Greenwood Dr Portsmouth, VA | 2.0 | 1.0 | 946 | $1,550 | $1.64 | 43d | 1 | 0.22mi |
| 840 Lancer Dr Unit 615 Portsmouth, VA | 2.0 | 1.5 | 1002 | $1,288 | $1.29 | 23d | 1 | 0.67mi |
| 200 Chowan Dr Portsmouth, VA | 1.0–2.0 | 1.0–2.0 | 737 | $1,600 | $2.17 | 2d | 8 | 0.68mi |
| 940 Chumley Rd Portsmouth, VA | 1.0 | 1.0 | 760 | $1,165 | $1.53 | 43d | 1 | 0.72mi |
| 902 Liston Ln Portsmouth, VA | 3.0 | 1.0 | 1039 | $1,785 | $1.72 | 23d | 1 | 0.90mi |
| 1008 Cherokee Rd Portsmouth, VA | 1.0–2.0 | 1.0 | 835 | $1,345 | $1.61 | 43d | 1 | 1.14mi |
| 26 Byers Ave Portsmouth, VA | 2.0 | 1.0 | 1008 | $1,575 | $1.56 | 43d | 1 | 1.29mi |
| 804 City Park Ave Portsmouth, VA | 1.0 | 1.0 | 650 | $1,350 | $2.08 | 23d | 1 | 1.36mi |
| 816 Martin Ave Portsmouth, VA | 3.0 | 1.0 | 1100 | $2,195 | $2.00 | 3d | 1 | 1.39mi |
| 13 Hedge Ln Unit I Portsmouth, VA | 2.0 | 1.5 | 816 | $1,275 | $1.56 | 7d | 1 | 1.46mi |
| 98 Francis St Portsmouth, VA | 2.0 | 2.0 | 984 | $1,395 | $1.42 | 14d | 1 | 1.49mi |
| 102 Francis St #98 Portsmouth, VA | 2.0 | 1.5 | 1000 | $1,395 | $1.40 | 16d | 1 | 1.50mi |
HOA detail condo
- Monthly dues
- $300 · $3,600/yr
- Assessments
- None detected in remarks — confirm with the listing agent.
Listing history 32 events
-
2026-06-18days on market $105,000 Active 31 DOM
-
2026-06-17days on market $105,000 Active 30 DOM
-
2026-06-16days on market $105,000 Active 29 DOM
-
2026-06-15days on market $105,000 Active 28 DOM
-
2026-06-13days on market $105,000 Active 26 DOM
-
2026-06-09days on market $105,000 Active 22 DOM
-
2026-06-08days on market $105,000 Active 21 DOM
-
2026-06-07days on market $105,000 Active 20 DOM
-
2026-06-03days on market $105,000 Active 16 DOM
-
2026-06-02days on market $105,000 Active 15 DOM
-
2026-06-01days on market $105,000 Active 14 DOM
-
2026-05-31days on market $105,000 Active 13 DOM
-
2026-05-15$105,000 Active
-
2025-06-04historical
-
2025-04-15status Active
-
2025-02-13historical Active Under Contract
-
2025-02-04$92,000 Active
-
2025-01-01historical
-
2024-11-05price $95,000
-
2024-10-10status Active
-
2024-10-08historical
-
2024-09-28$100,000 Active
-
2024-09-20historical
-
2024-09-17status Active
-
2024-09-04historical Active Under Contract
-
2024-06-20$100,000 Active
-
2023-01-31status Under Contract
-
2023-01-27$80,000 Active
-
2019-05-19status Under Contract
-
2019-05-13$50,000 Active
-
2019-03-26historical
-
2019-01-18$70,000 Active
ⓘ Source: listings_history table (triggers on properties + properties_extension) + one-shot
backfill from property_details.listing_events for pre-trigger history.
Tax reassessment forecast VA · Resets to sale price
- Current annual tax
- $1,084 · $90/mo
- Projected year-2 tax
- $1,084 · $90/mo
- Expected delta
- $0/yr ($0/mo · 0.0%)
ⓘ Screening estimate from a state-policy table — verify with the county assessor before closing.
Climate risk First Street
- Flood 1/10 Low FEMA zone X (unshaded) · 0% chance over 30 yrs
- Wildfire 1/10 Low
- Heat 9/10 Extreme 7 d/yr ≥106°F today · 16 d/yr by 30 yrs out
- Wind 8/10 Severe 80% chance of damaging wind over 30 yrs
- Air quality 2/10 Low 2 unhealthy d/yr today · 2 by 30 yrs out
Nearby sold comps map
Loading sold comps map…
Walkable amenities ~0.75 mi
Loading nearby amenities…
Taxation est. · year 1
- Rental income
- $18,542
- − Mortgage interest
- −$5,882
- − Property taxes
- −$1,084
- − Insurance
- −$525
- − Repairs & maintenance
- −$1,483
- − Management
- −$1,483
- − HOA
- −$3,600
- − Depreciation
- −$3,055
- Taxable income
- $1,430
- Est. tax owed @ 24.0%
- −$343
- After-tax cash flow
- $2,488/yr
For passive investors: Depreciation is non-cash, so a rental often shows a tax loss while cash-flowing — sheltering income. Rental losses are passive: they offset passive income freely, and up to $25,000/yr can offset ordinary (W-2) income if you actively participate and your MAGI is under $100k (phasing out to $0 by $150k); unused losses carry forward. On sale, claimed depreciation is recaptured at up to 25%, and gains may owe capital-gains tax (a 1031 exchange can defer both). Figures are a year-1 estimate at your 24.0% rate — not tax advice; consult a CPA.
Schools (NCES district)
- District
- Portsmouth City Public School District
- NCES district ID
- 5103000
- Math proficiency
- 34% ▼ -40.00%
- Reading proficiency
- 58% ▼ -12.00%
- Median HH income
- $46,152
- Composite
- 39.01/100
- National rank
- #4071
- State rank
- #107 of 131 in VA
Livability — Portsmouth
- Score
- 73/100
- State rank
- #172
- US rank
- #5381
Category grades
Schools grade is shown separately in the Schools card above.
Census & demographics
- Census place
- Portsmouth, VA
- County
- Portsmouth City · 96,366 people
- City population
- 96,366
- Metro
- Virginia Beach-Norfolk-Newport News, VA-NC
- Population (ZIP)
- 24,298
- Household income
- $62,349
- Rent vs Own
- Severe rent burden
- 580.0
Population outlook (Portsmouth County) Hauer SSP2
- Today (2025)
- 96,730 people
- By 2030
- 96,760 · +0.0%
- By 2040
- 96,573 · -0.2%
- By 2050
- 95,606 · -1.2%
- By 2075
- 93,579 · -3.3%
- By 2100
- 83,756 · -13.4%
Race, ethnicity, and origin ACS 2023
- Neighborhood character
- Diverse neighborhood (Simpson 0.58)
- Race & ethnicity
- Black 52% White 39% Two or more races 6% Hispanic / Latino 3%
- Common ancestry
- Italian 1% Romanian 1% Slovak 1%
- Foreign-born
- 2% · Canada
- Languages at home
- 96% English-only · Spanish 2%
Political lean MEDSL · Portsmouth
- 2024 margin
- Solid D (+38.6) · D 68.6% · R 30.0% · Other 1.4%
- 2008→2024 swing
- -0.7pp no change · 2008: 39.3pp · 2024: 38.6pp
- All cycles
- 2024: D+38.6 2020: D+40.8 2016: D+36.5 2012: D+39.6 2008: D+39.3
Not yet ingested
- Civics
- —
Market trends
- HPI YoY
- ▼ -218.96%
- Current HPI
- 310.8218
- Rent YoY
- ▲ 11.92%
- Metro
- Virginia Beach-Norfolk-Newport News, VA-NC
- State GDP YoY
- ▲ 2.40%
- F500 in state
- 50
Industry mix (Fortune 500 HQ in VA)
| Industry | F500 HQs | Revenue |
|---|---|---|
| Aerospace / Defense | 4 | $236B |
|
||
| Technology / Defense | 3 | $32B |
|
||
| Financial Services | 2 | $176B |
|
||
| Utilities | 2 | $27B |
|
||
| Insurance | 2 | $25B |
|
||
| Technology | 2 | $15B |
|
||
Price history
+50.0% since first listed20 events — show timeline
- 2026-05-15 Listed $105,000 REINMLS
- 2025-06-04 Listing Removed — REINMLS
- 2025-04-15 Relisted — REINMLS
- 2025-02-13 Contingent — REINMLS
- 2025-02-04 Listed $92,000 REINMLS
- 2025-01-01 Listing Removed — REINMLS
- 2024-11-05 Price Changed $95,000 REINMLS
- 2024-10-10 Relisted — REINMLS
- 2024-10-08 Listing Removed — REINMLS
- 2024-09-28 Listed $100,000 REINMLS
- 2024-09-20 Listing Removed — REINMLS
- 2024-09-17 Relisted — REINMLS
- 2024-09-04 Contingent — REINMLS
- 2024-06-20 Listed $100,000 REINMLS
- 2023-01-31 Pending — REINMLS
- 2023-01-27 Listed $80,000 REINMLS
- 2019-05-19 Pending — REINMLS
- 2019-05-13 Listed $50,000 REINMLS
- 2019-03-26 Listing Removed — REINMLS
- 2019-01-18 Listed $70,000 REINMLS
Property tax history
-2.4%/yrLatest (2025): $1,084 · +13.6% YoY. Source: county tax records.
Cash-flow waterfall
monthlySold comps — $/sqft
last 12 mo · ≤1 miLoading sold comps…