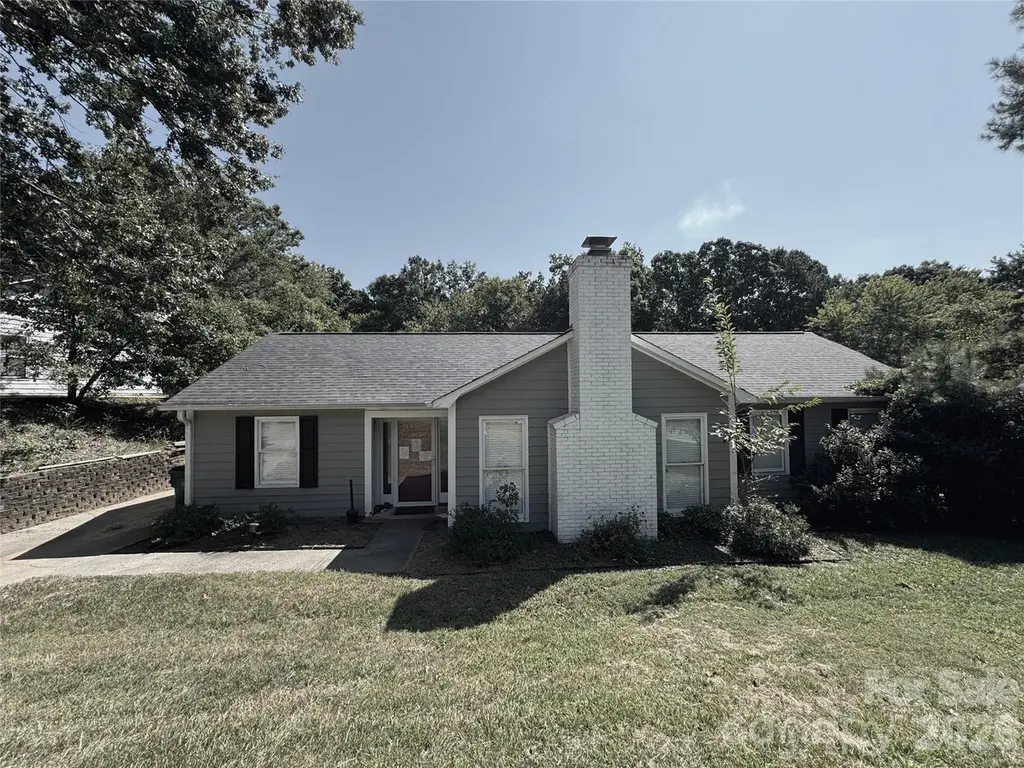
6201 Thermal Rd · Charlotte, NC
Flood risk 1/10 · Minimal
- FEMA flood zone
- X (unshaded)
- Chance of flooding over 30 yrs
- 0.0%
- Est. flood insurance / yr
- $507 – $1,088
Fire risk 3/10 · Minor
- Est. fire insurance / yr
- $906 – $1,684
Heat risk 6/10 · Moderate
- Hot days now (above 105°F)
- 7 days/yr
- Hot days in 30 yrs
- 16 days/yr
Wind risk 6/10 · Moderate
- Chance of severe wind over 30 yrs
- 27.0%
Air-quality risk 3/10 · Minor
- Unhealthy air days now
- 3 days/yr
- Unhealthy air days in 30 yrs
- 4 days/yr
Risk factors via First Street. Map © Google.
Why this score? — see what drove the C+ grade
The composite is a weighted blend of 9 inputs, each scored 0–100. Each bar is that input's sub-score; the figure is the points it added to the 100-point composite (weight × sub-score).
- Cash flow +26.9/30.0
- DSCR +9.3/10.0
- ARV discount +7.5/15.0
- 1% rule +7.3/10.0
- Livability +3.9/5.0
- Schools +3.8/10.0
- Rent growth +3.0/5.0
- Condition / age +2.5/5.0
- Appreciation +0.0/10.0
$166,900
🖨 Deal sheet 📄 Offer letter ✓ Due diligence
Listing remarks MLS
Charming freshly renovated 3 bed 2 bath ranch home features updated light fixtures throughout, a modern white brick wood fireplace, large laundry room, granite countertops & stainless steel appliances all within an open & spacious floorpan. The massive backyard is fully fenced & perfect for outdoor entertaining.
Key facts
- 0.37 acre lot
- Built 1984
Property features AI
Finance
- HOA & community: No HOA
Exterior
- Parking: Driveway
- Utilities: City water; Public sewer; Electric service
- Home design: Single-family residence; One level; Site-built construction
- Construction: Wood construction; Slab foundation
- Exterior features: Back yard with fence; Concrete road access (publicly maintained)
Interior
- Kitchen: Dishwasher; Refrigerator; Electric water heater
- Bedrooms: 3 bedrooms on the main level
- Bathrooms: 2 full bathrooms on the main level
- Heating & cooling: Electric heating with forced air; Central air; Ceiling fans; Other cooling (see remarks)
- Interior features: 9 total rooms; Wood-burning fireplace
- Laundry & utility: Washer/Dryer included; Washer hookup; Electric dryer hookup
Neighborhood map
What this means for you Summary
Snapshot
- This is a 3-bed/2.0-bath single-family listed at $167k.
Deal economics
- At list price, monthly cash flow is $462 ($6k/yr) — positive.
- The deal already cash-flows at list — no discount required.
- Meets the 1% rule at list price ($2k rent vs $167k).
- Cap rate 9.6% vs local median 3.1% in Charlotte — top-decile yield for the area; either an underpriced asset or a hidden risk that comps aren't pricing in. Stress-test before assuming the spread holds.
Location & tenants
- Location reads 78/100 on livability (#26 in NC, #2,502 nationally) — a middle-class / working-renter tenant base. Strengths: amenities A+, commute A+, housing A+; Watch: schools D+, crime F.
- Charlotte-Mecklenburg Schools (urban): math 42% / reading 46% proficiency, ranked #85 of 178 in NC (top 48%) — families likely to look elsewhere, expect single-tenant / working-renter base with shorter leases.
- Market conditions: Rents rising (+2.1%/yr); 250 active listings in the ZIP; 24 comparable units currently listed for rent nearby; rentals leasing fast (median 8d on market — plan ~1-2 weeks tenant-placement turnaround); high-income renter base; 11,969 units permitted in Mecklenburg County in 2024 (5,377 in 5+ unit buildings).
Forward outlook
- Local home prices are declining (-3.0%/yr); year-one equity from $1k of loan paydown is wiped out by about $5k of value loss. Plan a longer hold.
- Mecklenburg County population projected at +53% by 2050 — long-run rental-demand tailwind backs the buy-and-hold thesis.
Negotiation context
- Only 1 days on market — expect competitive offers; lowballing is unlikely to land.
- 6 sale attempts since 9y ago with the ask held roughly flat each time — persistent listings suggest the price (not the market) is what's stuck; bring a comps-based counter.
Risks & watch-outs
- Climate carrying-cost: major wind risk, 27% chance of damaging wind over 30y; extreme-heat days projected 7→16/yr by 2055 (HVAC capex compounding) — expect insurance premiums to compound above CPI over the hold.
Questions for the listing agent
- Is there a deadline driving the sale (1031 exchange, divorce, estate, relocation)? That informs how much negotiation room exists.
- Schools are D-rated, which usually means shorter tenancies and higher turnover. Who's the typical renter profile here, and what's been the actual vacancy rate?
- Crime grade is F in this area — have there been break-ins, vandalism, or insurance claims at this property in the last 3 years? What carrier currently insures it and at what premium?
- What's the average days-on-market for RENTAL listings here right now (not sales)? A rising rental-DOM trend means longer vacancies and softer asking-rent achievability than the comps imply.
- What's the recent tenant-quality profile in this submarket — average credit score on applications, eviction rate, late-payment / NSF rate, and stable-employment percentage? A property-management company in the area should have these aggregated.
- How much new for-sale + rental construction is in the pipeline within 1–3 miles? Heavy new supply typically softens prices + rents 12–24 months out; constrained supply supports both.
Investment metrics
- 1% rule
- 1.23% ✓
- Cap rate
- 9.62%
- Cash-on-cash
- 11.87%
- DSCR
- 1.53
- GRM
- 6.8
CMA / ARV
- ARV (on-the-fly)
- $391,980
- Comps found
- 7
Show comp detail 7 sales within ~0.75 mi
| Address | Dist | Beds/Ba | Sqft | Sold | Price | $/sf | Match |
|---|---|---|---|---|---|---|---|
| 6201 Sellars Ct | 0.08mi | 3/2.0 | 1,529 (+8%) | 12mo | $425,000 | $278 | 73 |
| 6214 Ropley Ct | 0.14mi | 3/2.0 | 1,585 (+12%) | 5mo | $475,000 | $300 | 68 |
| 6443 Round Hill Rd | 0.56mi | 3/2.0 | 1,516 (+8%) | 13mo | $340,000 | $224 | 50 |
| 6418 Tivoli Ct | 0.64mi | 3/2.5 | 1,505 (+7%) | 11mo | $407,500 | $271 | 48 |
| 6409 Pineburr Ct | 0.62mi | 3/2.0 | 1,269 (-10%) | 10mo | $385,000 | $303 | 46 |
| 1001 Pinafore Dr | 0.71mi | 3/2.0 | 1,607 (+14%) | 9mo | $450,000 | $280 | 36 |
| 6440 Tivoli Ct | 0.69mi | 3/2.0 | 1,605 (+14%) | 13mo | $398,000 | $248 | 34 |
Match score weights: distance 35% · size 25% · config 20% · recency 20%. Top-matched comps best support the ARV.
Projected returns pro-forma
-3.0% appreciation · 2.08% rent growth · sell at horizon
- IRR
- 0.3%
- Equity multiple
- 1.01×
- Total profit
- $541
- Equity at exit
- $24,885
- IRR
- 9.0%
- Equity multiple
- 1.66×
- Total profit
- $30,921
- Equity at exit
- $14,430
Cash invested: $46,732 (down + closing). Projections, not guarantees.
Landlord ↔ Tenant lean methodology
- Overall (STATE)
- 85 Strongly Landlord-Friendly
- State North Carolina
- 85 Strongly Landlord-Friendly · R+3
- County
- — inherits STATE
- City
- — inherits STATE
ZIP-level market 28211
- Rents YoY
- 2.1%
- Active inventory
- 250
- Price-to-rent
- 6.8×
Monthly cashflow live
- Estimated rent
- $2,059 high interval (Pro) →
- Mortgage (P&I)
- −$875
- Tax from tax record
- −$219 /mo · $2,632/yr
- Insurance
- −$70
- HOA
- −$0
- Vacancy / Maint / Mgmt
- −$432
- Net cashflow
- $462
Break-even live
UW: 25.0% down · 7.5% · 30yr · 1.5% tax · 5.0% vac · 8.0% maint · 8.0% mgmt
Financing live
Cash to close
- Down payment
- $41,725
- Closing costs
- $5,007
- Reserves months
- —
- Total cash needed
- —
Loan-product check · same deal, 3 products live
Conventional
25% down · 7.5% · 30yr
- Down + closing
- —
- Monthly P&I
- —
- Monthly cashflow
- —
- DSCR
- —
- Eligible?
- —
Personal DTI + credit; lowest rate.
DSCR
20% down · 8.5% · 30yr
- Down + closing
- —
- Monthly P&I
- —
- Monthly cashflow
- —
- DSCR
- —
- Eligible?
- —
No personal income docs; deal must DSCR.
Hard money
10% down · 12.0% · 12mo
- Down + closing
- —
- Monthly P&I
- —
- Monthly cashflow
- —
- DSCR
- —
- Eligible?
- —
Short-term bridge; refi at stabilization.
Rent comps 24 comps
| Address | Beds | Baths | Sqft | Rent | $/sqft | DOM | Units | Dist |
|---|---|---|---|---|---|---|---|---|
| 1422 Thermal Rd Charlotte, NC | 3.0 | 2.0 | 1695 | $2,200 | $1.30 | 8d | 1 | 0.12mi |
| 1440 Jodhpur Ct Charlotte, NC | 3.0 | 2.0 | 1281 | $2,300 | $1.80 | 15d | 1 | 0.20mi |
| 8061 Woodscape Dr Charlotte, NC | 1.0–2.0 | 1.0–2.0 | 740 | $1,892 | $2.56 | 2d | 41 | 0.35mi |
| 7000 Fernwood Dr Charlotte, NC | 1.0–3.0 | 1.0–2.0 | 1050 | $1,950 | $1.86 | 24d | 1 | 0.38mi |
| 7344 Pebblestone Dr Unit C Charlotte, NC | 2.0 | 1.5 | 1316 | $1,515 | $1.15 | 24d | 1 | 0.49mi |
| 2152 Whispering Way Charlotte, NC | 3.0 | 2.5 | 1436 | $1,849 | $1.29 | 5d | 1 | 0.55mi |
| 7321 Pebblestone Dr Unit A Charlotte, NC | 2.0 | 1.5 | 1215 | $1,500 | $1.23 | 24d | 1 | 0.58mi |
| 6341 Round Hill Rd Charlotte, NC | 3.0 | 2.0 | 1484 | $2,199 | $1.48 | 16d | 1 | 0.58mi |
| 7422 Pebblestone Dr Charlotte, NC | 2.0 | 1.5 | 1200 | $1,500 | $1.25 | 24d | 1 | 0.61mi |
| 1700 Charleston Pl Ln Charlotte, NC | 1.0–2.0 | 1.0–2.0 | 763 | $1,380 | $1.81 | 2d | 10 | 0.61mi |
| 7637 Abigail Glen Dr Charlotte, NC | 3.0 | 2.5 | 1536 | $1,795 | $1.17 | 15d | 1 | 0.63mi |
| 2224 Winthrop Chase Dr Charlotte, NC | 2.0 | 2.5 | 1296 | $1,600 | $1.23 | 24d | 1 | 0.68mi |
| 8242 Runaway Bay Dr Charlotte, NC | 1.0–3.0 | 1.0–2.0 | 893 | $2,165 | $2.42 | 3d | 18 | 0.72mi |
| 2300 Village Lake Dr Charlotte, NC | 1.0–3.0 | 1.0–2.0 | 941 | $1,862 | $1.98 | 2d | 35 | 0.75mi |
| 2025 Timber Oaks Ln Charlotte, NC | 1.0–3.0 | 1.0–2.0 | 1064 | $2,055 | $1.93 | 2d | 32 | 0.76mi |
| 6026 Coltswood Ct Charlotte, NC | 3.0 | 2.0 | 1600 | $1,849 | $1.16 | 24d | 1 | 0.79mi |
| 7326 Wallace Rd Charlotte, NC | 1.0–2.0 | 1.0–2.0 | 1018 | $1,743 | $1.71 | 3d | 26 | 0.93mi |
| 1077 Sardis Cove Dr Charlotte, NC | 2.0 | 2.0 | 1139 | $2,075 | $1.82 | 4d | 1 | 1.11mi |
| 11304 E W T Harris Blvd Charlotte, NC | 2.0 | 2.0 | 1100 | $1,625 | $1.48 | 24d | 1 | 1.16mi |
| 6215 Forest Way Dr Charlotte, NC | 2.0 | 1.0–2.0 | 834 | $1,883 | $2.26 | 3d | 42 | 1.35mi |
| 5710 Charing Pl Charlotte, NC | 3.0 | 2.0 | 1555 | $2,495 | $1.60 | 8d | 1 | 1.36mi |
| 7815 Calibre Crossing Dr Charlotte, NC | 1.0–3.0 | 1.0–2.0 | 1026 | $1,874 | $1.83 | 2d | 20 | 1.38mi |
| 9415 Lucy Jane Ln Charlotte, NC | 3.0 | 1.0–2.0 | 859 | $2,200 | $2.56 | 3d | 15 | 1.40mi |
| 2100 Woodway Hills Dr Matthews, NC | 1.0–3.0 | 1.0–2.0 | 974 | $1,514 | $1.55 | 2d | 8 | 1.43mi |
Listing history 3 events
-
2026-06-01status $166,900 Pending 1 DOM
-
2026-05-31remarks 579-char remark
-
2026-05-31$166,900 Active 1 DOM
ⓘ Source: listings_history table (triggers on properties + properties_extension) + one-shot
backfill from property_details.listing_events for pre-trigger history.
Tax reassessment forecast NC · Resets to sale price
- Current annual tax
- $2,632 · $219/mo
- Projected year-2 tax
- $2,632 · $219/mo
- Expected delta
- $0/yr ($0/mo · 0.0%)
ⓘ Screening estimate from a state-policy table — verify with the county assessor before closing.
Climate risk First Street
- Flood 1/10 Low FEMA zone X (unshaded) · 0% chance over 30 yrs
- Wildfire 3/10 Moderate
- Heat 6/10 Major 7 d/yr ≥105°F today · 16 d/yr by 30 yrs out
- Wind 6/10 Major 27% chance of damaging wind over 30 yrs
- Air quality 3/10 Moderate 3 unhealthy d/yr today · 4 by 30 yrs out
Nearby sold comps map
Loading sold comps map…
Walkable amenities ~0.75 mi
Loading nearby amenities…
Taxation est. · year 1
- Rental income
- $24,703
- − Mortgage interest
- −$9,349
- − Property taxes
- −$2,632
- − Insurance
- −$834
- − Repairs & maintenance
- −$1,976
- − Management
- −$1,976
- − Depreciation
- −$4,855
- Taxable income
- $3,080
- Est. tax owed @ 24.0%
- −$739
- After-tax cash flow
- $4,807/yr
For passive investors: Depreciation is non-cash, so a rental often shows a tax loss while cash-flowing — sheltering income. Rental losses are passive: they offset passive income freely, and up to $25,000/yr can offset ordinary (W-2) income if you actively participate and your MAGI is under $100k (phasing out to $0 by $150k); unused losses carry forward. On sale, claimed depreciation is recaptured at up to 25%, and gains may owe capital-gains tax (a 1031 exchange can defer both). Figures are a year-1 estimate at your 24.0% rate — not tax advice; consult a CPA.
Schools (NCES district)
- District
- Charlotte-Mecklenburg Schools
- NCES district ID
- 3702970
- Math proficiency
- 42% ▼ -6.00%
- Reading proficiency
- 46% ▲ 1.00%
- Median HH income
- $57,175
- Composite
- 38.49/100
- National rank
- #4183
- State rank
- #85 of 178 in NC
Livability — Charlotte
- Score
- 78/100
- State rank
- #26
- US rank
- #2502
Category grades
Schools grade is shown separately in the Schools card above.
Census & demographics
- Census place
- Charlotte, NC
- County
- Mecklenburg County · 1,167,319 people
- City population
- 920,422
- Metro
- Charlotte-Concord-Gastonia, NC-SC
- Population (ZIP)
- 33,925
- Household income
- $132,917
- Rent vs Own
- Severe rent burden
- 1383.0
Population outlook (Mecklenburg County) Hauer SSP2
- Today (2025)
- 1,305,740 people
- By 2030
- 1,442,752 · +10.5%
- By 2040
- 1,722,441 · +31.9%
- By 2050
- 1,999,450 · +53.1%
- By 2075
- 2,642,495 · +102.4%
- By 2100
- 3,106,755 · +137.9%
Race, ethnicity, and origin ACS 2023
- Neighborhood character
- Predominantly White (73%)
- Race & ethnicity
- White 73% Black 13% Hispanic / Latino 6% Asian 5% Two or more races 5%
- Hispanic origin (detail)
- Mexican 2%
- Common ancestry
- Slovak 5% Serbian 4% Italian 3%
- Foreign-born
- 11% · Canada, China, Jamaica
- Languages at home
- 88% English-only · Other Indo-European 4% Spanish 4% German/W. Germanic 1%
Political lean MEDSL · Mecklenburg
- 2024 margin
- Solid D (+32.9) · D 65.6% · R 32.7% · Other 1.6%
- 2008→2024 swing
- +8.5pp toward D · 2008: 24.4pp · 2024: 32.9pp
- All cycles
- 2024: D+32.9 2020: D+35.1 2016: D+29.9 2012: D+22.5 2008: D+24.4
Not yet ingested
- Civics
- —
Market trends
- HPI YoY
- ▼ -630.34%
- Current HPI
- 322.1833
- Rent YoY
- ▲ 2.08%
- Metro
- Charlotte-Concord-Gastonia, NC-SC
- State GDP YoY
- ▲ 3.28%
- F500 in state
- 26
Industry mix (Fortune 500 HQ in NC)
| Industry | F500 HQs | Revenue |
|---|---|---|
| Financial Services | 2 | $213B |
|
||
| Retail | 2 | $95B |
|
||
| Industrial Conglomerate | 1 | $38B |
|
||
| Metals / Steel | 1 | $35B |
|
||
| Utilities | 1 | $30B |
|
||
| Industrial Machinery | 1 | $19B |
|
||
Price history
+190.3% since first listed33 events — show timeline
- 2026-05-29 Listed $166,900 CANOPYMLS as Distributed by MLS Grid
- 2025-09-30 Pending — CANOPYMLS as Distributed by MLS Grid
- 2025-09-29 Listed $152,900 CANOPYMLS as Distributed by MLS Grid
- 2022-11-02 Sold (Public Records) $335,000 Public Records
- 2022-11-01 Sold (MLS) $334,900 CANOPYMLS as Distributed by MLS Grid
- 2022-10-10 Contingent — CANOPYMLS as Distributed by MLS Grid
- 2022-09-30 Price Changed $334,900 CANOPYMLS as Distributed by MLS Grid
- 2022-09-16 Price Changed $349,900 CANOPYMLS as Distributed by MLS Grid
- 2022-09-16 Price Changed $364,900 CANOPYMLS as Distributed by MLS Grid
- 2022-08-19 Price Changed $374,900 CANOPYMLS as Distributed by MLS Grid
- 2022-08-10 Price Changed $399,900 CANOPYMLS as Distributed by MLS Grid
- 2022-07-20 Price Changed $409,900 CANOPYMLS as Distributed by MLS Grid
- 2022-06-30 Price Changed $414,900 CANOPYMLS as Distributed by MLS Grid
- 2022-05-27 Price Changed $419,900 CANOPYMLS as Distributed by MLS Grid
- 2022-05-11 Listed $429,900 CANOPYMLS as Distributed by MLS Grid
- 2022-04-28 Sold (Public Records) $395,000 Public Records
- 2018-01-29 Sold (Public Records) $226,500 Public Records
- 2018-01-29 Sold (MLS) $226,500 CANOPYMLS as Distributed by MLS Grid
- 2017-12-25 Contingent — CANOPYMLS as Distributed by MLS Grid
- 2017-12-21 Price Changed $230,000 CANOPYMLS as Distributed by MLS Grid
- 2017-12-14 Relisted — CANOPYMLS as Distributed by MLS Grid
- 2017-12-05 Delisted — CANOPYMLS as Distributed by MLS Grid
- 2017-11-15 Price Changed $239,500 CANOPYMLS as Distributed by MLS Grid
- 2017-11-15 Price Changed $244,500 CANOPYMLS as Distributed by MLS Grid
- 2017-11-07 Price Changed $250,000 CANOPYMLS as Distributed by MLS Grid
- 2017-11-07 Listed $150,000 CANOPYMLS as Distributed by MLS Grid
- 2017-10-11 Sold (Public Records) $135,000 Public Records
- 2017-10-11 Sold (MLS) $135,000 CANOPYMLS as Distributed by MLS Grid
- 2017-09-16 Contingent — CANOPYMLS as Distributed by MLS Grid
- 2017-09-13 Listed $134,900 CANOPYMLS as Distributed by MLS Grid
- 2000-10-04 Sold (Public Records) $105,500 Public Records
- 1986-06-01 Sold (Public Records) $65,000 Public Records
- 1985-09-01 Sold (Public Records) $57,500 Public Records
Property tax history
+4.2%/yrLatest (2025): $2,632 · +2.0% YoY. Source: county tax records.
Cash-flow waterfall
monthlySold comps — $/sqft
last 12 mo · ≤1 miLoading sold comps…