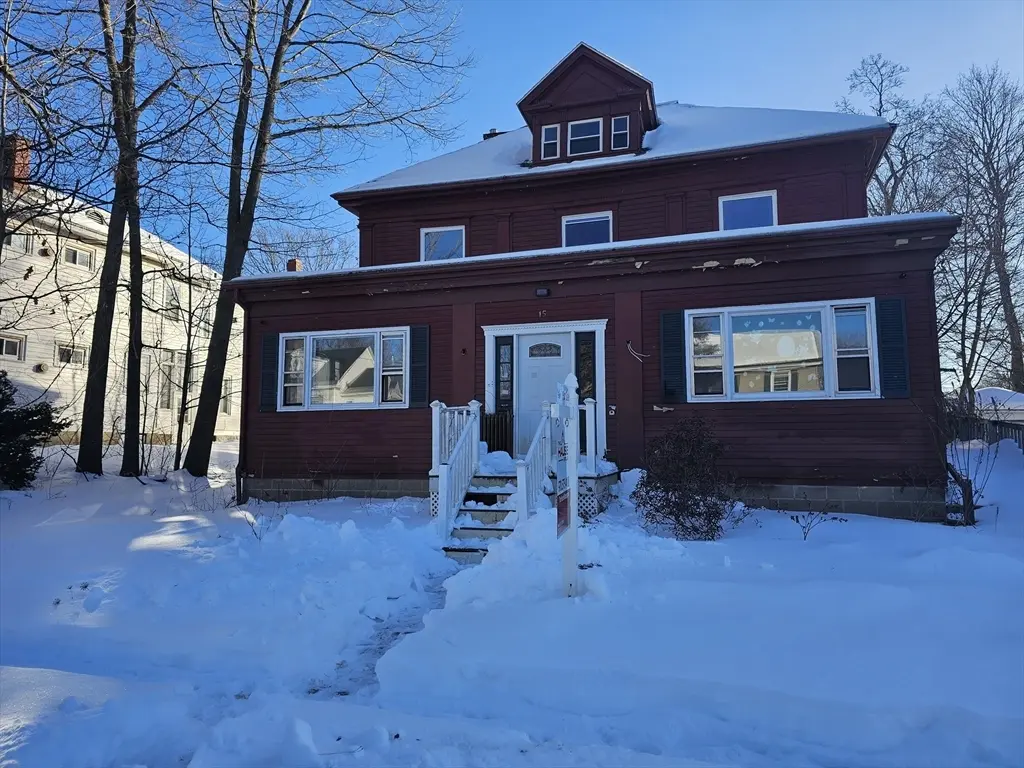
15 Buel St · Pittsfield, MA
Flood risk 1/10 · Minimal
- FEMA flood zone
- X
- Chance of flooding over 30 yrs
- 0.0%
- Est. flood insurance / yr
- $473 – $860
Fire risk 3/10 · Minor
- Est. fire insurance / yr
- $915 – $1,699
Heat risk 2/10 · Minimal
- Hot days now (above 92°F)
- 7 days/yr
- Hot days in 30 yrs
- 16 days/yr
Wind risk 4/10 · Minor
- Chance of severe wind over 30 yrs
- 9.0%
Air-quality risk 2/10 · Minimal
- Unhealthy air days now
- 1 days/yr
- Unhealthy air days in 30 yrs
- 1 days/yr
Risk factors via First Street. Map © Google.
Why this score? — see what drove the B grade
The composite is a weighted blend of 9 inputs, each scored 0–100. Each bar is that input's sub-score; the figure is the points it added to the 100-point composite (weight × sub-score).
- Cash flow +30.0/30.0
- 1% rule +10.0/10.0
- DSCR +10.0/10.0
- ARV discount +7.5/15.0
- Rent growth +4.4/5.0
- Livability +3.8/5.0
- Condition / age +2.5/5.0
- Schools +2.3/10.0
- Appreciation +0.0/10.0
$159,900
🖨 Deal sheet (PDF) 📄 Offer letter ✓ Due diligence
Listing remarks MLS
Come finish the renovation of this expansive 7 bedroom home! This project is ready for your vision and creativity to bring it to fruition! Don't miss this opportunity!
Key facts
- 6,207 sq ft lot
- 2 parking spots
- Built 1905
Neighborhood map
What this means for you Summary
Snapshot
- This is a 4-bed/4.5-bath single-family listed at $160k.
Deal economics
- At list price, monthly cash flow is $749 ($9k/yr) — positive.
- The deal already cash-flows at list — no discount required.
- Meets the 1% rule at list price ($3k rent vs $160k).
- Recommended offer: $141k (12.0% below list) — sets the bar for market timing.
- Cap rate 11.9% vs local median 3.6% in Pittsfield — top-decile yield for the area; either an underpriced asset or a hidden risk that comps aren't pricing in. Stress-test before assuming the spread holds.
Location & tenants
- Location reads 75/100 on livability (#70 in MA, #3,820 nationally) — a middle-class / working-renter tenant base. Strengths: commute A+, housing A+, health & safety A+; Watch: employment C-, amenities D+, schools D.
- Pittsfield (urban): math 19% / reading 34% proficiency, ranked #272 of 302 in MA (top 90%) — low school quality limits family demand, transient renter base, plan for 1-2y turnover.
- Market conditions: Rents rising fast (+7.7%/yr); 276 active listings in the ZIP; 130 units permitted in Berkshire County in 2024 (10 in 5+ unit buildings).
- This rent runs 43% of the median local income ($71k/yr) — at the standard rent-burdened threshold; future hikes will face affordability resistance.
Forward outlook
- Local home prices are declining (-3.0%/yr); year-one equity from $1k of loan paydown is wiped out by about $5k of value loss. Plan a longer hold.
- Berkshire County population projected at -24% by 2050 — secular population decline; favor cash flow + early exit over multi-decade hold.
- At projected returns (-3.0% appreciation + 7.7% rent growth), your $45k cash investment doubles in ~5 years — after that, you're playing with house money.
Negotiation context
- It's been on market 121 days — a 12% lower offer ($141k) is reasonable based on typical stale-listing flexibility.
- 15 sale attempts since 29y ago; this cycle's ask has dropped $40k (20%) from the opening price — seller is motivated, your offer sets the floor, not the list.
Risks & watch-outs
- Watch-outs: property tax is 2.6% of price; built in 1905 — expect roof / HVAC / electrical / plumbing capex.
Questions for the listing agent
- It's been on market 121 days. Have you received any prior offers? Is the seller open to a 12% concession, seller financing, or rate buy-down credit?
- Built in 1905 — when were the roof, HVAC, electrical panel, plumbing, and water heater last replaced?
- Property tax is high relative to price — has the assessment been appealed recently, and will the sale trigger a re-assessment?
- Why hasn't it sold? Are there any deal-killer items the seller is aware of (foundation, flood, title, zoning, code violations)?
- Is there a deadline driving the sale (1031 exchange, divorce, estate, relocation)? That informs how much negotiation room exists.
- Schools are D-rated, which usually means shorter tenancies and higher turnover. Who's the typical renter profile here, and what's been the actual vacancy rate?
- Crime grade is D in this area — have there been break-ins, vandalism, or insurance claims at this property in the last 3 years? What carrier currently insures it and at what premium?
- What's the average days-on-market for RENTAL listings here right now (not sales)? A rising rental-DOM trend means longer vacancies and softer asking-rent achievability than the comps imply.
- What's the recent tenant-quality profile in this submarket — average credit score on applications, eviction rate, late-payment / NSF rate, and stable-employment percentage? A property-management company in the area should have these aggregated.
- How much new for-sale + rental construction is in the pipeline within 1–3 miles? Heavy new supply typically softens prices + rents 12–24 months out; constrained supply supports both.
Investment metrics
- 1% rule
- 1.58% ✓
- Cap rate
- 11.91%
- Cash-on-cash
- 20.07%
- DSCR
- 1.89
- GRM
- 5.3
CMA / ARV
- ARV (median comp)
- $467,183
- List price
- $159,900
- Delta
- -65.77%
- Verdict
- UNDERPRICED
- Comps
- 3 within 1.0 mi
Show comp detail 4 sales within ~0.75 mi
| Address | Dist | Beds/Ba | Sqft | Sold | Price | $/sf | Match |
|---|---|---|---|---|---|---|---|
| 514 South St | 0.68mi | 4/3.5 | 4,009 (+9%) | 1mo | $325,000 | $81 | 48 |
| 75 Broad St | 0.25mi | 5/3.5 (+1) | 3,313 (-10%) | 19mo | $450,000 | $136 | 47 |
| 40 Commonwealth Ave | 0.69mi | 5/2.5 (+1) | 4,078 (+11%) | 8mo | $725,000 | $178 | 30 |
| 20 Spadina Pkwy | 0.69mi | 5/4.0 (+1) | 4,170 (+14%) | 14mo | $790,000 | $189 | 26 |
Match score weights: distance 35% · size 25% · config 20% · recency 20%. Top-matched comps best support the ARV.
Projected returns pro-forma
-3.0% appreciation · 7.72% rent growth · sell at horizon
- IRR
- 17.9%
- Equity multiple
- 1.77×
- Total profit
- $34,497
- Equity at exit
- $23,842
- IRR
- 29.7%
- Equity multiple
- 4.33×
- Total profit
- $148,958
- Equity at exit
- $13,825
Cash invested: $44,772 (down + closing). Projections, not guarantees.
Landlord ↔ Tenant lean methodology
- Overall (STATE)
- 20 Strongly Tenant-Friendly
- State Massachusetts
- 20 Strongly Tenant-Friendly · D+15
- County
- — inherits STATE
- City
- — inherits STATE
ZIP-level market 01201
- Rents YoY
- 7.7%
- Active inventory
- 276
- Price-to-rent
- 5.3×
Monthly cashflow live
- Estimated rent
- $2,532 medium interval (Pro) →
- Mortgage (P&I)
- −$839
- Tax from tax record
- −$347 /mo · $4,159/yr
- Insurance
- −$67
- HOA
- −$0
- Vacancy / Maint / Mgmt
- −$532
- Net cashflow
- $749
Break-even live
Sensitivity live
| Price | -10% $839 | -5% $794 | +0% $749 | +5% $703 | +10% $658 |
|---|---|---|---|---|---|
| Rent | -10% $549 | -5% $649 | +0% $749 | +5% $849 | +10% $949 |
| Rate | -1.0pp $829 | -0.5pp $789 | base $749 | +0.5pp $707 | +1.0pp $665 |
UW: 25.0% down · 7.5% · 30yr · 1.5% tax · 5.0% vac · 8.0% maint · 8.0% mgmt
Financing live
Cash to close
- Down payment
- $39,975
- Closing costs
- $4,797
- Reserves months
- —
- Total cash needed
- —
Loan-product check · same deal, 3 products live
Conventional
25% down · 7.5% · 30yr
- Down + closing
- —
- Monthly P&I
- —
- Monthly cashflow
- —
- DSCR
- —
- Eligible?
- —
Personal DTI + credit; lowest rate.
DSCR
20% down · 8.5% · 30yr
- Down + closing
- —
- Monthly P&I
- —
- Monthly cashflow
- —
- DSCR
- —
- Eligible?
- —
No personal income docs; deal must DSCR.
Hard money
10% down · 12.0% · 12mo
- Down + closing
- —
- Monthly P&I
- —
- Monthly cashflow
- —
- DSCR
- —
- Eligible?
- —
Short-term bridge; refi at stabilization.
Listing history 50 events
-
2026-06-19days on market $159,900 Active 121 DOM
-
2026-06-18days on market $159,900 Active 120 DOM
-
2026-06-17days on market $159,900 Active 119 DOM
-
2026-06-16days on market $159,900 Active 118 DOM
-
2026-06-15days on market $159,900 Active 117 DOM
-
2026-06-14days on market $159,900 Active 115 DOM
-
2026-06-12days on market $159,900 Active 114 DOM
-
2026-06-09days on market $159,900 Active 111 DOM
-
2026-06-08days on market $159,900 Active 110 DOM
-
2026-06-07days on market $159,900 Active 109 DOM
-
2026-06-05days on market $159,900 Active 106 DOM
-
2026-06-02days on market $159,900 Active 104 DOM
-
2026-06-01statusdays on market $159,900 Active 103 DOM
-
2026-05-31days on market $159,900 Price Changed 102 DOM
-
2026-05-30days on market $159,900 Price Changed 101 DOM
-
2026-05-14price $169,900 169-char remark
Show marketing remark (169 chars)
Come finish the renovation of this expansive 7 bedroom home! This project is ready for your vision and creativity to bring it to fruition! Don't miss this opportunity!
-
2026-04-17price $179,900 169-char remark
Show marketing remark (169 chars)
Come finish the renovation of this expansive 7 bedroom home! This project is ready for your vision and creativity to bring it to fruition! Don't miss this opportunity!
-
2026-02-18$199,900 New 169-char remark
Show marketing remark (169 chars)
Come finish the renovation of this expansive 7 bedroom home! This project is ready for your vision and creativity to bring it to fruition! Don't miss this opportunity!
-
2024-01-09soldstatus $140,000 Closed 402-char remark
Show marketing remark (402 chars)
Oversized home close to downtown in a nice, South End location. 7 bedrooms and 4 baths! So much potential and priced under assessed value. Multi zoned location. Buyers should verify use with city. Potential commercial use. The source of all representations are from the seller or a public source; broker has not verified same. It is recommended that buyer independently verify all information.
-
2023-12-12status Pending 402-char remark
Show marketing remark (402 chars)
Oversized home close to downtown in a nice, South End location. 7 bedrooms and 4 baths! So much potential and priced under assessed value. Multi zoned location. Buyers should verify use with city. Potential commercial use. The source of all representations are from the seller or a public source; broker has not verified same. It is recommended that buyer independently verify all information.
-
2023-11-13price $154,000 402-char remark
Show marketing remark (402 chars)
Oversized home close to downtown in a nice, South End location. 7 bedrooms and 4 baths! So much potential and priced under assessed value. Multi zoned location. Buyers should verify use with city. Potential commercial use. The source of all representations are from the seller or a public source; broker has not verified same. It is recommended that buyer independently verify all information.
-
2023-10-12price $159,000 402-char remark
Show marketing remark (402 chars)
Oversized home close to downtown in a nice, South End location. 7 bedrooms and 4 baths! So much potential and priced under assessed value. Multi zoned location. Buyers should verify use with city. Potential commercial use. The source of all representations are from the seller or a public source; broker has not verified same. It is recommended that buyer independently verify all information.
-
2023-10-11price $159,900 402-char remark
Show marketing remark (402 chars)
Oversized home close to downtown in a nice, South End location. 7 bedrooms and 4 baths! So much potential and priced under assessed value. Multi zoned location. Buyers should verify use with city. Potential commercial use. The source of all representations are from the seller or a public source; broker has not verified same. It is recommended that buyer independently verify all information.
-
2023-09-11price $169,900 402-char remark
Show marketing remark (402 chars)
Oversized home close to downtown in a nice, South End location. 7 bedrooms and 4 baths! So much potential and priced under assessed value. Multi zoned location. Buyers should verify use with city. Potential commercial use. The source of all representations are from the seller or a public source; broker has not verified same. It is recommended that buyer independently verify all information.
-
2023-09-11$16,990 Active 402-char remark
Show marketing remark (402 chars)
Oversized home close to downtown in a nice, South End location. 7 bedrooms and 4 baths! So much potential and priced under assessed value. Multi zoned location. Buyers should verify use with city. Potential commercial use. The source of all representations are from the seller or a public source; broker has not verified same. It is recommended that buyer independently verify all information.
-
2018-09-12soldstatus $170,000
-
2018-04-05$180,000
-
2015-07-31historical
-
2015-04-18historical
-
2014-11-07historical
-
2014-11-07historical
-
2014-04-07$169,500
-
2014-04-07$169,500
-
2014-04-07$175,000
-
2014-04-07$175,000
-
2012-02-28historical
-
2011-02-28$209,900
-
2009-08-08historical
-
2008-11-08$249,000
-
2008-11-07historical
-
2007-12-27$259,000
-
2007-10-31historical
-
2006-09-15$299,900
-
2003-10-10soldstatus $160,000
-
2003-10-10soldstatus $160,000
-
2003-07-28$169,900
-
2003-07-16historical
-
2003-04-18$169,000
-
2001-12-20historical
-
2001-06-20$234,000
ⓘ Source: listings_history table (triggers on properties + properties_extension) + one-shot
backfill from property_details.listing_events for pre-trigger history.
Tax reassessment forecast MA · Partial reset (capped growth)
- Current annual tax
- $4,159 · $347/mo
- Projected year-2 tax
- $4,159 · $347/mo
- Expected delta
- $0/yr ($0/mo · 0.0%)
ⓘ Screening estimate from a state-policy table — verify with the county assessor before closing.
Climate risk First Street
- Flood 1/10 Low FEMA zone X · 0% chance over 30 yrs
- Wildfire 3/10 Moderate
- Heat 2/10 Low 7 d/yr ≥92°F today · 16 d/yr by 30 yrs out
- Wind 4/10 Moderate 9% chance of damaging wind over 30 yrs
- Air quality 2/10 Low 1 unhealthy d/yr today · 1 by 30 yrs out
Nearby sold comps map
Loading sold comps map…
Walkable amenities ~0.75 mi
Loading nearby amenities…
Taxation est. · year 1
- Rental income
- $30,386
- − Mortgage interest
- −$8,957
- − Property taxes
- −$4,159
- − Insurance
- −$800
- − Repairs & maintenance
- −$2,431
- − Management
- −$2,431
- − Depreciation
- −$4,652
- Taxable income
- $6,957
- Est. tax owed @ 24.0%
- −$1,670
- After-tax cash flow
- $7,314/yr
For passive investors: Depreciation is non-cash, so a rental often shows a tax loss while cash-flowing — sheltering income. Rental losses are passive: they offset passive income freely, and up to $25,000/yr can offset ordinary (W-2) income if you actively participate and your MAGI is under $100k (phasing out to $0 by $150k); unused losses carry forward. On sale, claimed depreciation is recaptured at up to 25%, and gains may owe capital-gains tax (a 1031 exchange can defer both). Figures are a year-1 estimate at your 24.0% rate — not tax advice; consult a CPA.
Schools (NCES district)
- District
- Pittsfield
- NCES district ID
- 2509630
- Math proficiency
- 19% ▼ -10.00%
- Reading proficiency
- 34% ▼ -2.00%
- Median HH income
- $44,032
- Composite
- 22.67/100
- National rank
- #8046
- State rank
- #272 of 302 in MA
Livability — Pittsfield
- Score
- 75/100
- State rank
- #70
- US rank
- #3820
Category grades
Schools grade is shown separately in the Schools card above.
Census & demographics
- Census place
- Pittsfield, MA
- County
- Berkshire County · 44,848 people
- City population
- 44,848
- Metro
- Pittsfield, MA
- Population (ZIP)
- 44,848
- Household income
- $71,093
- Rent vs Own
- Severe rent burden
- 1580.0
Population outlook (Berkshire County) Hauer SSP2
- Today (2025)
- 119,723 people
- By 2030
- 114,608 · -4.3%
- By 2040
- 102,806 · -14.1%
- By 2050
- 91,305 · -23.7%
- By 2075
- 71,517 · -40.3%
- By 2100
- 57,988 · -51.6%
Race, ethnicity, and origin ACS 2023
- Neighborhood character
- Predominantly White (78%)
- Race & ethnicity
- White 78% Two or more races 10% Hispanic / Latino 9% Black 5% Asian 1%
- Hispanic origin (detail)
- Puerto Rican 3%
- Common ancestry
- Lithuanian 8% Romanian 6% Slovak 2%
- Foreign-born
- 7% · Canada, Jamaica
- Languages at home
- 90% English-only · Spanish 6% Other Indo-European 1% Russian/Polish/Slavic 1%
Political lean MEDSL · Berkshire
- 2024 margin
- Solid D (+39.9) · D 68.9% · R 29.0% · Other 2.1%
- 2008→2024 swing
- -12.5pp toward R · 2008: 52.4pp · 2024: 39.9pp
- All cycles
- 2024: D+39.9 2020: D+47.1 2016: D+41.5 2012: D+53.7 2008: D+52.4
Not yet ingested
- Civics
- —
Market trends
- HPI YoY
- ▼ -199.88%
- Current HPI
- 283.3421
- Rent YoY
- ▲ 7.72%
- Metro
- Pittsfield, MA
- State GDP YoY
- ▲ 2.28%
- F500 in state
- 38
Industry mix (Fortune 500 HQ in MA)
| Industry | F500 HQs | Revenue |
|---|---|---|
| Technology | 3 | $17B |
|
||
| Insurance | 2 | $84B |
|
||
| Retail | 2 | $76B |
|
||
| Life Sciences | 1 | $43B |
|
||
| Energy Technology | 1 | $31B |
|
||
| Aerospace / Defense | 1 | $18B |
|
||
Price history
-68.8% since first listed39 events — show timeline
- 2026-05-14 Price Changed $169,900 MLS PIN
- 2026-04-17 Price Changed $179,900 MLS PIN
- 2026-02-18 Listed $199,900 MLS PIN
- 2024-01-09 Sold (MLS) $140,000 BCMLS
- 2023-12-12 Pending — BCMLS
- 2023-11-13 Price Changed $154,000 BCMLS
- 2023-10-12 Price Changed $159,000 BCMLS
- 2023-10-11 Price Changed $159,900 BCMLS
- 2023-09-11 Price Changed $169,900 BCMLS
- 2023-09-11 Listed $16,990 BCMLS
- 2018-09-12 Sold (MLS) $170,000 BCMLS
- 2018-04-05 Listed $180,000 BCMLS
- 2015-07-31 Listing Removed — BCMLS
- 2015-04-18 Listing Removed — BCMLS
- 2014-11-07 Listing Removed — BCMLS
- 2014-11-07 Listing Removed — BCMLS
- 2014-04-07 Listed $175,000 BCMLS
- 2014-04-07 Listed $175,000 BCMLS
- 2014-04-07 Listed $169,500 BCMLS
- 2014-04-07 Listed $169,500 BCMLS
- 2012-02-28 Listing Removed — BCMLS
- 2011-02-28 Listed $209,900 BCMLS
- 2009-08-08 Listing Removed — BCMLS
- 2008-11-08 Listed $249,000 BCMLS
- 2008-11-07 Listing Removed — BCMLS
- 2007-12-27 Listed $259,000 BCMLS
- 2007-10-31 Listing Removed — BCMLS
- 2006-09-15 Listed $299,900 BCMLS
- 2003-10-10 Sold (Public Records) $160,000 Public Records
- 2003-10-10 Sold (MLS) $160,000 BCMLS
- 2003-07-28 Listed $169,900 BCMLS
- 2003-07-16 Listing Removed — BCMLS
- 2003-04-18 Listed $169,000 BCMLS
- 2001-12-20 Listing Removed — BCMLS
- 2001-06-20 Listed $234,000 BCMLS
- 1997-06-12 Sold (Public Records) $77,500 Public Records
- 1997-06-11 Sold (MLS) $77,500 BCMLS
- 1997-05-09 Listed $82,900 BCMLS
- 1980-07-01 Sold (Public Records) $544,500 Public Records
Property tax history
+4.0%/yrLatest (2023): $4,159 · +10.5% YoY. Source: county tax records.
Cash-flow waterfall
monthlySold comps — $/sqft
last 12 mo · ≤1 miLoading sold comps…