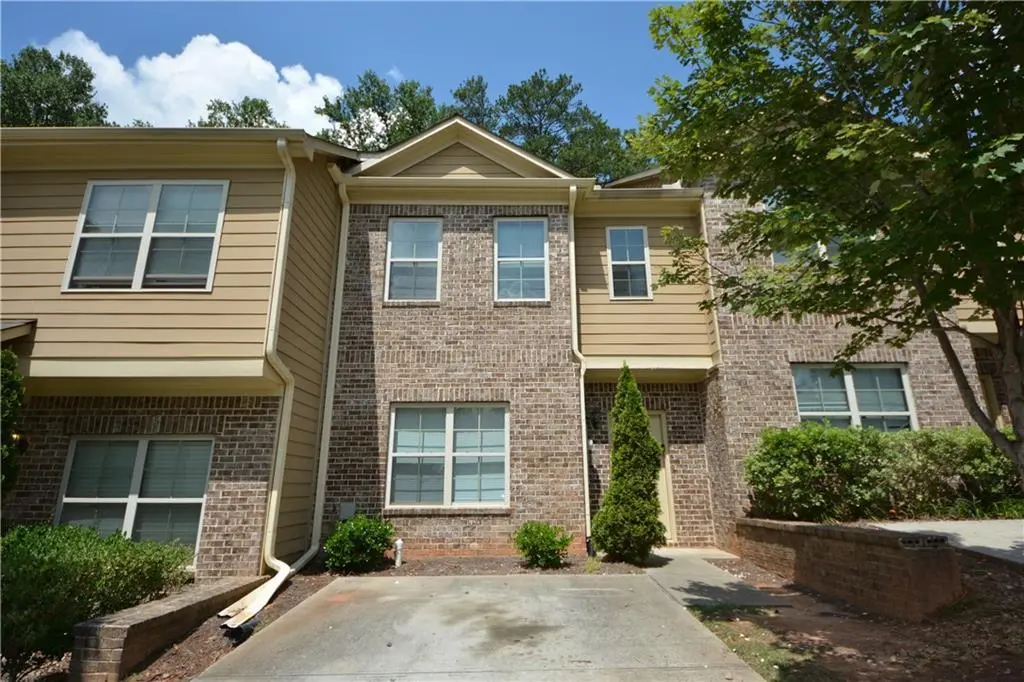
3015 Bonnes Dr · Stonecrest, GA
Flood risk 1/10 · Minimal
- FEMA flood zone
- X (unshaded)
- Chance of flooding over 30 yrs
- 0.0%
- Est. flood insurance / yr
- $507 – $1,088
Fire risk 3/10 · Minor
- Est. fire insurance / yr
- $963 – $1,789
Heat risk 6/10 · Moderate
- Hot days now (above 106°F)
- 7 days/yr
- Hot days in 30 yrs
- 18 days/yr
Wind risk 5/10 · Moderate
- Chance of severe wind over 30 yrs
- 23.0%
Air-quality risk 5/10 · Moderate
- Unhealthy air days now
- 7 days/yr
- Unhealthy air days in 30 yrs
- 10 days/yr
Risk factors via First Street. Map © Google.
Why this score? — see what drove the D- grade
The composite is a weighted blend of 9 inputs, each scored 0–100. Each bar is that input's sub-score; the figure is the points it added to the 100-point composite (weight × sub-score).
- ARV discount +12.1/15.0
- Cash flow +9.7/30.0
- 1% rule +4.0/10.0
- Rent growth +3.7/5.0
- DSCR +2.7/10.0
- Livability +2.5/5.0
- Condition / age +2.5/5.0
- Schools +2.1/10.0
- Appreciation +0.0/10.0
$199,900
🖨 Deal sheet 📄 Offer letter ✓ Due diligence
Listing remarks MLS
Freshly updated with brand-new interior paint and carpet, this charming home is ready for immediate move-in. Biggest floor plan in Fairington Enclave! Nestled in a peaceful cul-de-sac, it features a bright, welcoming living room perfect for entertaining. A separate dining area is on the main floor. A dedicated dining area is perfectly positioned between the living room and the kitchen. The pass-through window to the kitchen allows for easy conversation while preparing meals. The adorable kitchen features matching appliances and ample cabinet space to meet all your culinary needs. The spacious primary bedroom features a private en-suite bath, while two additional bedrooms offer flexibility for guests, a home office, or a growing household. Step outside to enjoy a beautiful patio and a large, level backyard-ideal for outdoor gatherings and play. Conveniently located near shopping, dining, parks, and top-rated schools, this home has everything you're looking for! No rental restrictions in this community.
Key facts
- New carpet
- Pass-through window
- Matching appliances
Tags
Neighborhood map
What this means for you Summary
Snapshot
- This is a 3-bed/2.5-bath townhouse listed at $200k.
Deal economics
- At list price, monthly cash flow is $-132 ($-2k/yr) — negative.
- To cash-flow at today's rent, offer at most $177k (11.7% below list).
- To meet the 1% rule (rent ≥ 1% of price), the offer needs to be $179k (10.5% below list).
- Recommended offer: $176k (12.0% below list) — sets the bar for market timing.
Location & tenants
- Location reads: area grade D — affects rentability + tenant quality, not the cash-flow math above.
- Dekalb County (suburban): math 19% / reading 28% proficiency, ranked #125 of 174 in GA (top 72%) — low school quality limits family demand, transient renter base, plan for 1-2y turnover; 68% free/reduced lunch — lower-income household profile, screen leases tightly.
- Market conditions: Rents rising fast (+4.6%/yr); 320 active listings in the ZIP; 40 comparable units currently listed for rent nearby; rentals at typical pace (median 25d on market — plan ~3-4 weeks tenant-placement turnaround); 1,240 units permitted in DeKalb County in 2024 (385 in 5+ unit buildings).
Forward outlook
- Local home prices are declining (-3.0%/yr); year-one equity from $1k of loan paydown is wiped out by about $6k of value loss. Plan a longer hold.
- DeKalb County population projected at +28% by 2050 — long-run rental-demand tailwind backs the buy-and-hold thesis.
Negotiation context
- It's been on market 153 days — a 12% lower offer ($176k) is reasonable based on typical stale-listing flexibility.
- 4 sale attempts since 2y ago with the ask held roughly flat each time — persistent listings suggest the price (not the market) is what's stuck; bring a comps-based counter.
Risks & watch-outs
- Climate carrying-cost: moderate wind risk, 23% chance of damaging wind over 30y; extreme-heat days projected 7→18/yr by 2055 (HVAC capex compounding) — expect insurance premiums to compound above CPI over the hold.
Questions for the listing agent
- What do current leases actually rent for vs. the listed asking? Can we see a recent rent roll and the last 12 months of T-12 income?
- It's been on market 153 days. Have you received any prior offers? Is the seller open to a 12% concession, seller financing, or rate buy-down credit?
- What does the HOA fee cover, when was the last increase, and are there any pending special assessments or reserve-fund shortfalls?
- Why hasn't it sold? Are there any deal-killer items the seller is aware of (foundation, flood, title, zoning, code violations)?
- Is there a deadline driving the sale (1031 exchange, divorce, estate, relocation)? That informs how much negotiation room exists.
- The area grade is low — what's the realistic commute time and amenity access for the typical tenant pool here? Any planned neighborhood developments (good or bad) we should know about?
- What's the average days-on-market for RENTAL listings here right now (not sales)? A rising rental-DOM trend means longer vacancies and softer asking-rent achievability than the comps imply.
- What's the recent tenant-quality profile in this submarket — average credit score on applications, eviction rate, late-payment / NSF rate, and stable-employment percentage? A property-management company in the area should have these aggregated.
- How much new for-sale + rental construction is in the pipeline within 1–3 miles? Heavy new supply typically softens prices + rents 12–24 months out; constrained supply supports both.
Investment metrics
- 1% rule
- 0.90% ✗
- Cap rate
- 5.50%
- Cash-on-cash
- -2.83%
- DSCR
- 0.87
- GRM
- 9.3
CMA / ARV
- ARV (median comp)
- $222,456
- List price
- $199,900
- Delta
- -10.14%
- Verdict
- UNDERPRICED
- Comps
- 20 within 1.0 mi
Show comp detail 12 sales within ~0.75 mi
| Address | Dist | Beds/Ba | Sqft | Sold | Price | $/sf | Match |
|---|---|---|---|---|---|---|---|
| 3287 Pennington Dr | 0.06mi | 3/2.5 | 1,432 (-11%) | 3mo | $216,000 | $151 | 77 |
| 5843 Taka Ln | 0.14mi | 3/2.5 | 1,432 (-11%) | 2mo | $199,900 | $140 | 74 |
| 5866 Taka Ln | 0.14mi | 3/2.5 | 1,432 (-11%) | 3mo | $218,000 | $152 | 73 |
| 5873 Taka Ln | 0.18mi | 3/2.5 | 1,432 (-11%) | 2mo | $212,000 | $148 | 72 |
| 2641 Parrish Ct | 0.62mi | 3/2.5 | 1,588 (-1%) | 1mo | $222,000 | $140 | 69 |
| 2513 Piering Dr #50 | 0.67mi | 3/2.5 | 1,588 (-1%) | 1mo | $223,000 | $140 | 66 |
| 5796 Par Four Ct | 0.47mi | 3/2.0 | 1,470 (-8%) | 1mo | $98,000 | $67 | 61 |
| 2626 Parrish Ct | 0.58mi | 3/2.5 | 1,468 (-8%) | 0mo | $200,000 | $136 | 59 |
| 2642 Parrish Ct | 0.60mi | 3/2.5 | 1,468 (-8%) | 1mo | $210,000 | $143 | 57 |
| 2878 Norfair Loop | 0.62mi | 3/2.5 | 1,456 (-9%) | 3mo | $195,070 | $134 | 53 |
| 2505 Piering Dr | 0.66mi | 2/2.5 (-1) | 1,468 (-8%) | 2mo | $195,000 | $133 | 49 |
| 5551 Fair Creek Way | 0.55mi | 2/2.5 (-1) | 1,376 (-14%) | 2mo | $137,000 | $100 | 44 |
Match score weights: distance 35% · size 25% · config 20% · recency 20%. Top-matched comps best support the ARV.
Projected returns pro-forma
-3.0% appreciation · 4.6% rent growth · sell at horizon
- IRR
- -18.9%
- Equity multiple
- 0.33×
- Total profit
- $-37,745
- Equity at exit
- $29,806
- IRR
- -8.1%
- Equity multiple
- 0.45×
- Total profit
- $-30,764
- Equity at exit
- $17,284
Cash invested: $55,972 (down + closing). Projections, not guarantees.
Landlord ↔ Tenant lean methodology
- Overall (STATE)
- 90 Strongly Landlord-Friendly
- State Georgia
- 90 Strongly Landlord-Friendly · R+3
- County
- — inherits STATE
- City
- — inherits STATE
ZIP-level market 30038
- Home prices YoY
- -28.0%
- Rents YoY
- 4.6%
- Active inventory
- 320
- Price-to-rent
- 9.3×
Monthly cashflow live
- Estimated rent
- $1,790 high interval (Pro) →
- Mortgage (P&I)
- −$1,048
- Tax from tax record
- −$374 /mo · $4,490/yr
- Insurance
- −$83
- HOA
- −$40
- Vacancy / Maint / Mgmt
- −$376
- Net cashflow
- $-132
Break-even live
UW: 25.0% down · 7.5% · 30yr · 1.5% tax · 5.0% vac · 8.0% maint · 8.0% mgmt
Financing live
Cash to close
- Down payment
- $49,975
- Closing costs
- $5,997
- Reserves months
- —
- Total cash needed
- —
Loan-product check · same deal, 3 products live
Conventional
25% down · 7.5% · 30yr
- Down + closing
- —
- Monthly P&I
- —
- Monthly cashflow
- —
- DSCR
- —
- Eligible?
- —
Personal DTI + credit; lowest rate.
DSCR
20% down · 8.5% · 30yr
- Down + closing
- —
- Monthly P&I
- —
- Monthly cashflow
- —
- DSCR
- —
- Eligible?
- —
No personal income docs; deal must DSCR.
Hard money
10% down · 12.0% · 12mo
- Down + closing
- —
- Monthly P&I
- —
- Monthly cashflow
- —
- DSCR
- —
- Eligible?
- —
Short-term bridge; refi at stabilization.
Rent comps 40 comps
| Address | Beds | Baths | Sqft | Rent | $/sqft | DOM | Units | Dist |
|---|---|---|---|---|---|---|---|---|
| 3008 Bonnes Dr Lithonia, GA | 3.0 | 2.5 | 1608 | $1,800 | $1.12 | 44d | 1 | 0.02mi |
| 3039 Bonnes Dr Lithonia, GA | 3.0 | 3.0 | 1608 | $1,995 | $1.24 | 13d | 1 | 0.08mi |
| 3039 Bonnes Dr Lithonia, GA | 3.0 | 3.0 | 1608 | $1,995 | $1.24 | 44d | 1 | 0.08mi |
| 3100 Bonnes Dr Lithonia, GA | 3.0 | 2.5 | 1608 | $1,800 | $1.12 | 44d | 1 | 0.18mi |
| 3199 Pearce Ct Lithonia, GA | 4.0 | 2.5 | 1700 | $2,035 | $1.20 | 24d | 1 | 0.34mi |
| 3060 Aberdeen Way Lithonia, GA | 3.0 | 2.0 | 1592 | $1,850 | $1.16 | 24d | 1 | 0.39mi |
| 5654 Bradley Cir Lithonia, GA | 2.0 | 1.0 | 1428 | $1,673 | $1.17 | 5d | 1 | 0.45mi |
| 4103 Fairington Club Dr Lithonia, GA | 3.0 | 2.0 | 1292 | $1,300 | $1.01 | 44d | 1 | 0.47mi |
| 2204 Fairington Club Dr Unit 2204 Stonecrest, GA | 3.0 | 2.0 | 2000 | $1,600 | $0.80 | 5d | 1 | 0.47mi |
| 4101 Fairington Club Dr Lithonia, GA | 3.0 | 2.0 | 1292 | $1,300 | $1.01 | 44d | 1 | 0.48mi |
| 2437 Piering Dr Lithonia, GA | 3.0 | 2.5 | 1560 | $1,600 | $1.03 | 44d | 1 | 0.51mi |
| 5588 Fairington Pl Lithonia, GA | 2.0 | 1.0 | 1260 | $1,295 | $1.03 | 44d | 1 | 0.53mi |
| 2102 Fairington Ridge Cir Lithonia, GA | 3.0 | 2.0 | 1292 | $1,545 | $1.20 | 10d | 1 | 0.55mi |
| 2898 Norfair Loop Lithonia, GA | 2.0 | 1.5 | 1240 | $1,506 | $1.21 | 5d | 1 | 0.55mi |
| 2204 Fairington Village Dr Lithonia, GA | 3.0 | 2.0 | 1292 | $1,295 | $1.00 | 21d | 1 | 0.56mi |
| 2204 Fairington Village Dr Lithonia, GA | 3.0 | 2.0 | 1292 | $1,295 | $1.00 | 24d | 1 | 0.56mi |
| 2649 Parrish Ct Lithonia, GA | 3.0 | 2.5 | 1588 | $1,800 | $1.13 | 44d | 1 | 0.60mi |
| 5812 Trent Walk Dr Unit 1 Stonecrest, GA | 3.0 | 2.0 | 1350 | $1,600 | $1.19 | 44d | 1 | 0.60mi |
| 13101 Fairington Ridge Cir Unit 101 Stonecrest, GA | 3.0 | 2.0 | 1292 | $1,400 | $1.08 | 24d | 1 | 0.61mi |
| 13202 Fairington Ridge Cir Lithonia, GA | 3.0 | 2.0 | 1292 | $1,650 | $1.28 | 17d | 1 | 0.62mi |
| 5201 Fairington Ridge Cir Lithonia, GA | 3.0 | 2.0 | 1226 | $1,645 | $1.34 | 44d | 1 | 0.62mi |
| 5104 Fairington Ridge Cir Unit 5104 Stonecrest, GA | 3.0 | 2.0 | 1292 | $1,400 | $1.08 | 24d | 1 | 0.62mi |
| 2747 Norfair Loop Lithonia, GA | 2.0 | 3.0 | 2080 | $1,900 | $0.91 | 3d | 1 | 0.63mi |
| 5796 Trent Walk Dr Lithonia, GA | 3.0 | 2.0 | 1350 | $1,570 | $1.16 | 5d | 1 | 0.64mi |
| 2102 Par Three Way Lithonia, GA | 3.0 | 2.0 | 1202 | $1,500 | $1.25 | 5d | 1 | 0.64mi |
| 6301 Fairington Village Dr Stonecrest, GA | 3.0 | 2.0 | 1300 | $1,900 | $1.46 | 5d | 1 | 0.65mi |
| 14302 Fairington Ridge Cir Lithonia, GA | 3.0 | 2.0 | 1292 | $1,650 | $1.28 | 44d | 1 | 0.65mi |
| 1202 Par Three Way Lithonia, GA | 2.0 | 2.0 | 1202 | $1,200 | $1.00 | 19d | 1 | 0.66mi |
| 14204 Fairington Ridge Cir Lithonia, GA | 3.0 | 2.0 | 1292 | $1,550 | $1.20 | 44d | 1 | 0.66mi |
| 5926 Trent Jones Way Lithonia, GA | 2.0 | 2.5 | 1122 | $1,200 | $1.07 | 17d | 1 | 0.67mi |
| 7104 Fairington Ridge Cir Lithonia, GA | 3.0 | 2.0 | 1292 | $1,300 | $1.01 | 3d | 1 | 0.68mi |
| 8202 Fairington Ridge Cir Lithonia, GA | 3.0 | 2.0 | 1300 | $1,900 | $1.46 | 44d | 1 | 0.70mi |
| 5876 Trent Walk Dr Lithonia, GA | 2.0 | 1.5 | 1084 | $1,550 | $1.43 | 5d | 1 | 0.71mi |
| 421 Meadowood Dr Stonecrest, GA | 2.0–3.0 | 1.5–2.0 | 1328 | $1,499 | $1.13 | 24d | 18 | 0.76mi |
| 3024 Parc Lorraine Lithonia, GA | 3.0 | 2.0 | 1628 | $1,550 | $0.95 | 3d | 1 | 0.78mi |
| 3064 Parc Lorraine Unit 1 Stonecrest, GA | 2.0 | 2.0 | 1280 | $1,195 | $0.93 | 4d | 1 | 0.80mi |
| 5302 Timor Trl Lithonia, GA | 3.0 | 2.0 | 1330 | $1,900 | $1.43 | 44d | 1 | 0.81mi |
| 100 Walden Brook Dr Stonecrest, GA | 1.0–3.0 | 1.0–2.0 | 1132 | $1,607 | $1.42 | 2d | 15 | 0.85mi |
| 2928 Parc Lorraine Lithonia, GA | 3.0 | 2.0 | 1788 | $1,425 | $0.80 | 22d | 1 | 0.85mi |
| 2932 Parc Lorraine Lithonia, GA | 2.0 | 2.0 | 1280 | $1,399 | $1.09 | 24d | 1 | 0.85mi |
HOA detail
- Monthly dues
- $40 · $480/yr
Listing history 23 events
-
2026-06-18days on market $199,900 Active 153 DOM
-
2026-06-17days on market $199,900 Active 152 DOM
-
2026-06-16days on market $199,900 Active 151 DOM
-
2026-06-15days on market $199,900 Active 150 DOM
-
2026-06-13days on market $199,900 Active 148 DOM
-
2026-06-10price $199,900 Active 144 DOM
-
2026-06-09days on market $205,000 Active 144 DOM
-
2026-06-08days on market $205,000 Active 143 DOM
-
2026-06-07days on market $205,000 Active 142 DOM
-
2026-06-04days on market $205,000 Active 139 DOM
-
2026-06-03days on market $205,000 Active 138 DOM
-
2026-06-02days on market $205,000 Active 137 DOM
-
2026-06-01days on market $205,000 Active 136 DOM
-
2026-05-31days on market $205,000 Active 135 DOM
-
2026-01-16$205,000 New 1016-char remark
Show marketing remark (1028 chars)
Freshly updated with brand-new interior paint and carpet, this charming home is ready for immediate move-in. Biggest floor plan in Fairington Enclave! Nestled in a peaceful cul-de-sac, it features a bright, welcoming living room perfect for entertaining. A separate dining area is on the main floor. A dedicated dining area is perfectly positioned between the living room and the kitchen. The pass-through window to the kitchen allows for easy conversation while preparing meals. The adorable kitchen features matching appliances and ample cabinet space to meet all your culinary needs. The spacious primary bedroom features a private en-suite bath, while two additional bedrooms offer flexibility for guests, a home office, or a growing household. Step outside to enjoy a beautiful patio and a large, level backyard—ideal for outdoor gatherings and play. Conveniently located near shopping, dining, parks, and top-rated schools, this home has everything you’re looking for! No rental restrictions in this community.
-
2026-01-16$205,000 Active 1028-char remark
Show marketing remark (1028 chars)
Freshly updated with brand-new interior paint and carpet, this charming home is ready for immediate move-in. Biggest floor plan in Fairington Enclave! Nestled in a peaceful cul-de-sac, it features a bright, welcoming living room perfect for entertaining. A separate dining area is on the main floor. A dedicated dining area is perfectly positioned between the living room and the kitchen. The pass-through window to the kitchen allows for easy conversation while preparing meals. The adorable kitchen features matching appliances and ample cabinet space to meet all your culinary needs. The spacious primary bedroom features a private en-suite bath, while two additional bedrooms offer flexibility for guests, a home office, or a growing household. Step outside to enjoy a beautiful patio and a large, level backyard—ideal for outdoor gatherings and play. Conveniently located near shopping, dining, parks, and top-rated schools, this home has everything you’re looking for! No rental restrictions in this community.
-
2026-01-08historical
-
2025-11-04price $199,000
-
2025-10-14price $209,000
-
2025-07-09$235,000 New
-
2025-04-30historical $1,750
-
2024-12-19price $1,750
-
2024-08-28$1,850
ⓘ Source: listings_history table (triggers on properties + properties_extension) + one-shot
backfill from property_details.listing_events for pre-trigger history.
Tax reassessment forecast GA · Resets to sale price
- Current annual tax
- $4,490 · $374/mo
- Projected year-2 tax
- $4,490 · $374/mo
- Expected delta
- $0/yr ($0/mo · 0.0%)
ⓘ Screening estimate from a state-policy table — verify with the county assessor before closing.
Climate risk First Street
- Flood 1/10 Low FEMA zone X (unshaded) · 0% chance over 30 yrs
- Wildfire 3/10 Moderate
- Heat 6/10 Major 7 d/yr ≥106°F today · 18 d/yr by 30 yrs out
- Wind 5/10 Major 23% chance of damaging wind over 30 yrs
- Air quality 5/10 Major 7 unhealthy d/yr today · 10 by 30 yrs out
Nearby sold comps map
Loading sold comps map…
Walkable amenities ~0.75 mi
Loading nearby amenities…
Taxation est. · year 1
- Rental income
- $21,475
- − Mortgage interest
- −$11,198
- − Property taxes
- −$4,490
- − Insurance
- −$1,000
- − Repairs & maintenance
- −$1,718
- − Management
- −$1,718
- − HOA
- −$480
- − Depreciation
- −$5,815
- Taxable loss
- −$4,943
- Est. tax savings @ 24.0%
- +$1,186
- After-tax cash flow
- $-398/yr
For passive investors: Depreciation is non-cash, so a rental often shows a tax loss while cash-flowing — sheltering income. Rental losses are passive: they offset passive income freely, and up to $25,000/yr can offset ordinary (W-2) income if you actively participate and your MAGI is under $100k (phasing out to $0 by $150k); unused losses carry forward. On sale, claimed depreciation is recaptured at up to 25%, and gains may owe capital-gains tax (a 1031 exchange can defer both). Figures are a year-1 estimate at your 24.0% rate — not tax advice; consult a CPA.
Schools (NCES district)
- District
- Dekalb County
- NCES district ID
- 1301740
- Math proficiency
- 19% ▼ -12.00%
- Reading proficiency
- 28% ▼ -7.00%
- Median HH income
- $51,448
- Composite
- 20.92/100
- National rank
- #8482
- State rank
- #125 of 174 in GA
Livability — Stonecrest
No livability data for this city. (Only ~50 U.S. cities are tracked.)
Census & demographics
- Census place
- Stonecrest, GA
- County
- Dekalb County · 782,738 people
- City population
- 106,165
- Metro
- Atlanta-Sandy Springs-Alpharetta, GA
- Population (ZIP)
- 43,776
- Household income
- $73,694
- Rent vs Own
- Severe rent burden
- 1168.0
Population outlook (DeKalb County) Hauer SSP2
- Today (2025)
- 839,977 people
- By 2030
- 891,768 · +6.2%
- By 2040
- 988,894 · +17.7%
- By 2050
- 1,074,583 · +27.9%
- By 2075
- 1,245,026 · +48.2%
- By 2100
- 1,303,135 · +55.1%
Race, ethnicity, and origin ACS 2023
- Neighborhood character
- Predominantly Black (84%)
- Race & ethnicity
- Black 84% Two or more races 10% Hispanic / Latino 5% White 4% Asian 1%
- Foreign-born
- 12% · Canada, China
- Languages at home
- 90% English-only · Spanish 5% French/Haitian/Cajun 1% Other Indo-European 0%
Political lean MEDSL · DeKalb
- 2024 margin
- Solid D (+64.8) · D 81.9% · R 17.1% · Other 1.0%
- 2008→2024 swing
- +6.1pp toward D · 2008: 58.6pp · 2024: 64.8pp
- All cycles
- 2024: D+64.8 2020: D+67.4 2016: D+64.8 2012: D+56.8 2008: D+58.6
Not yet ingested
- Civics
- —
Market trends
- HPI YoY
- ▼ -74.98%
- Current HPI
- 192.8328
- Rent YoY
- ▲ 4.60%
- Metro
- Atlanta-Sandy Springs-Alpharetta, GA
- State GDP YoY
- ▲ 2.66%
- F500 in state
- 28
Industry mix (Fortune 500 HQ in GA)
| Industry | F500 HQs | Revenue |
|---|---|---|
| Paper / Packaging | 2 | $29B |
|
||
| Retail | 1 | $160B |
|
||
| Transportation / Logistics | 1 | $91B |
|
||
| Airlines | 1 | $62B |
|
||
| Consumer Goods | 1 | $47B |
|
||
| Utilities | 1 | $25B |
|
||
Price history
+10981.1% since first listed9 events — show timeline
- 2026-01-16 Listed $205,000 FMLS
- 2026-01-16 Listed $205,000 GAMLS
- 2026-01-08 Listing Removed — GAMLS
- 2025-11-04 Price Changed $199,000 GAMLS
- 2025-10-14 Price Changed $209,000 GAMLS
- 2025-07-09 Listed $235,000 GAMLS
- 2025-04-30 Rental Removed $1,750 APPFOLIO
- 2024-12-19 Price Changed $1,750 APPFOLIO
- 2024-08-28 Listed for Rent $1,850 APPFOLIO
Property tax history
+16.4%/yrLatest (2025): $4,490 · -1.9% YoY. Source: county tax records.
Cash-flow waterfall
monthlySold comps — $/sqft
last 12 mo · ≤1 miLoading sold comps…