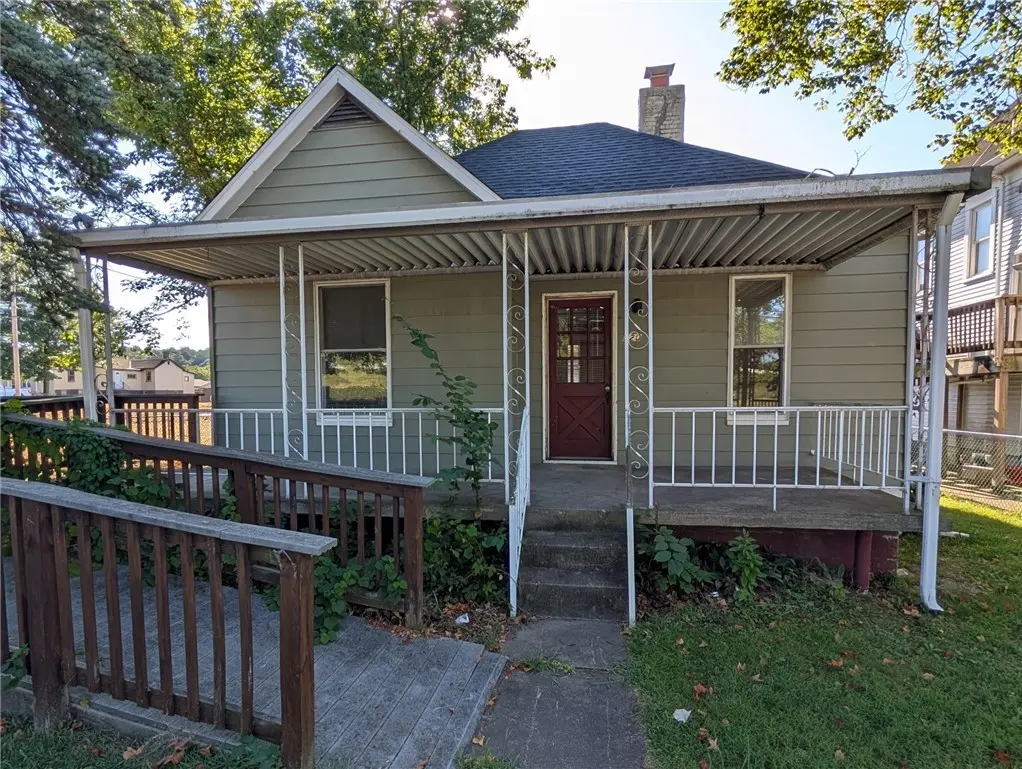
520 W Pike St · Meadowlands, PA
Flood risk No data
- FEMA flood zone
- —
- Chance of flooding over 30 yrs
- —
- Est. flood insurance / yr
- —
Fire risk No data
- Est. fire insurance / yr
- —
Heat risk No data
- Hot days now (above threshold)
- —
- Hot days in 30 yrs
- —
Wind risk No data
- Chance of severe wind over 30 yrs
- —
Air-quality risk No data
- Unhealthy air days now
- —
- Unhealthy air days in 30 yrs
- —
Risk factors via First Street. Map © Google.
Why this score? — see what drove the D grade
The composite is a weighted blend of 9 inputs, each scored 0–100. Each bar is that input's sub-score; the figure is the points it added to the 100-point composite (weight × sub-score).
- ARV discount +15.0/15.0
- Cash flow +7.1/30.0
- Appreciation +6.1/10.0
- Schools +4.7/10.0
- Livability +3.2/5.0
- Rent growth +2.5/5.0
- Condition / age +2.5/5.0
- 1% rule +1.9/10.0
- DSCR +1.3/10.0
$160,000
🖨 Deal sheet (PDF) 📄 Offer letter ✓ Due diligence
Listing remarks MLS
Nice rental potential. Plenty of parking in the rear.
Key facts
- Hot water tank
- Lots of parking
- Recently renovated
Tags
Property features AI
Exterior
- Parking: Off-street parking for 3 vehicles
- Utilities: Public water; Public sewer; Electric service available
- Home design: Single-story home; Resale property; Asphalt roof; Vinyl siding
- Construction: Vinyl siding construction; Asphalt roof
- Exterior features: 50 x 150 lot
Interior
- Kitchen: Main-level kitchen
- Bedrooms: Three bedrooms on the main level
- Flooring: Carpet; Vinyl
- Bathrooms: One full bathroom
- Heating & cooling: Gas heating; Hot water heating; Central air conditioning
- Interior features: Carpet and vinyl flooring; Unfinished basement
Neighborhood map
What this means for you Summary
Snapshot
- This is a 3-bed/1.0-bath single-family listed at $160k.
Deal economics
- At list price, monthly cash flow is $-229 ($-3k/yr) — negative.
- To cash-flow at today's rent, offer at most $127k (20.7% below list).
- To meet the 1% rule (rent ≥ 1% of price), the offer needs to be $111k (30.7% below list).
- Recommended offer: $111k (30.7% below list) — sets the bar for 1% rule.
- Cap rate 4.6% vs local median 2.9% in Meadowlands — top-decile yield for the area; either an underpriced asset or a hidden risk that comps aren't pricing in. Stress-test before assuming the spread holds.
Location & tenants
- Location reads 63/100 on livability (#1,243 in PA) — a middle-class / working-renter tenant base. Strengths: cost of living A+, housing A+, crime A; Watch: amenities F, employment F, health & safety F.
- Chartiers-Houston SD (suburban): math 40% / reading 68% proficiency, ranked #125 of 539 in PA (top 23%) — acceptable for families but not a draw, mixed tenant base, ~2y average lease.
- Zoned schools: Allison Park El Sch (math 43% / reading 72%, grade C+, #439 of 1,518 statewide, top 29%, 667 students, 25% FRL); Chartiers-Houston Jshs (math 37% / reading 62%, grade D, #138 of 437 statewide, top 34%, 508 students, 27% FRL) — zoned schools at 26% FRL track the district average.
- Market conditions: 6 active listings in the ZIP; 489 units permitted in Washington County in 2024 (30 in 5+ unit buildings).
Forward outlook
- In year one you build about $5k of equity ($1k loan paydown + $4k appreciation (2.3% local appreciation)).
- Washington County population projected to shrink 6% by 2050 — rents likely to lag national; underwrite the cash flow, not the appreciation.
- By year 7, paydown + projected appreciation supports a ~$30k cash-out refi (75% LTV) — recoverable capital for the next deal without selling this one.
Negotiation context
- It's been on market 59 days — a 3% lower offer ($155k) is reasonable based on typical stale-listing flexibility.
- 2 sale attempts since 5y ago with the ask held roughly flat each time — persistent listings suggest the price (not the market) is what's stuck; bring a comps-based counter.
- Current owner paid $100k; list at $160k implies a 60% gain — meaningful room to come down on a strong offer.
Risks & watch-outs
- Watch-outs: built in 1900 — expect roof / HVAC / electrical / plumbing capex.
Questions for the listing agent
- What do current leases actually rent for vs. the listed asking? Can we see a recent rent roll and the last 12 months of T-12 income?
- It's been on market 59 days. Have you received any prior offers? Is the seller open to a 31% concession, seller financing, or rate buy-down credit?
- Built in 1900 — when were the roof, HVAC, electrical panel, plumbing, and water heater last replaced?
- Is there a deadline driving the sale (1031 exchange, divorce, estate, relocation)? That informs how much negotiation room exists.
- Schools are D-rated, which usually means shorter tenancies and higher turnover. Who's the typical renter profile here, and what's been the actual vacancy rate?
- The area grade is low — what's the realistic commute time and amenity access for the typical tenant pool here? Any planned neighborhood developments (good or bad) we should know about?
- What's the average days-on-market for RENTAL listings here right now (not sales)? A rising rental-DOM trend means longer vacancies and softer asking-rent achievability than the comps imply.
- What's the recent tenant-quality profile in this submarket — average credit score on applications, eviction rate, late-payment / NSF rate, and stable-employment percentage? A property-management company in the area should have these aggregated.
- How much new for-sale + rental construction is in the pipeline within 1–3 miles? Heavy new supply typically softens prices + rents 12–24 months out; constrained supply supports both.
Investment metrics
- 1% rule
- 0.69% ✗
- Cap rate
- 4.57%
- Cash-on-cash
- -6.14%
- DSCR
- 0.73
- GRM
- 12.0
CMA / ARV
- ARV (median comp)
- $217,589
- List price
- $160,000
- Delta
- -26.47%
- Verdict
- UNDERPRICED
- Comps
- 19 within 1.0 mi
Show comp detail 1 sale within ~0.75 mi
| Address | Dist | Beds/Ba | Sqft | Sold | Price | $/sf | Match |
|---|---|---|---|---|---|---|---|
| 105 1st St | 0.24mi | 2/1.0 (-1) | 1,044 (+8%) | 7mo | $180,000 | $172 | 64 |
Match score weights: distance 35% · size 25% · config 20% · recency 20%. Top-matched comps best support the ARV.
Projected returns pro-forma
2.26% appreciation · 3.0% rent growth · sell at horizon
- IRR
- -0.6%
- Equity multiple
- 0.97×
- Total profit
- $-1,481
- Equity at exit
- $65,374
- IRR
- 3.7%
- Equity multiple
- 1.52×
- Total profit
- $23,152
- Equity at exit
- $95,912
Cash invested: $44,800 (down + closing). Projections, not guarantees.
Landlord ↔ Tenant lean methodology
- Overall (STATE)
- 62 Landlord-Friendly
- State Pennsylvania
- 62 Landlord-Friendly · EVEN
- County
- — inherits STATE
- City
- — inherits STATE
ZIP-level market 15347
- Home prices YoY
- 1.9%
- Active inventory
- 6
- Price-to-rent
- 12.0×
Monthly cashflow live
- Estimated rent
- $1,110 medium interval (Pro) →
- Mortgage (P&I)
- −$839
- Tax est. 1.5%
- −$200 /mo · $2,400/yr
- Insurance
- −$67
- HOA
- −$0
- Vacancy / Maint / Mgmt
- −$233
- Net cashflow
- $-229
Break-even live
Sensitivity live
| Price | -10% $-119 | -5% $-174 | +0% $-229 | +5% $-284 | +10% $-340 |
|---|---|---|---|---|---|
| Rent | -10% $-317 | -5% $-273 | +0% $-229 | +5% $-185 | +10% $-142 |
| Rate | -1.0pp $-149 | -0.5pp $-189 | base $-229 | +0.5pp $-271 | +1.0pp $-313 |
UW: 25.0% down · 7.5% · 30yr · 1.5% tax · 5.0% vac · 8.0% maint · 8.0% mgmt
Financing live
Cash to close
- Down payment
- $40,000
- Closing costs
- $4,800
- Reserves months
- —
- Total cash needed
- —
Loan-product check · same deal, 3 products live
Conventional
25% down · 7.5% · 30yr
- Down + closing
- —
- Monthly P&I
- —
- Monthly cashflow
- —
- DSCR
- —
- Eligible?
- —
Personal DTI + credit; lowest rate.
DSCR
20% down · 8.5% · 30yr
- Down + closing
- —
- Monthly P&I
- —
- Monthly cashflow
- —
- DSCR
- —
- Eligible?
- —
No personal income docs; deal must DSCR.
Hard money
10% down · 12.0% · 12mo
- Down + closing
- —
- Monthly P&I
- —
- Monthly cashflow
- —
- DSCR
- —
- Eligible?
- —
Short-term bridge; refi at stabilization.
Listing history 20 events
-
2026-06-21days on market $160,000 Active 59 DOM
-
2026-06-18days on market $160,000 Active 56 DOM
-
2026-06-17days on market $160,000 Active 55 DOM
-
2026-06-16days on market $160,000 Active 54 DOM
-
2026-06-15days on market $160,000 Active 53 DOM
-
2026-06-13days on market $160,000 Active 51 DOM
-
2026-06-13days on market $160,000 Active 50 DOM
-
2026-06-09days on market $160,000 Active 47 DOM
-
2026-06-08days on market $160,000 Active 46 DOM
-
2026-06-07days on market $160,000 Active 45 DOM
-
2026-06-05days on market $160,000 Active 42 DOM
-
2026-06-03days on market $160,000 Active 41 DOM
-
2026-06-02days on market $160,000 Active 40 DOM
-
2026-06-01days on market $160,000 Active 39 DOM
-
2026-05-31days on market $160,000 Active 38 DOM
-
2026-04-23$160,000 Active 316-char remark
-
2021-09-23soldstatus $100,000 Closed 53-char remark
Show marketing remark (53 chars)
Nice rental potential. Plenty of parking in the rear.
-
2021-08-15status Pending 53-char remark
Show marketing remark (53 chars)
Nice rental potential. Plenty of parking in the rear.
-
2021-08-10historical Contingent 53-char remark
Show marketing remark (53 chars)
Nice rental potential. Plenty of parking in the rear.
-
2021-08-09$135,000 Active 53-char remark
Show marketing remark (53 chars)
Nice rental potential. Plenty of parking in the rear.
ⓘ Source: listings_history table (triggers on properties + properties_extension) + one-shot
backfill from property_details.listing_events for pre-trigger history.
Nearby sold comps map
Loading sold comps map…
Walkable amenities ~0.75 mi
Loading nearby amenities…
Taxation est. · year 1
- Rental income
- $13,314
- − Mortgage interest
- −$8,962
- − Property taxes
- −$2,400
- − Insurance
- −$800
- − Repairs & maintenance
- −$1,065
- − Management
- −$1,065
- − Depreciation
- −$4,655
- Taxable loss
- −$5,633
- Est. tax savings @ 24.0%
- +$1,352
- After-tax cash flow
- $-1,398/yr
For passive investors: Depreciation is non-cash, so a rental often shows a tax loss while cash-flowing — sheltering income. Rental losses are passive: they offset passive income freely, and up to $25,000/yr can offset ordinary (W-2) income if you actively participate and your MAGI is under $100k (phasing out to $0 by $150k); unused losses carry forward. On sale, claimed depreciation is recaptured at up to 25%, and gains may owe capital-gains tax (a 1031 exchange can defer both). Figures are a year-1 estimate at your 24.0% rate — not tax advice; consult a CPA.
Schools (NCES district)
- District
- Chartiers-Houston SD
- NCES district ID
- 4205730
- Math proficiency
- 40% ▼ -10.00%
- Reading proficiency
- 68% ▼ -4.00%
- Median HH income
- $56,103
- Composite
- 46.57/100
- National rank
- #2426
- State rank
- #125 of 539 in PA
Livability — Meadowlands
- Score
- 63/100
- State rank
- #1243
- US rank
- #14913
Category grades
Schools grade is shown separately in the Schools card above.
Census & demographics
- Census place
- Meadowlands, PA
- City population
- 285
- Population (ZIP)
- 285
Population outlook (Washington County) Hauer SSP2
- Today (2025)
- 208,060 people
- By 2030
- 207,168 · -0.4%
- By 2040
- 202,738 · -2.6%
- By 2050
- 195,269 · -6.1%
- By 2075
- 175,588 · -15.6%
- By 2100
- 145,827 · -29.9%
Race, ethnicity, and origin ACS 2023
- Neighborhood character
- Predominantly White (100%)
- Race & ethnicity
- White 100%
- Common ancestry
- Lithuanian 7% Iranian 7% Serbian 7%
Political lean MEDSL · Washington
- 2024 margin
- Strong R (+25.5) · D 36.9% · R 62.4%
- 2008→2024 swing
- -20.8pp toward R · 2008: -4.7pp · 2024: -25.5pp
- All cycles
- 2024: R+25.5 2020: R+22.8 2016: R+25.3 2012: R+13.3 2008: R+4.7
Not yet ingested
- Civics
- —
Market trends
- HPI YoY
- ▲ 2.26%
- Current HPI
- 122.3269
- Rent YoY
- —
- Metro
- —
- State GDP YoY
- ▲ 1.68%
- F500 in state
- 34
Industry mix (Fortune 500 HQ in PA)
| Industry | F500 HQs | Revenue |
|---|---|---|
| Healthcare | 2 | $309B |
|
||
| Insurance | 2 | $27B |
|
||
| Telecommunications / Media | 1 | $124B |
|
||
| Industrial Distribution | 1 | $22B |
|
||
| Financial Services | 1 | $20B |
|
||
| Chemicals / Materials | 1 | $18B |
|
||
Price history
+18.5% since first listed5 events — show timeline
- 2026-04-23 Listed $160,000 West Penn MLS
- 2021-09-23 Sold (MLS) $100,000 West Penn MLS
- 2021-08-15 Pending — West Penn MLS
- 2021-08-10 Contingent — West Penn MLS
- 2021-08-09 Listed $135,000 West Penn MLS
Cash-flow waterfall
monthlySold comps — $/sqft
last 12 mo · ≤1 miLoading sold comps…