13602 Litewood Dr · Hudson, FL
Flood risk 1/10 · Minimal
- FEMA flood zone
- X (unshaded)
- Chance of flooding over 30 yrs
- 0.0%
- Est. flood insurance / yr
- $507 – $1,088
Fire risk 2/10 · Minimal
- Est. fire insurance / yr
- $947 – $1,759
Heat risk 10/10 · Severe
- Hot days now (above 108°F)
- 7 days/yr
- Hot days in 30 yrs
- 25 days/yr
Wind risk 10/10 · Severe
- Chance of severe wind over 30 yrs
- 99.0%
Air-quality risk 2/10 · Minimal
- Unhealthy air days now
- 2 days/yr
- Unhealthy air days in 30 yrs
- 2 days/yr
Risk factors via First Street. Map © Google.
Why this score? — see what drove the B grade
The composite is a weighted blend of 9 inputs, each scored 0–100. Each bar is that input's sub-score; the figure is the points it added to the 100-point composite (weight × sub-score).
- Cash flow +30.0/30.0
- 1% rule +10.0/10.0
- DSCR +10.0/10.0
- ARV discount +7.5/15.0
- Schools +4.3/10.0
- Livability +3.7/5.0
- Rent growth +2.5/5.0
- Condition / age +2.5/5.0
- Appreciation +0.0/10.0
$70,000
🖨 Deal sheet (PDF) 📄 Offer letter ✓ Due diligence
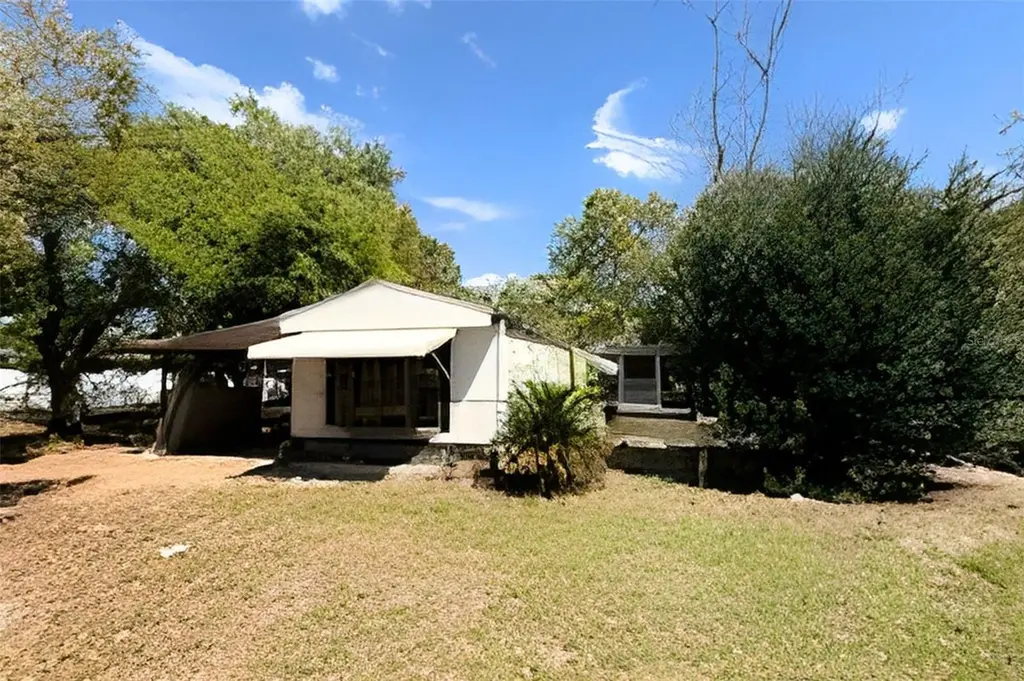
Listing remarks
Under contract-accepting backup offers. Investor Opportunity! This 1984 manufactured home sits on a spacious . 42-acre fenced lot, offering plenty of room for expansion, storage, or outdoor use. The property includes a two-car detached garage, providing added functionality and value. With great potential for renovation or rental income, this is a cash-only sale ideal for investors or buyers looking for their next project. Conveniently located in Hudson with easy access to major roads, shopping, and amenities.
Key facts
- Spacious fenced lot
- 0.42 acre lot
- 2 garage spots
Tags
Neighborhood map
What this means for you Summary
Snapshot
- This is a 3-bed/2.0-bath manufactured listed at $70k.
Deal economics
- At list price, monthly cash flow is $994 ($12k/yr) — positive.
- The deal already cash-flows at list — no discount required.
- Meets the 1% rule at list price ($2k rent vs $70k).
- Cap rate 23.3% vs local median 3.3% in Hudson — top-decile yield for the area; either an underpriced asset or a hidden risk that comps aren't pricing in. Stress-test before assuming the spread holds.
Location & tenants
- Location reads 74/100 on livability (#289 in FL, #4,856 nationally) — a middle-class / working-renter tenant base. Strengths: cost of living A+, housing A+, health & safety A+; Watch: amenities D, employment D, commute F.
- Pasco (suburban): math 50% / reading 52% proficiency, ranked #32 of 73 in FL (top 44%) — acceptable for families but not a draw, mixed tenant base, ~2y average lease.
- Zoned schools: Hudson Primary Academy (math 29% / reading 31%, grade F, #1,882 of 2,144 statewide, top 88%, 647 students, 90% FRL); Hudson Academy (math 35% / reading 30%, grade F, #443 of 571 statewide, top 78%, 964 students, 80% FRL); Fivay High School (math 20% / reading 28%, grade F, #529 of 667 statewide, top 80%, 1,610 students, 78% FRL) — zoned schools average 82% FRL vs 48% district-wide (34 pts higher); higher-poverty schools than district average — tighter screening recommended.
- Zoned-school proficiency averages 29% at this address vs 51% district-wide (-22 pts) — the specific schools serving this property underperform the Pasco average; the district grade overstates school quality for this exact location.
- Market conditions: 303 active listings in the ZIP; 3 comparable units currently listed for rent nearby; rentals at typical pace (median 20d on market — plan ~3-4 weeks tenant-placement turnaround); 6,765 units permitted in Pasco County in 2024 (1,250 in 5+ unit buildings).
- This rent runs 39% of the median local income ($59k/yr) — at the standard rent-burdened threshold; future hikes will face affordability resistance.
Forward outlook
- Local home prices are declining (-3.0%/yr); year-one equity from $484 of loan paydown is wiped out by about $2k of value loss. Plan a longer hold.
- Pasco County population projected at +29% by 2050 — long-run rental-demand tailwind backs the buy-and-hold thesis.
- At projected returns (-3.0% appreciation + 3.0% rent growth), your $20k cash investment doubles in ~2 years — after that, you're playing with house money.
Negotiation context
- Only 5 days on market — expect competitive offers; lowballing is unlikely to land.
- Current owner paid $45k; list at $70k implies a 56% gain — meaningful room to come down on a strong offer.
Risks & watch-outs
- Climate carrying-cost: severe wind risk, 99% chance of damaging wind over 30y; extreme-heat days projected 7→25/yr by 2055 (HVAC capex compounding) — expect insurance premiums to compound above CPI over the hold.
Questions for the listing agent
- Is there a deadline driving the sale (1031 exchange, divorce, estate, relocation)? That informs how much negotiation room exists.
- Schools are D-rated, which usually means shorter tenancies and higher turnover. Who's the typical renter profile here, and what's been the actual vacancy rate?
- What's the average days-on-market for RENTAL listings here right now (not sales)? A rising rental-DOM trend means longer vacancies and softer asking-rent achievability than the comps imply.
- What's the recent tenant-quality profile in this submarket — average credit score on applications, eviction rate, late-payment / NSF rate, and stable-employment percentage? A property-management company in the area should have these aggregated.
- How much new for-sale + rental construction is in the pipeline within 1–3 miles? Heavy new supply typically softens prices + rents 12–24 months out; constrained supply supports both.
Investment metrics
- 1% rule
- 2.76% ✓
- Cap rate
- 23.33%
- Cash-on-cash
- 60.85%
- DSCR
- 3.71
- GRM
- 3.0
CMA / ARV
- ARV (on-the-fly)
- $141,120
- Comps found
- 4
Show comp detail 4 sales within ~0.75 mi
| Address | Dist | Beds/Ba | Sqft | Sold | Price | $/sf | Match |
|---|---|---|---|---|---|---|---|
| 13602 Litewood Dr | 0.00mi | 2/1.0 (-1) | 840 (0%) | 1mo | $59,000 | $70 | 90 |
| 9739 Kent St | 0.40mi | 2/2.0 (-1) | 784 (-7%) | 2mo | $180,000 | $230 | 64 |
| 9633 Norm St | 0.20mi | 2/1.0 (-1) | 720 (-14%) | 2mo | $121,000 | $168 | 57 |
| 9519 Clyde St | 0.71mi | 3/2.0 | 960 (+14%) | 3mo | $101,000 | $105 | 40 |
Match score weights: distance 35% · size 25% · config 20% · recency 20%. Top-matched comps best support the ARV.
Projected returns pro-forma
-3.0% appreciation · 3.0% rent growth · sell at horizon
- IRR
- 59.7%
- Equity multiple
- 3.65×
- Total profit
- $52,012
- Equity at exit
- $10,437
- IRR
- 64.4%
- Equity multiple
- 7.48×
- Total profit
- $127,032
- Equity at exit
- $6,052
Cash invested: $19,600 (down + closing). Projections, not guarantees.
Landlord ↔ Tenant lean methodology
- Overall (STATE)
- 87 Strongly Landlord-Friendly
- State Florida
- 87 Strongly Landlord-Friendly · R+3
- County
- — inherits STATE
- City
- — inherits STATE
ZIP-level market 34669
- Home prices YoY
- -24.1%
- Active inventory
- 303
- Price-to-rent
- 3.0×
Monthly cashflow live
- Estimated rent
- $1,930 medium interval (Pro) →
- Mortgage (P&I)
- −$367
- Tax from tax record
- −$135 /mo · $1,615/yr
- Insurance
- −$29
- HOA
- −$0
- Vacancy / Maint / Mgmt
- −$405
- Net cashflow
- $994
Break-even live
Sensitivity live
| Price | -10% $1,033 | -5% $1,014 | +0% $994 | +5% $974 | +10% $954 |
|---|---|---|---|---|---|
| Rent | -10% $841 | -5% $918 | +0% $994 | +5% $1,070 | +10% $1,146 |
| Rate | -1.0pp $1,029 | -0.5pp $1,012 | base $994 | +0.5pp $976 | +1.0pp $957 |
UW: 25.0% down · 7.5% · 30yr · 1.5% tax · 5.0% vac · 8.0% maint · 8.0% mgmt
Financing live
Cash to close
- Down payment
- $17,500
- Closing costs
- $2,100
- Reserves months
- —
- Total cash needed
- —
Loan-product check · same deal, 3 products live
Conventional
25% down · 7.5% · 30yr
- Down + closing
- —
- Monthly P&I
- —
- Monthly cashflow
- —
- DSCR
- —
- Eligible?
- —
Personal DTI + credit; lowest rate.
DSCR
20% down · 8.5% · 30yr
- Down + closing
- —
- Monthly P&I
- —
- Monthly cashflow
- —
- DSCR
- —
- Eligible?
- —
No personal income docs; deal must DSCR.
Hard money
10% down · 12.0% · 12mo
- Down + closing
- —
- Monthly P&I
- —
- Monthly cashflow
- —
- DSCR
- —
- Eligible?
- —
Short-term bridge; refi at stabilization.
Rent comps 3 comps
| Address | Beds | Baths | Sqft | Rent | $/sqft | DOM | Units | Dist |
|---|---|---|---|---|---|---|---|---|
| 12909 Litewood Dr Hudson, FL | 3.0 | 2.0 | 1000 | $1,645 | $1.65 | 26d | 1 | 0.70mi |
| 12909 Litewood Dr Hudson, FL | 3.0 | 2.0 | 984 | $1,645 | $1.67 | 20d | 1 | 0.70mi |
| 11105 Pinto Dr Port Richey, FL | 2.0 | 1.0 | 672 | $1,350 | $2.01 | 14d | 1 | 1.44mi |
Listing history 7 events
-
2026-03-30status Pending
-
2026-03-25$70,000 Active
-
2019-01-18soldstatus $45,000
-
2016-02-11soldstatus $48,900
-
2004-05-13soldstatus $57,000
-
2000-05-22soldstatus $37,900
-
1995-08-16soldstatus $38,700
ⓘ Source: listings_history table (triggers on properties + properties_extension) + one-shot
backfill from property_details.listing_events for pre-trigger history.
Tax reassessment forecast FL · Resets to sale price
- Current annual tax
- $1,615 · $135/mo
- Projected year-2 tax
- $1,615 · $135/mo
- Expected delta
- $0/yr ($0/mo · 0.0%)
ⓘ Screening estimate from a state-policy table — verify with the county assessor before closing.
Climate risk First Street
- Flood 1/10 Low FEMA zone X (unshaded) · 0% chance over 30 yrs
- Wildfire 2/10 Low
- Heat 10/10 Extreme 7 d/yr ≥108°F today · 25 d/yr by 30 yrs out
- Wind 10/10 Extreme 99% chance of damaging wind over 30 yrs
- Air quality 2/10 Low 2 unhealthy d/yr today · 2 by 30 yrs out
Nearby sold comps map
Loading sold comps map…
Walkable amenities ~0.75 mi
Loading nearby amenities…
Taxation est. · year 1
- Rental income
- $23,160
- − Mortgage interest
- −$3,921
- − Property taxes
- −$1,615
- − Insurance
- −$350
- − Repairs & maintenance
- −$1,853
- − Management
- −$1,853
- − Depreciation
- −$2,036
- Taxable income
- $11,531
- Est. tax owed @ 24.0%
- −$2,768
- After-tax cash flow
- $9,158/yr
For passive investors: Depreciation is non-cash, so a rental often shows a tax loss while cash-flowing — sheltering income. Rental losses are passive: they offset passive income freely, and up to $25,000/yr can offset ordinary (W-2) income if you actively participate and your MAGI is under $100k (phasing out to $0 by $150k); unused losses carry forward. On sale, claimed depreciation is recaptured at up to 25%, and gains may owe capital-gains tax (a 1031 exchange can defer both). Figures are a year-1 estimate at your 24.0% rate — not tax advice; consult a CPA.
Schools (NCES district)
- District
- Pasco
- NCES district ID
- 1201530
- Math proficiency
- 50% ▼ -10.00%
- Reading proficiency
- 52% ▼ -5.00%
- Median HH income
- $45,039
- Composite
- 43.14/100
- National rank
- #3074
- State rank
- #32 of 73 in FL
Livability — Hudson
- Score
- 74/100
- State rank
- #289
- US rank
- #4856
Category grades
Schools grade is shown separately in the Schools card above.
Census & demographics
- County
- Pasco County · 524,098 people
- City population
- 45,307
- Metro
- Tampa-St. Petersburg-Clearwater, FL
- Population (ZIP)
- 14,618
- Household income
- $58,638
- Rent vs Own
- Severe rent burden
- 176.0
Population outlook (Pasco County) Hauer SSP2
- Today (2025)
- 570,045 people
- By 2030
- 605,844 · +6.3%
- By 2040
- 674,806 · +18.4%
- By 2050
- 736,022 · +29.1%
- By 2075
- 862,900 · +51.4%
- By 2100
- 906,364 · +59.0%
Race, ethnicity, and origin ACS 2023
- Neighborhood character
- Predominantly White (80%)
- Race & ethnicity
- White 80% Hispanic / Latino 10% Two or more races 6% Black 4% Asian 3%
- Hispanic origin (detail)
- Puerto Rican 5% Cuban 1%
- Common ancestry
- Romanian 4% Lithuanian 2% Slovak 1%
- Foreign-born
- 8% · Canada, Vietnam, Jamaica
- Languages at home
- 90% English-only · Spanish 7% Vietnamese 3% Other Indo-European 1%
Political lean MEDSL · Pasco
- 2024 margin
- Strong R (+25.2) · D 36.9% · R 62.1% · Other 1.0%
- 2008→2024 swing
- -21.6pp toward R · 2008: -3.6pp · 2024: -25.2pp
- All cycles
- 2024: R+25.2 2020: R+20.1 2016: R+21.6 2012: R+6.7 2008: R+3.6
Not yet ingested
- Civics
- —
Market trends
- HPI YoY
- ▼ -102.24%
- Current HPI
- 321.5862
- Rent YoY
- —
- Metro
- Tampa-St. Petersburg-Clearwater, FL
- State GDP YoY
- ▲ 3.28%
- F500 in state
- 36
Industry mix (Fortune 500 HQ in FL)
| Industry | F500 HQs | Revenue |
|---|---|---|
| Industrial Technology | 2 | $29B |
|
||
| Insurance | 2 | $17B |
|
||
| Retail | 1 | $60B |
|
||
| Technology Distribution | 1 | $58B |
|
||
| Homebuilding | 1 | $35B |
|
||
| Technology Manufacturing | 1 | $35B |
|
||
Price history
+80.9% since first listed7 events — show timeline
- 2026-03-30 Pending — Stellar MLS as Distributed by MLS Grid
- 2026-03-25 Listed $70,000 Stellar MLS as Distributed by MLS Grid
- 2019-01-18 Sold (Public Records) $45,000 Public Records
- 2016-02-11 Sold (Public Records) $48,900 Public Records
- 2004-05-13 Sold (Public Records) $57,000 Public Records
- 2000-05-22 Sold (Public Records) $37,900 Public Records
- 1995-08-16 Sold (Public Records) $38,700 Public Records
Property tax history
+7.6%/yrLatest (2025): $1,615 · +7.4% YoY. Source: county tax records.
Cash-flow waterfall
monthlySold comps — $/sqft
last 12 mo · ≤1 miLoading sold comps…