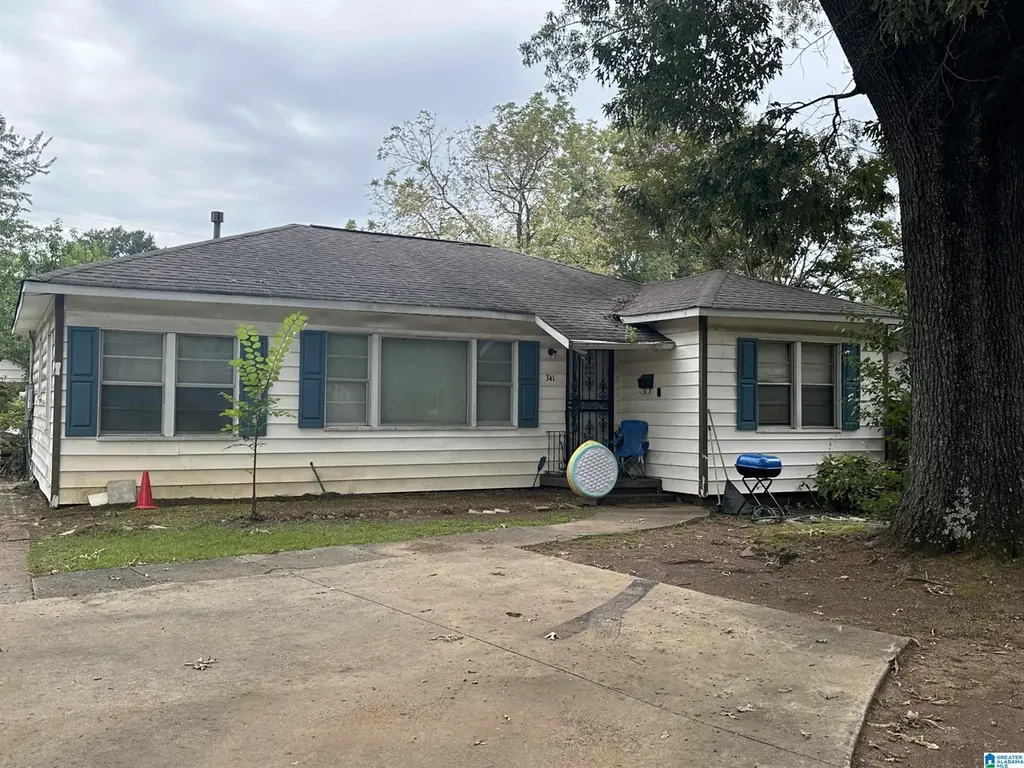
341 Midwood Ave · Midfield, AL
Flood risk 1/10 · Minimal
- FEMA flood zone
- X (unshaded)
- Chance of flooding over 30 yrs
- 0.0%
- Est. flood insurance / yr
- $507 – $1,088
Fire risk 1/10 · Minimal
- Est. fire insurance / yr
- $916 – $1,700
Heat risk 6/10 · Moderate
- Hot days now (above 108°F)
- 7 days/yr
- Hot days in 30 yrs
- 19 days/yr
Wind risk 6/10 · Moderate
- Chance of severe wind over 30 yrs
- 27.0%
Air-quality risk 4/10 · Minor
- Unhealthy air days now
- 5 days/yr
- Unhealthy air days in 30 yrs
- 5 days/yr
Risk factors via First Street. Map © Google.
Why this score? — see what drove the C+ grade
The composite is a weighted blend of 9 inputs, each scored 0–100. Each bar is that input's sub-score; the figure is the points it added to the 100-point composite (weight × sub-score).
- Cash flow +30.0/30.0
- DSCR +10.0/10.0
- 1% rule +8.5/10.0
- ARV discount +3.2/15.0
- Livability +3.2/5.0
- Appreciation +2.6/10.0
- Condition / age +2.5/5.0
- Rent growth +2.1/5.0
- Schools +0.7/10.0
$85,000
🖨 Deal sheet 📄 Offer letter ✓ Due diligence
Listing remarks MLS
Great opportunity for an investor or homeowner! This 3 bed / 1 bath single-story home is currently tenant-occupied on a month-to-month lease at $950/month, providing immediate cash flow. Market rents in the area are closer to $1,200/month, leaving plenty of upside for the next owner. Whether you keep the tenant in place for steady income or move them out to make this property your own, you’ll find strong potential here. With just a little TLC, this home can truly shine. Located on a charming street in Birmingham with ample parking and great space, it offers affordability and flexibility for both investors and primary occupants alike. Don’t miss this chance to secure a property with built in equity.
Key facts
- 8,712 sq ft lot
- Garage
- Built 1950
Neighborhood map
What this means for you Summary
Snapshot
- This is a 3-bed/1.0-bath single-family listed at $85k.
Deal economics
- At list price, monthly cash flow is $320 ($4k/yr) — positive.
- The deal already cash-flows at list — no discount required.
- Meets the 1% rule at list price ($1k rent vs $85k).
- Recommended offer: $75k (12.0% below list) — sets the bar for market timing.
Location & tenants
- Location reads 64/100 on livability (#164 in AL) — a middle-class / working-renter tenant base. Strengths: commute A+, cost of living A+, housing A+; Watch: schools F, amenities F, employment F.
- Midfield City (suburban): math 2% / reading 14% proficiency, ranked #126 of 129 in AL (top 98%) — low school quality limits family demand, transient renter base, plan for 1-2y turnover; 83% free/reduced lunch — lower-income household profile, screen leases tightly.
- Market conditions: Rents soft (-1.5%/yr); 87 active listings in the ZIP; 40 comparable units currently listed for rent nearby; rentals lingering (median 44d on market — plan ~5-8 weeks vacancy on turnover, expect pricing pressure); 60% of comp listings sitting > 30 days — soft ceiling on asking rent; 2,114 units permitted in Jefferson County in 2024 (556 in 5+ unit buildings).
Forward outlook
- Local home prices are declining (-3.0%/yr); year-one equity from $588 of loan paydown is wiped out by about $3k of value loss. Plan a longer hold.
- Jefferson County population projected to shrink 4% by 2050 — rents likely to lag national; underwrite the cash flow, not the appreciation.
Negotiation context
- It's been on market 276 days — a 12% lower offer ($75k) is reasonable based on typical stale-listing flexibility.
- 3 sale attempts since 14y ago; this cycle's ask has dropped $30k (26%) from the opening price — seller is motivated, your offer sets the floor, not the list.
- Current owner paid $62k; 37% above their basis — modest negotiation headroom, anchor on the comps not their cost.
Risks & watch-outs
- Watch-outs: built in 1950 — expect roof / HVAC / electrical / plumbing capex.
- Climate carrying-cost: major wind risk, 27% chance of damaging wind over 30y; extreme-heat days projected 7→19/yr by 2055 (HVAC capex compounding) — expect insurance premiums to compound above CPI over the hold.
Questions for the listing agent
- It's been on market 276 days. Have you received any prior offers? Is the seller open to a 12% concession, seller financing, or rate buy-down credit?
- Built in 1950 — when were the roof, HVAC, electrical panel, plumbing, and water heater last replaced?
- Why hasn't it sold? Are there any deal-killer items the seller is aware of (foundation, flood, title, zoning, code violations)?
- Is there a deadline driving the sale (1031 exchange, divorce, estate, relocation)? That informs how much negotiation room exists.
- Schools are F-rated, which usually means shorter tenancies and higher turnover. Who's the typical renter profile here, and what's been the actual vacancy rate?
- What's the average days-on-market for RENTAL listings here right now (not sales)? A rising rental-DOM trend means longer vacancies and softer asking-rent achievability than the comps imply.
- What's the recent tenant-quality profile in this submarket — average credit score on applications, eviction rate, late-payment / NSF rate, and stable-employment percentage? A property-management company in the area should have these aggregated.
- How much new for-sale + rental construction is in the pipeline within 1–3 miles? Heavy new supply typically softens prices + rents 12–24 months out; constrained supply supports both.
Investment metrics
- 1% rule
- 1.35% ✓
- Cap rate
- 10.81%
- Cash-on-cash
- 16.14%
- DSCR
- 1.72
- GRM
- 6.2
CMA / ARV
- ARV (median comp)
- $77,526
- List price
- $85,000
- Delta
- 9.64%
- Verdict
- FAIR
- Comps
- 20 within 1.0 mi
Show comp detail 12 sales within ~0.75 mi
| Address | Dist | Beds/Ba | Sqft | Sold | Price | $/sf | Match |
|---|---|---|---|---|---|---|---|
| 1356 Woodward Rd | 0.04mi | 3/1.0 | 1,164 (0%) | 1mo | $98,000 | $84 | 98 |
| 1412 Woodward Rd | 0.11mi | 3/1.0 | 1,220 (+5%) | 2mo | $65,000 | $53 | 85 |
| 1240 Rayfield Dr | 0.28mi | 3/1.0 | 1,192 (+2%) | 2mo | $75,313 | $63 | 81 |
| 1205 Brighton Rd | 0.50mi | 3/1.5 | 1,147 (-2%) | 3mo | $93,000 | $81 | 70 |
| 1376 Creel Ct | 0.09mi | 3/1.0 | 1,008 (-13%) | 8mo | $72,500 | $72 | 66 |
| 1101 Susan Ln | 0.35mi | 3/2.0 | 1,025 (-12%) | 1mo | $164,000 | $160 | 59 |
| 130 Woodward Rd | 0.38mi | 3/1.0 | 1,023 (-12%) | 8mo | $54,887 | $54 | 56 |
| 6633 Avenue | 0.68mi | 3/2.0 | 1,107 (-5%) | 2mo | $99,900 | $90 | 54 |
| 6636 Avenue | 0.65mi | 3/2.0 | 1,134 (-3%) | 9mo | $165,000 | $146 | 54 |
| 1505 Collier Dr | 0.44mi | 3/1.0 | 992 (-15%) | 4mo | $60,000 | $60 | 51 |
| 913 Daniel Cir | 0.50mi | 3/1.5 | 1,317 (+13%) | 6mo | $75,000 | $57 | 48 |
| 1417 Brighton Rd | 0.71mi | 3/1.5 | 1,048 (-10%) | 6mo | $110,000 | $105 | 44 |
Match score weights: distance 35% · size 25% · config 20% · recency 20%. Top-matched comps best support the ARV.
Projected returns pro-forma
-3.0% appreciation · 0.0% rent growth · sell at horizon
- IRR
- 3.7%
- Equity multiple
- 1.14×
- Total profit
- $3,267
- Equity at exit
- $12,674
- IRR
- 10.1%
- Equity multiple
- 1.68×
- Total profit
- $16,157
- Equity at exit
- $7,349
Cash invested: $23,800 (down + closing). Projections, not guarantees.
Landlord ↔ Tenant lean methodology
- Overall (STATE)
- 90 Strongly Landlord-Friendly
- State Alabama
- 90 Strongly Landlord-Friendly · R+15
- County
- — inherits STATE
- City
- — inherits STATE
ZIP-level market 35228
- Home prices YoY
- -3.5%
- Rents YoY
- -1.5%
- Active inventory
- 87
- Price-to-rent
- 6.2×
Monthly cashflow live
- Estimated rent
- $1,149 high interval (Pro) →
- Mortgage (P&I)
- −$446
- Tax from tax record
- −$106 /mo · $1,277/yr
- Insurance
- −$35
- HOA
- −$0
- Vacancy / Maint / Mgmt
- −$241
- Net cashflow
- $320
Break-even live
UW: 25.0% down · 7.5% · 30yr · 1.5% tax · 5.0% vac · 8.0% maint · 8.0% mgmt
Financing live
Cash to close
- Down payment
- $21,250
- Closing costs
- $2,550
- Reserves months
- —
- Total cash needed
- —
Loan-product check · same deal, 3 products live
Conventional
25% down · 7.5% · 30yr
- Down + closing
- —
- Monthly P&I
- —
- Monthly cashflow
- —
- DSCR
- —
- Eligible?
- —
Personal DTI + credit; lowest rate.
DSCR
20% down · 8.5% · 30yr
- Down + closing
- —
- Monthly P&I
- —
- Monthly cashflow
- —
- DSCR
- —
- Eligible?
- —
No personal income docs; deal must DSCR.
Hard money
10% down · 12.0% · 12mo
- Down + closing
- —
- Monthly P&I
- —
- Monthly cashflow
- —
- DSCR
- —
- Eligible?
- —
Short-term bridge; refi at stabilization.
Rent comps 40 comps
| Address | Beds | Baths | Sqft | Rent | $/sqft | DOM | Units | Dist |
|---|---|---|---|---|---|---|---|---|
| 336 McPherson Ave Birmingham, AL | 3.0 | 1.0 | 1094 | $1,100 | $1.01 | 23d | 1 | 0.08mi |
| 340 McPherson Ave Birmingham, AL | 2.0 | 1.0 | 924 | $910 | $0.98 | 43d | 1 | 0.08mi |
| 1376 Creel Ct Birmingham, AL | 3.0 | 1.0 | 1008 | $1,000 | $0.99 | 43d | 1 | 0.10mi |
| 1412 Woodward Rd Birmingham, AL | 3.0 | 1.0 | 1220 | $1,203 | $0.99 | 15d | 1 | 0.14mi |
| 373 Belcher Dr Birmingham, AL | 4.0 | 1.0 | 1255 | $1,100 | $0.88 | 43d | 1 | 0.16mi |
| 408 Midway St Birmingham, AL | 3.0 | 1.0 | 1301 | $1,075 | $0.83 | 19d | 1 | 0.19mi |
| 1433 Rayfield Dr Birmingham, AL | 3.0 | 1.0 | 1064 | $950 | $0.89 | 43d | 1 | 0.23mi |
| 1441 Creel St Birmingham, AL | 3.0 | 2.0 | 1319 | $1,275 | $0.97 | 3d | 1 | 0.28mi |
| 1112 S Gale Dr Birmingham, AL | 3.0 | 1.5 | 1053 | $1,175 | $1.12 | 43d | 1 | 0.36mi |
| 120 Parkwood St Birmingham, AL | 3.0 | 1.5 | 1224 | $1,150 | $0.94 | 15d | 1 | 0.44mi |
| 913 Daniel Cir Birmingham, AL | 4.0 | 2.0 | 1317 | $1,300 | $0.99 | 43d | 1 | 0.48mi |
| 1417 Brighton Rd Birmingham, AL | 3.0 | 2.0 | 1048 | $1,200 | $1.15 | 43d | 1 | 0.69mi |
| 537 Grant St Birmingham, AL | 3.0 | 1.0 | 1444 | $1,200 | $0.83 | 23d | 1 | 0.73mi |
| 517 Grant St Birmingham, AL | 3.0 | 1.0 | 912 | $850 | $0.93 | 23d | 1 | 0.73mi |
| 1721 Collier Dr Birmingham, AL | 2.0 | 1.0 | 925 | $800 | $0.86 | 43d | 1 | 0.76mi |
| 502 64th St Fairfield, AL | 3.0 | 1.0 | 1250 | $695 | $0.56 | 43d | 1 | 0.76mi |
| 1272 Meadow Ln Birmingham, AL | 2.0 | 1.0 | 744 | $800 | $1.08 | 43d | 1 | 0.77mi |
| 435 62nd St Fairfield, AL | 3.0 | 2.0 | 1249 | $985 | $0.79 | 43d | 1 | 0.87mi |
| 704 61st St Fairfield, AL | 3.0 | 1.0 | 1184 | $1,050 | $0.89 | 23d | 1 | 0.91mi |
| 5709 Court H Birmingham, AL | 4.0 | 1.5 | 1455 | $1,400 | $0.96 | 1d | 1 | 0.95mi |
| 1341 Pineview Rd Birmingham, AL | 4.0 | 2.0 | 1409 | $1,300 | $0.92 | 43d | 1 | 0.96mi |
| 125 Jerry Coleman St Fairfield, AL | 2.0 | 1.0 | 715 | $725 | $1.01 | 43d | 1 | 0.97mi |
| 1340 Pineview Rd Birmingham, AL | 3.0 | 2.0 | 1116 | $1,075 | $0.96 | 43d | 1 | 0.97mi |
| 3729 Maple Ave SW Birmingham, AL | 3.0 | 2.0 | 1008 | $1,200 | $1.19 | 43d | 1 | 0.98mi |
| 5712 Monte Sano Rd Birmingham, AL | 2.0 | 1.0 | 700 | $900 | $1.29 | 43d | 1 | 0.98mi |
| 3736 Oak Ave SW Birmingham, AL | 3.0 | 2.0 | 984 | $1,050 | $1.07 | 23d | 1 | 0.99mi |
| 5710 Monte Sano Dr Birmingham, AL | 2.0 | 1.0 | 700 | $950 | $1.36 | 43d | 1 | 1.00mi |
| 3616 Maple Ave SW Birmingham, AL | 2.0 | 1.0 | 1488 | $950 | $0.64 | 43d | 1 | 1.06mi |
| 5503 Myron Massey Blvd Fairfield, AL | 3.0 | 2.0 | 1119 | $1,200 | $1.07 | 43d | 1 | 1.07mi |
| 3400 Walnut Ave SW Birmingham, AL | 3.0 | 1.0 | 1133 | $1,200 | $1.06 | 43d | 1 | 1.08mi |
| 3729 Pine Ave SW Birmingham, AL | 3.0 | 1.0 | 1067 | $1,100 | $1.03 | 21d | 1 | 1.08mi |
| 3417 Park Ave SW Birmingham, AL | 4.0 | 1.0 | 1402 | $900 | $0.64 | 43d | 1 | 1.08mi |
| 3332 Walnut Ave SW Birmingham, AL | 3.0 | 1.0 | 1339 | $750 | $0.56 | 19d | 1 | 1.09mi |
| 5406 Court G Unit G Fairfield, AL | 3.0 | 2.0 | 1449 | $1,199 | $0.83 | 11d | 1 | 1.13mi |
| 4029 Walnut Ave SW Birmingham, AL | 2.0 | 1.0 | 1300 | $1,369 | $1.05 | 3d | 1 | 1.15mi |
| 5316 Court I Birmingham, AL | 3.0 | 2.0 | 1284 | $1,200 | $0.93 | 43d | 1 | 1.17mi |
| 5808 Court O Birmingham, AL | 3.0 | 1.5 | 1227 | $1,100 | $0.90 | 43d | 1 | 1.18mi |
| 109 59th St Fairfield, AL | 4.0 | 1.0 | 1344 | $1,200 | $0.89 | 11d | 1 | 1.19mi |
| 5300 Avenue I Birmingham, AL | 4.0 | 2.0 | 1360 | $1,500 | $1.10 | 1d | 1 | 1.20mi |
| 209 58th St Fairfield, AL | 3.0 | 2.0 | 1468 | $1,200 | $0.82 | 43d | 1 | 1.20mi |
Listing history 10 events
-
2026-05-31days on market $85,000 Active 276 DOM
-
2026-01-17price $85,000 719-char remark
Show marketing remark (719 chars)
Great opportunity for an investor or homeowner! This 3 bed / 1 bath single-story home is currently tenant-occupied on a month-to-month lease at $950/month, providing immediate cash flow. Market rents in the area are closer to $1,200/month, leaving plenty of upside for the next owner. Whether you keep the tenant in place for steady income or move them out to make this property your own, you’ll find strong potential here. With just a little TLC, this home can truly shine. Located on a charming street in Birmingham with ample parking and great space, it offers affordability and flexibility for both investors and primary occupants alike. Don’t miss this chance to secure a property with built in equity.
-
2025-09-13price $90,000 719-char remark
Show marketing remark (719 chars)
Great opportunity for an investor or homeowner! This 3 bed / 1 bath single-story home is currently tenant-occupied on a month-to-month lease at $950/month, providing immediate cash flow. Market rents in the area are closer to $1,200/month, leaving plenty of upside for the next owner. Whether you keep the tenant in place for steady income or move them out to make this property your own, you’ll find strong potential here. With just a little TLC, this home can truly shine. Located on a charming street in Birmingham with ample parking and great space, it offers affordability and flexibility for both investors and primary occupants alike. Don’t miss this chance to secure a property with built in equity.
-
2025-09-05price $105,000 719-char remark
Show marketing remark (719 chars)
Great opportunity for an investor or homeowner! This 3 bed / 1 bath single-story home is currently tenant-occupied on a month-to-month lease at $950/month, providing immediate cash flow. Market rents in the area are closer to $1,200/month, leaving plenty of upside for the next owner. Whether you keep the tenant in place for steady income or move them out to make this property your own, you’ll find strong potential here. With just a little TLC, this home can truly shine. Located on a charming street in Birmingham with ample parking and great space, it offers affordability and flexibility for both investors and primary occupants alike. Don’t miss this chance to secure a property with built in equity.
-
2025-08-28$115,000 Active 719-char remark
Show marketing remark (719 chars)
Great opportunity for an investor or homeowner! This 3 bed / 1 bath single-story home is currently tenant-occupied on a month-to-month lease at $950/month, providing immediate cash flow. Market rents in the area are closer to $1,200/month, leaving plenty of upside for the next owner. Whether you keep the tenant in place for steady income or move them out to make this property your own, you’ll find strong potential here. With just a little TLC, this home can truly shine. Located on a charming street in Birmingham with ample parking and great space, it offers affordability and flexibility for both investors and primary occupants alike. Don’t miss this chance to secure a property with built in equity.
-
2022-03-30soldstatus $62,000
-
2022-03-29soldstatus $72,500 Sold 496-char remark
Show marketing remark (496 chars)
“Investors Special”, Assignment of property Beautiful single family home. Property will be delivered vacant upon closing. Also lock box is currently on property but please reach out before heading to property as tenants are still in place. Garage with 4 car port. Also have inspection report with full photos upon requests. Priced low and also move in ready. Cash Buyers and or Hard Money. Once purchased great property to either place more tenants or to “Finish and Flip”
-
2022-03-13$79,500 Active 496-char remark
Show marketing remark (496 chars)
“Investors Special”, Assignment of property Beautiful single family home. Property will be delivered vacant upon closing. Also lock box is currently on property but please reach out before heading to property as tenants are still in place. Garage with 4 car port. Also have inspection report with full photos upon requests. Priced low and also move in ready. Cash Buyers and or Hard Money. Once purchased great property to either place more tenants or to “Finish and Flip”
-
2012-03-15soldstatus $21,000
-
2012-01-13$27,000
ⓘ Source: listings_history table (triggers on properties + properties_extension) + one-shot
backfill from property_details.listing_events for pre-trigger history.
Tax reassessment forecast AL · Resets to sale price
- Current annual tax
- $1,277 · $106/mo
- Projected year-2 tax
- $1,277 · $106/mo
- Expected delta
- $0/yr ($0/mo · 0.0%)
ⓘ Screening estimate from a state-policy table — verify with the county assessor before closing.
Climate risk First Street
- Flood 1/10 Low FEMA zone X (unshaded) · 0% chance over 30 yrs
- Wildfire 1/10 Low
- Heat 6/10 Major 7 d/yr ≥108°F today · 19 d/yr by 30 yrs out
- Wind 6/10 Major 27% chance of damaging wind over 30 yrs
- Air quality 4/10 Moderate 5 unhealthy d/yr today · 5 by 30 yrs out
Nearby sold comps map
Loading sold comps map…
Walkable amenities ~0.75 mi
Loading nearby amenities…
Taxation est. · year 1
- Rental income
- $13,788
- − Mortgage interest
- −$4,761
- − Property taxes
- −$1,277
- − Insurance
- −$425
- − Repairs & maintenance
- −$1,103
- − Management
- −$1,103
- − Depreciation
- −$2,473
- Taxable income
- $2,646
- Est. tax owed @ 24.0%
- −$635
- After-tax cash flow
- $3,207/yr
For passive investors: Depreciation is non-cash, so a rental often shows a tax loss while cash-flowing — sheltering income. Rental losses are passive: they offset passive income freely, and up to $25,000/yr can offset ordinary (W-2) income if you actively participate and your MAGI is under $100k (phasing out to $0 by $150k); unused losses carry forward. On sale, claimed depreciation is recaptured at up to 25%, and gains may owe capital-gains tax (a 1031 exchange can defer both). Figures are a year-1 estimate at your 24.0% rate — not tax advice; consult a CPA.
Schools (NCES district)
- District
- Midfield City
- NCES district ID
- 0102350
- Math proficiency
- 2% ▼ -18.00%
- Reading proficiency
- 14% ▼ -5.00%
- Median HH income
- $39,267
- Composite
- 6.89/100
- National rank
- #9978
- State rank
- #126 of 129 in AL
Livability — Midfield
- Score
- 64/100
- State rank
- #164
- US rank
- #14536
Category grades
Schools grade is shown separately in the Schools card above.
Census & demographics
- Census place
- Midfield, AL
- County
- Jefferson County · 527,445 people
- City population
- 10,216
- Metro
- Birmingham-Hoover, AL
- Population (ZIP)
- 10,216
- Household income
- $50,815
- Rent vs Own
- Severe rent burden
- 456.0
Population outlook (Jefferson County) Hauer SSP2
- Today (2025)
- 669,185 people
- By 2030
- 669,694 · +0.1%
- By 2040
- 661,388 · -1.2%
- By 2050
- 643,086 · -3.9%
- By 2075
- 577,267 · -13.7%
- By 2100
- 474,758 · -29.1%
Race, ethnicity, and origin ACS 2023
- Neighborhood character
- Predominantly Black (89%)
- Race & ethnicity
- Black 89% Hispanic / Latino 5% Two or more races 5% White 5%
- Foreign-born
- 2% · Canada
- Languages at home
- 95% English-only · Spanish 5%
Political lean MEDSL · Jefferson
- 2024 margin
- D (+10.4) · D 54.6% · R 44.2% · Other 1.2%
- 2008→2024 swing
- +5.4pp toward D · 2008: 5.1pp · 2024: 10.4pp
- All cycles
- 2024: D+10.4 2020: D+13.2 2016: D+7.2 2012: D+6.0 2008: D+5.1
Not yet ingested
- Civics
- —
Market trends
- HPI YoY
- ▼ -4.84%
- Current HPI
- 134.8633
- Rent YoY
- ▼ -1.47%
- Metro
- Birmingham-Hoover, AL
- State GDP YoY
- ▲ 2.94%
- F500 in state
- 4
Industry mix (Fortune 500 HQ in AL)
| Industry | F500 HQs | Revenue |
|---|---|---|
| Financial Services | 1 | $8B |
|
||
| Healthcare | 1 | $5B |
|
||
Price history
+214.8% since first listed9 events — show timeline
- 2026-01-17 Price Changed $85,000 Greater Alabama MLS
- 2025-09-13 Price Changed $90,000 Greater Alabama MLS
- 2025-09-05 Price Changed $105,000 Greater Alabama MLS
- 2025-08-28 Listed $115,000 Greater Alabama MLS
- 2022-03-30 Sold (Public Records) $62,000 Public Records
- 2022-03-29 Sold (MLS) $72,500 Greater Alabama MLS
- 2022-03-13 Listed $79,500 Greater Alabama MLS
- 2012-03-15 Sold (MLS) $21,000 Greater Alabama MLS
- 2012-01-13 Listed $27,000 Greater Alabama MLS
Property tax history
+3.9%/yrLatest (2025): $1,277 · +6.9% YoY. Source: county tax records.
Cash-flow waterfall
monthlySold comps — $/sqft
last 12 mo · ≤1 miLoading sold comps…