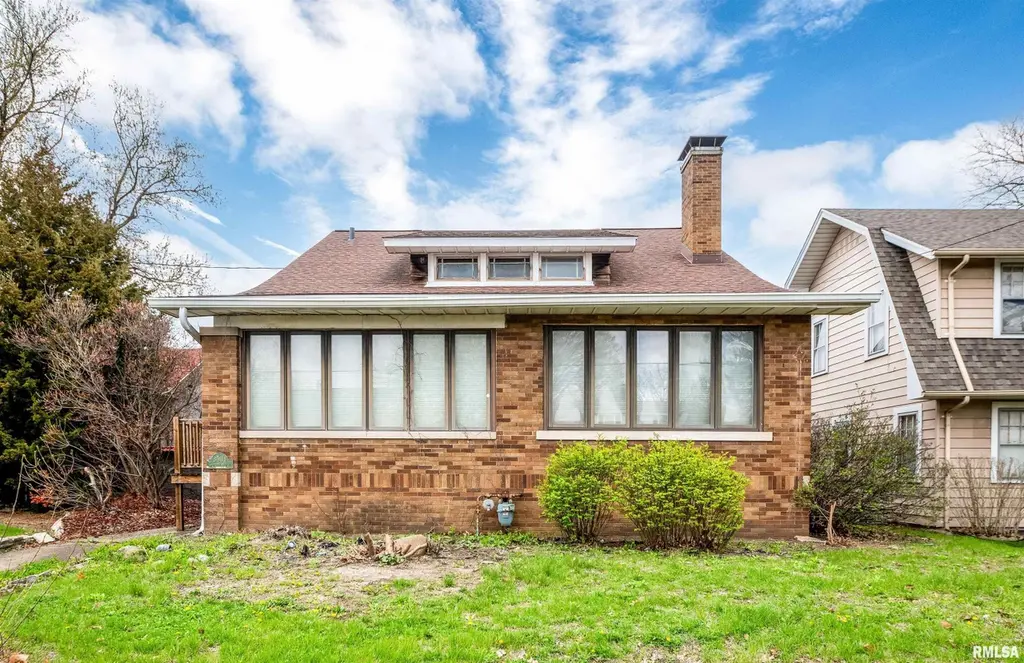
3004 N Knoxville Ave · Peoria, IL
Flood risk 1/10 · Minimal
- FEMA flood zone
- X
- Chance of flooding over 30 yrs
- 0.0%
- Est. flood insurance / yr
- $473 – $860
Fire risk 1/10 · Minimal
- Est. fire insurance / yr
- $804 – $1,492
Heat risk 3/10 · Minor
- Hot days now (above 105°F)
- 7 days/yr
- Hot days in 30 yrs
- 18 days/yr
Wind risk 2/10 · Minimal
- Chance of severe wind over 30 yrs
- 1.0%
Air-quality risk 3/10 · Minor
- Unhealthy air days now
- 1 days/yr
- Unhealthy air days in 30 yrs
- 3 days/yr
Risk factors via First Street. Map © Google.
Why this score? — see what drove the D- grade
The composite is a weighted blend of 9 inputs, each scored 0–100. Each bar is that input's sub-score; the figure is the points it added to the 100-point composite (weight × sub-score).
- ARV discount +15.0/15.0
- Cash flow +6.8/30.0
- Livability +3.7/5.0
- Appreciation +3.0/10.0
- Rent growth +2.5/5.0
- Condition / age +2.5/5.0
- 1% rule +2.1/10.0
- Schools +1.1/10.0
- DSCR +1.0/10.0
$150,000
🖨 Deal sheet 📄 Offer letter ✓ Due diligence
Listing remarks MLS
Charming 1.5-story brick home full of character and timeless appeal! This 3-bedroom, 1-bath home with a main-level den offers the perfect blend of historic charm and functional living. Built in 1924, you’ll appreciate the original details throughout—custom built-ins, rich trim work, high ceilings, and a thoughtful, flowing layout. Hardwood flooring spans much of the main level, leading you into a spacious living room anchored by a cozy gas fireplace and a formal dining room ideal for gatherings. A bright sunroom provides the perfect space to relax and enjoy natural light year-round. The kitchen is well-equipped with a refrigerator, range/oven, dishwasher, pantry, breakfast bar, and an abundance of cabinetry for storage and convenience. Upstairs, you’ll find a generously sized bedroom along with a versatile den—ideal for a home office, sitting room, or potential walk-in closet. The partially finished basement expands your living space with a recreation room, bonus room, storage area, and utility room, featuring fresh paint, new carpet, and updated vinyl flooring. Step outside to enjoy the large deck, accessible from the primary bedroom—perfect for morning coffee or unwinding in the evening. A detached two-car garage is conveniently accessed from the alley, while the home maintains its stately presence facing Knoxville. Ideally located near schools, restaurants, and shopping, this home offers both charm and convenience in one inviting package.
Key facts
- Main level den
- Gas fireplace
- Custom built-ins
Tags
Neighborhood map
What this means for you Summary
Snapshot
- This is a 4-bed/1.0-bath single-family listed at $150k.
Deal economics
- At list price, monthly cash flow is $-236 ($-3k/yr) — negative.
- To cash-flow at today's rent, offer at most $108k (27.8% below list).
- To meet the 1% rule (rent ≥ 1% of price), the offer needs to be $106k (29.4% below list).
- Recommended offer: $106k (29.4% below list) — sets the bar for 1% rule.
- Cap rate 4.4% vs local median 5.6% in Peoria — below-typical yield; the buyer is paying a premium for something (appreciation thesis, condition, location) that the cap rate doesn't capture.
Location & tenants
- Location reads 73/100 on livability (#270 in IL) — a middle-class / working-renter tenant base. Strengths: commute A+, cost of living A+, housing A+; Watch: employment D+, schools F, crime F.
- Peoria SD 150 (urban): math 11% / reading 14% proficiency, ranked #554 of 620 in IL (top 89%) — low school quality limits family demand, transient renter base, plan for 1-2y turnover; 70% free/reduced lunch — lower-income household profile, screen leases tightly.
- Market conditions: 28 active listings in the ZIP; 4 comparable units currently listed for rent nearby; rentals at typical pace (median 21d on market — plan ~3-4 weeks tenant-placement turnaround); 73 units permitted in Peoria County in 2024 (0 in 5+ unit buildings).
Forward outlook
- Local home prices are declining (-3.0%/yr); year-one equity from $1k of loan paydown is wiped out by about $4k of value loss. Plan a longer hold.
- Peoria County population projected at -11% by 2050 — secular population decline; favor cash flow + early exit over multi-decade hold.
Negotiation context
- It's been on market 56 days — a 3% lower offer ($146k) is reasonable based on typical stale-listing flexibility.
- 2 sale attempts since 20y ago; this cycle's ask has dropped $15k (9%) from the opening price — seller is motivated, your offer sets the floor, not the list.
- Current owner paid $125k; 20% above their basis — modest negotiation headroom, anchor on the comps not their cost.
Risks & watch-outs
- Watch-outs: built in 1924 — expect roof / HVAC / electrical / plumbing capex.
Questions for the listing agent
- What do current leases actually rent for vs. the listed asking? Can we see a recent rent roll and the last 12 months of T-12 income?
- It's been on market 56 days. Have you received any prior offers? Is the seller open to a 29% concession, seller financing, or rate buy-down credit?
- Built in 1924 — when were the roof, HVAC, electrical panel, plumbing, and water heater last replaced?
- Is there a deadline driving the sale (1031 exchange, divorce, estate, relocation)? That informs how much negotiation room exists.
- Schools are F-rated, which usually means shorter tenancies and higher turnover. Who's the typical renter profile here, and what's been the actual vacancy rate?
- Crime grade is F in this area — have there been break-ins, vandalism, or insurance claims at this property in the last 3 years? What carrier currently insures it and at what premium?
- The area grade is low — what's the realistic commute time and amenity access for the typical tenant pool here? Any planned neighborhood developments (good or bad) we should know about?
- What's the average days-on-market for RENTAL listings here right now (not sales)? A rising rental-DOM trend means longer vacancies and softer asking-rent achievability than the comps imply.
- What's the recent tenant-quality profile in this submarket — average credit score on applications, eviction rate, late-payment / NSF rate, and stable-employment percentage? A property-management company in the area should have these aggregated.
- How much new for-sale + rental construction is in the pipeline within 1–3 miles? Heavy new supply typically softens prices + rents 12–24 months out; constrained supply supports both.
Investment metrics
- 1% rule
- 0.71% ✗
- Cap rate
- 4.41%
- Cash-on-cash
- -6.74%
- DSCR
- 0.70
- GRM
- 11.8
CMA / ARV
- ARV (median comp)
- $181,657
- List price
- $150,000
- Delta
- -17.43%
- Verdict
- UNDERPRICED
- Comps
- 20 within 1.0 mi
Show comp detail 12 sales within ~0.75 mi
| Address | Dist | Beds/Ba | Sqft | Sold | Price | $/sf | Match |
|---|---|---|---|---|---|---|---|
| 201 W Hanssler Pl | 0.22mi | 3/1.5 (-1) | 1,900 (-2%) | 4mo | $159,500 | $84 | 76 |
| 135 W Hanssler Pl | 0.21mi | 3/2.5 (-1) | 1,812 (-6%) | 3mo | $165,000 | $91 | 66 |
| 3502 N Peoria Ave | 0.43mi | 3/2.5 (-1) | 1,922 (-1%) | 2mo | $176,000 | $92 | 66 |
| 2716 N Bootz Ave | 0.38mi | 3/2.0 (-1) | 1,990 (+3%) | 4mo | $91,000 | $46 | 65 |
| 406 W Lawndale Ave | 0.39mi | 5/2.0 (+1) | 2,100 (+9%) | 1mo | $245,000 | $117 | 58 |
| 118 E Archer Ave | 0.50mi | 5/2.0 (+1) | 1,828 (-6%) | 1mo | $73,000 | $40 | 58 |
| 400 E Virginia Ave | 0.39mi | 4/1.0 | 1,676 (-13%) | 3mo | $117,500 | $70 | 57 |
| 2304 N Ellis Ave | 0.70mi | 3/1.0 (-1) | 1,907 (-1%) | 4mo | $76,000 | $40 | 56 |
| 904 E Seneca Pl | 0.63mi | 3/1.5 (-1) | 1,765 (-9%) | 2mo | $107,000 | $61 | 47 |
| 720 W Loucks Ave | 0.64mi | 4/1.5 | 1,711 (-12%) | 4mo | $119,000 | $70 | 46 |
| 301 E Thrush Ave | 0.61mi | 3/1.5 (-1) | 1,716 (-11%) | 2mo | $102,000 | $59 | 44 |
| 901 W Forrest Hill Ave | 0.70mi | 3/2.0 (-1) | 1,758 (-9%) | 2mo | $150,000 | $85 | 42 |
Match score weights: distance 35% · size 25% · config 20% · recency 20%. Top-matched comps best support the ARV.
Projected returns pro-forma
-3.0% appreciation · 3.0% rent growth · sell at horizon
- IRR
- -27.9%
- Equity multiple
- 0.06×
- Total profit
- $-39,293
- Equity at exit
- $22,365
- IRR
- -26.5%
- Equity multiple
- -0.27×
- Total profit
- $-53,406
- Equity at exit
- $12,969
Cash invested: $42,000 (down + closing). Projections, not guarantees.
Landlord ↔ Tenant lean methodology
- Overall (STATE)
- 43 Moderately Tenant-Leaning
- State Illinois
- 43 Moderately Tenant-Leaning · D+7
- County
- — inherits STATE
- City
- — inherits STATE
ZIP-level market 61602
- Home prices YoY
- -4.9%
- Active inventory
- 28
- Price-to-rent
- 11.8×
Monthly cashflow live
- Estimated rent
- $1,059 medium interval (Pro) →
- Mortgage (P&I)
- −$787
- Tax from tax record
- −$224 /mo · $2,684/yr
- Insurance
- −$62
- HOA
- −$0
- Vacancy / Maint / Mgmt
- −$222
- Net cashflow
- $-236
Break-even live
UW: 25.0% down · 7.5% · 30yr · 1.5% tax · 5.0% vac · 8.0% maint · 8.0% mgmt
Financing live
Cash to close
- Down payment
- $37,500
- Closing costs
- $4,500
- Reserves months
- —
- Total cash needed
- —
Loan-product check · same deal, 3 products live
Conventional
25% down · 7.5% · 30yr
- Down + closing
- —
- Monthly P&I
- —
- Monthly cashflow
- —
- DSCR
- —
- Eligible?
- —
Personal DTI + credit; lowest rate.
DSCR
20% down · 8.5% · 30yr
- Down + closing
- —
- Monthly P&I
- —
- Monthly cashflow
- —
- DSCR
- —
- Eligible?
- —
No personal income docs; deal must DSCR.
Hard money
10% down · 12.0% · 12mo
- Down + closing
- —
- Monthly P&I
- —
- Monthly cashflow
- —
- DSCR
- —
- Eligible?
- —
Short-term bridge; refi at stabilization.
Rent comps 4 comps
| Address | Beds | Baths | Sqft | Rent | $/sqft | DOM | Units | Dist |
|---|---|---|---|---|---|---|---|---|
| 308 E Archer Ave Peoria, IL | 3.0 | 1.0 | 1444 | $950 | $0.66 | 13d | 1 | 0.50mi |
| 913 W McClure Ave Peoria, IL | 3.0 | 1.0 | 1400 | $1,200 | $0.86 | 21d | 1 | 0.83mi |
| 1806 N Peoria Ave Peoria, IL | 4.0 | 1.5 | 1668 | $894 | $0.54 | 13d | 1 | 0.98mi |
| 501 W Columbia Ter Unit 3 Peoria, IL | 3.0 | 1.0 | 1500 | $1,400 | $0.93 | 43d | 1 | 1.41mi |
Listing history 17 events
-
2026-06-08status $150,000 Pending 56 DOM
-
2026-06-07days on market $150,000 Active 56 DOM
-
2026-06-03days on market $150,000 Active 52 DOM
-
2026-06-02days on market $150,000 Active 51 DOM
-
2026-06-01days on market $150,000 Active 50 DOM
-
2026-05-31days on market $150,000 Active 49 DOM
-
2026-05-30pricedays on market $150,000 Active 48 DOM
-
2026-04-12$165,000 Active 1501-char remark
Show marketing remark (1501 chars)
Charming 1.5-story brick home full of character and timeless appeal! This 3-bedroom, 1-bath home with a main-level den offers the perfect blend of historic charm and functional living. Built in 1924, you’ll appreciate the original details throughout—custom built-ins, rich trim work, high ceilings, and a thoughtful, flowing layout. Hardwood flooring spans much of the main level, leading you into a spacious living room anchored by a cozy gas fireplace and a formal dining room ideal for gatherings. A bright sunroom provides the perfect space to relax and enjoy natural light year-round. The kitchen is well-equipped with a refrigerator, range/oven, dishwasher, pantry, breakfast bar, and an abundance of cabinetry for storage and convenience. Upstairs, you’ll find a generously sized bedroom along with a versatile den—ideal for a home office, sitting room, or potential walk-in closet. The partially finished basement expands your living space with a recreation room, bonus room, storage area, and utility room, featuring fresh paint, new carpet, and updated vinyl flooring. Step outside to enjoy the large deck, accessible from the primary bedroom—perfect for morning coffee or unwinding in the evening. A detached two-car garage is conveniently accessed from the alley, while the home maintains its stately presence facing Knoxville. Ideally located near schools, restaurants, and shopping, this home offers both charm and convenience in one inviting package.
-
2021-08-06historical
-
2021-08-06historical
-
2021-08-06historical
-
2021-08-06historical
-
2021-08-06historical
-
2007-03-27soldstatus $125,000
-
2007-03-26soldstatus $125,000
-
2006-12-14$139,900
-
1998-06-01soldstatus $125,000
ⓘ Source: listings_history table (triggers on properties + properties_extension) + one-shot
backfill from property_details.listing_events for pre-trigger history.
Tax reassessment forecast IL · Partial reset (capped growth)
- Current annual tax
- $2,684 · $224/mo
- Projected year-2 tax
- $3,044 · $254/mo
- Expected delta
- +$361/yr (+$30/mo · 13.4%)
ⓘ Screening estimate from a state-policy table — verify with the county assessor before closing.
Climate risk First Street
- Flood 1/10 Low FEMA zone X · 0% chance over 30 yrs
- Wildfire 1/10 Low
- Heat 3/10 Moderate 7 d/yr ≥105°F today · 18 d/yr by 30 yrs out
- Wind 2/10 Low 100% chance of damaging wind over 30 yrs
- Air quality 3/10 Moderate 1 unhealthy d/yr today · 3 by 30 yrs out
Nearby sold comps map
Loading sold comps map…
Walkable amenities ~0.75 mi
Loading nearby amenities…
Taxation est. · year 1
- Rental income
- $12,712
- − Mortgage interest
- −$8,402
- − Property taxes
- −$2,684
- − Insurance
- −$750
- − Repairs & maintenance
- −$1,017
- − Management
- −$1,017
- − Depreciation
- −$4,364
- Taxable loss
- −$5,522
- Est. tax savings @ 24.0%
- +$1,325
- After-tax cash flow
- $-1,506/yr
For passive investors: Depreciation is non-cash, so a rental often shows a tax loss while cash-flowing — sheltering income. Rental losses are passive: they offset passive income freely, and up to $25,000/yr can offset ordinary (W-2) income if you actively participate and your MAGI is under $100k (phasing out to $0 by $150k); unused losses carry forward. On sale, claimed depreciation is recaptured at up to 25%, and gains may owe capital-gains tax (a 1031 exchange can defer both). Figures are a year-1 estimate at your 24.0% rate — not tax advice; consult a CPA.
Schools (NCES district)
- District
- Peoria SD 150
- NCES district ID
- 1731230
- Math proficiency
- 11% ▼ -5.00%
- Reading proficiency
- 14% ▼ -4.00%
- Median HH income
- $41,951
- Composite
- 10.92/100
- National rank
- #9751
- State rank
- #554 of 620 in IL
Livability — Peoria
- Score
- 73/100
- State rank
- #270
- US rank
- #5096
Category grades
Schools grade is shown separately in the Schools card above.
Census & demographics
- Census place
- Peoria, IL
- City population
- 114,670
- Population (ZIP)
- 977
Population outlook (Peoria County) Hauer SSP2
- Today (2025)
- 183,007 people
- By 2030
- 179,643 · -1.8%
- By 2040
- 171,782 · -6.1%
- By 2050
- 163,508 · -10.7%
- By 2075
- 140,178 · -23.4%
- By 2100
- 114,493 · -37.4%
Race, ethnicity, and origin ACS 2023
- Neighborhood character
- Diverse neighborhood (Simpson 0.59)
- Race & ethnicity
- White 60% Hispanic / Latino 17% Black 13% Two or more races 13% Asian 2%
- Hispanic origin (detail)
- Mexican 4% Dominican 3%
- Common ancestry
- Romanian 4% Slovak 4% Portuguese 3%
- Foreign-born
- 12% · Canada, Jamaica
- Languages at home
- 81% English-only · Spanish 16% French/Haitian/Cajun 2% Chinese 1%
Political lean MEDSL · Peoria
- 2024 margin
- Toss-up / Even · D 51.5% · R 46.9% · Other 1.6%
- 2008→2024 swing
- -9.2pp toward R · 2008: 13.9pp · 2024: 4.7pp
- All cycles
- 2024: D+4.7 2020: D+6.3 2016: D+2.8 2012: D+4.4 2008: D+13.9
Not yet ingested
- Civics
- —
Market trends
- HPI YoY
- ▼ -4.01%
- Current HPI
- 77.5295
- Rent YoY
- —
- Metro
- —
- State GDP YoY
- ▲ 1.59%
- F500 in state
- 60
Industry mix (Fortune 500 HQ in IL)
| Industry | F500 HQs | Revenue |
|---|---|---|
| Insurance | 4 | $201B |
|
||
| Consumer Goods | 4 | $87B |
|
||
| Industrial Machinery | 3 | $64B |
|
||
| Healthcare | 2 | $55B |
|
||
| Retail / Pharmacy | 1 | $148B |
|
||
| Agriculture / Food | 1 | $86B |
|
||
Price history
+32.0% since first listed10 events — show timeline
- 2026-04-12 Listed $165,000 RMLSA as Distributed by MLS Grid
- 2021-08-06 Listing Removed — RMLSA as Distributed by MLS Grid
- 2021-08-06 Listing Removed — RMLSA as Distributed by MLS Grid
- 2021-08-06 Listing Removed — RMLSA as Distributed by MLS Grid
- 2021-08-06 Listing Removed — RMLSA as Distributed by MLS Grid
- 2021-08-06 Listing Removed — RMLSA as Distributed by MLS Grid
- 2007-03-27 Sold (Public Records) $125,000 Public Records
- 2007-03-26 Sold (MLS) $125,000 RMLSA as Distributed by MLS Grid
- 2006-12-14 Listed $139,900 RMLSA as Distributed by MLS Grid
- 1998-06-01 Sold (Public Records) $125,000 Public Records
Property tax history
+1.2%/yrLatest (2024): $2,684 · +6.8% YoY. Source: county tax records.
Cash-flow waterfall
monthlySold comps — $/sqft
last 12 mo · ≤1 miLoading sold comps…