5003 Alberene Rd · Esmont, VA
Flood risk 1/10 · Minimal
- FEMA flood zone
- X (unshaded)
- Chance of flooding over 30 yrs
- 0.0%
- Est. flood insurance / yr
- $473 – $860
Fire risk 5/10 · Moderate
- Est. fire insurance / yr
- $666 – $1,236
Heat risk 6/10 · Moderate
- Hot days now (above 103°F)
- 7 days/yr
- Hot days in 30 yrs
- 18 days/yr
Wind risk 2/10 · Minimal
- Chance of severe wind over 30 yrs
- 2.0%
Air-quality risk 2/10 · Minimal
- Unhealthy air days now
- 0 days/yr
- Unhealthy air days in 30 yrs
- 1 days/yr
Risk factors via First Street. Map © Google.
Why this score? — see what drove the A- grade
The composite is a weighted blend of 9 inputs, each scored 0–100. Each bar is that input's sub-score; the figure is the points it added to the 100-point composite (weight × sub-score).
- Cash flow +30.0/30.0
- 1% rule +10.0/10.0
- DSCR +10.0/10.0
- Appreciation +10.0/10.0
- ARV discount +7.5/15.0
- Schools +6.2/10.0
- Livability +2.9/5.0
- Rent growth +2.5/5.0
- Condition / age +2.5/5.0
$110,000
🖨 Deal sheet 📄 Offer letter ✓ Due diligence
Listing remarks
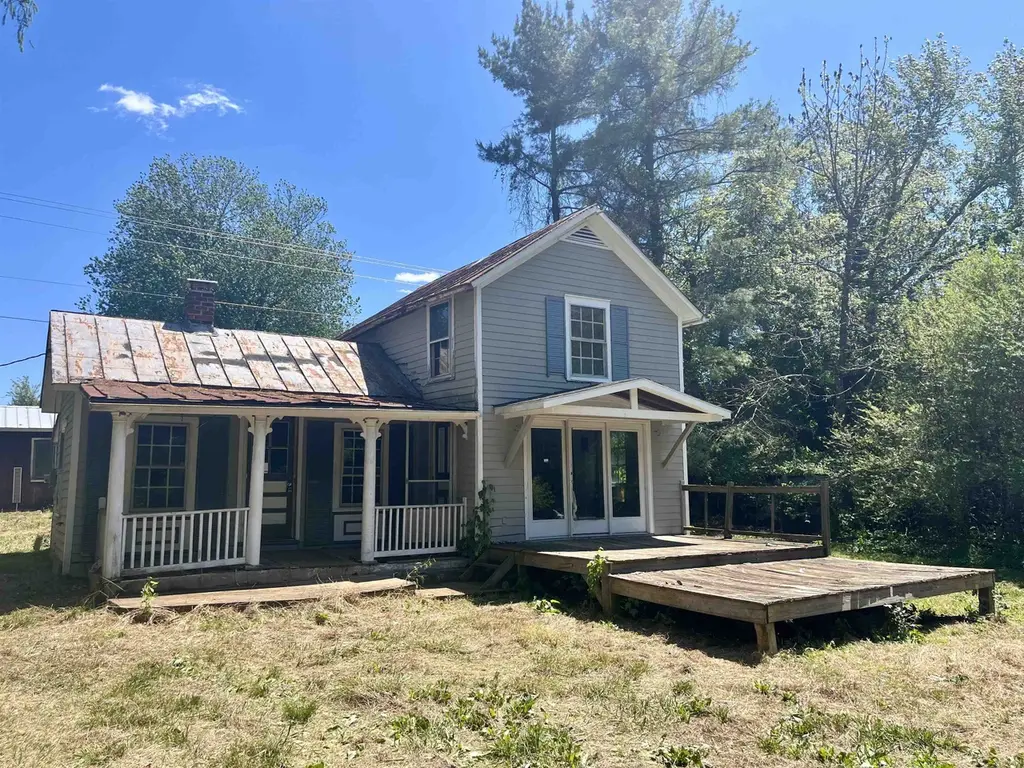
Calling all investors, handymen and DIYers this property has been cleaned out of personal property and is ready for someone with a vision to bring it back to life!! This two story farmhouse is situated on an attractive lot in peaceful North Garden, VA - less than half an hour from Charlottesville! Fix it up and sell it for a profit, make a great rental, or live out your dream of the peaceful county life! Will not qualify for a traditional mortgage. Cash, hard money, or renovation loans are some of the options that could be used to purchase this property. Call your favorite Realtor to tour today!
Key facts
- 0.38 acre lot
- Built 1754
- Listed 41 days
Property features AI
Exterior
- Utilities: Sewer: Septic tank; Water: Shared well; Other utilities
- Home design: Detached home; Two levels; 918 square feet above grade
- Construction: Built with stick‑built construction; Block foundation
- Exterior features: Lot of 0.38 acres; Septic tank; Shared well
Interior
- Bathrooms: 1 full bathroom
- Heating & cooling: Oil heating; Window air conditioning units
- Interior features: One full bathroom
Neighborhood map
What this means for you Summary
Snapshot
- This is a 3-bed/1.0-bath single-family listed at $110k.
Deal economics
- At list price, monthly cash flow is $1k ($12k/yr) — positive.
- The deal already cash-flows at list — no discount required.
- Meets the 1% rule at list price ($2k rent vs $110k).
- Recommended offer: $107k (3.0% below list) — sets the bar for market timing.
Location & tenants
- Location reads 58/100 on livability (#488 in VA) — a working-class tenant base; expect higher turnover. Strengths: cost of living A+, housing A+; Watch: employment D+, amenities F, commute F.
- Albemarle County Public School District (rural): math 66% / reading 77% proficiency, ranked #14 of 131 in VA (top 11%) — strong family-tenant draw, lease renewals of 3-5y typical.
- Zoned schools: Red Hill Elementary (math 44% / reading 54%, grade D, #742 of 1,108 statewide, top 70%, 201 students, 68% FRL); Leslie H. Walton Middle (math 77% / reading 77%, grade A, #38 of 342 statewide, top 11%, 339 students, 38% FRL); Monticello High (math 49% / reading 81%, grade B, #210 of 319 statewide, top 66%, 1,229 students, 56% FRL) — zoned schools average 54% FRL vs 23% district-wide (31 pts higher); higher-poverty schools than district average — tighter screening recommended.
- Market conditions: 21 active listings in the ZIP; 810 units permitted in Albemarle County in 2024 (188 in 5+ unit buildings).
Forward outlook
- In year one you build about $12k of equity ($761 loan paydown + $11k appreciation (10.0% local appreciation)).
- Albemarle County population projected at +24% by 2050 — long-run rental-demand tailwind backs the buy-and-hold thesis.
- At projected returns (10.0% appreciation + 3.0% rent growth), your $31k cash investment doubles in ~2 years — after that, you're playing with house money.
- By year 4, paydown + projected appreciation supports a ~$42k cash-out refi (75% LTV) — recoverable capital for the next deal without selling this one.
Negotiation context
- It's been on market 42 days — a 3% lower offer ($107k) is reasonable based on typical stale-listing flexibility.
Risks & watch-outs
- Watch-outs: built in 1754 — expect roof / HVAC / electrical / plumbing capex.
- Climate carrying-cost: moderate wildfire risk; extreme-heat days projected 7→18/yr by 2055 (HVAC capex compounding) — expect insurance premiums to compound above CPI over the hold.
Questions for the listing agent
- It's been on market 42 days. Have you received any prior offers? Is the seller open to a 3% concession, seller financing, or rate buy-down credit?
- Built in 1754 — when were the roof, HVAC, electrical panel, plumbing, and water heater last replaced?
- Is there a deadline driving the sale (1031 exchange, divorce, estate, relocation)? That informs how much negotiation room exists.
- Schools are F-rated, which usually means shorter tenancies and higher turnover. Who's the typical renter profile here, and what's been the actual vacancy rate?
- What's the average days-on-market for RENTAL listings here right now (not sales)? A rising rental-DOM trend means longer vacancies and softer asking-rent achievability than the comps imply.
- What's the recent tenant-quality profile in this submarket — average credit score on applications, eviction rate, late-payment / NSF rate, and stable-employment percentage? A property-management company in the area should have these aggregated.
- How much new for-sale + rental construction is in the pipeline within 1–3 miles? Heavy new supply typically softens prices + rents 12–24 months out; constrained supply supports both.
Investment metrics
- 1% rule
- 2.02% ✓
- Cap rate
- 17.31%
- Cash-on-cash
- 39.35%
- DSCR
- 2.75
- GRM
- 4.1
CMA / ARV
- ARV (median comp)
- $282,241
- List price
- $110,000
- Delta
- -61.03%
- Verdict
- UNDERPRICED
- Comps
- 1 within 2.0 mi
Projected returns pro-forma
10.0% appreciation · 3.0% rent growth · sell at horizon
- IRR
- 54.7%
- Equity multiple
- 5.03×
- Total profit
- $124,260
- Equity at exit
- $99,097
- IRR
- 48.2%
- Equity multiple
- 11.24×
- Total profit
- $315,389
- Equity at exit
- $213,706
Cash invested: $30,800 (down + closing). Projections, not guarantees.
Landlord ↔ Tenant lean methodology
- Overall (STATE)
- 55 Moderately Landlord-Leaning
- State Virginia
- 55 Moderately Landlord-Leaning · D+2
- County
- — inherits STATE
- City
- — inherits STATE
ZIP-level market 22959
- Home prices YoY
- 10.1%
- Active inventory
- 21
- Price-to-rent
- 4.1×
Monthly cashflow live
- Estimated rent
- $2,222 medium interval (Pro) →
- Mortgage (P&I)
- −$577
- Tax from tax record
- −$123 /mo · $1,475/yr
- Insurance
- −$46
- HOA
- −$0
- Vacancy / Maint / Mgmt
- −$467
- Net cashflow
- $1,010
Break-even live
UW: 25.0% down · 7.5% · 30yr · 1.5% tax · 5.0% vac · 8.0% maint · 8.0% mgmt
Financing live
Cash to close
- Down payment
- $27,500
- Closing costs
- $3,300
- Reserves months
- —
- Total cash needed
- —
Loan-product check · same deal, 3 products live
Conventional
25% down · 7.5% · 30yr
- Down + closing
- —
- Monthly P&I
- —
- Monthly cashflow
- —
- DSCR
- —
- Eligible?
- —
Personal DTI + credit; lowest rate.
DSCR
20% down · 8.5% · 30yr
- Down + closing
- —
- Monthly P&I
- —
- Monthly cashflow
- —
- DSCR
- —
- Eligible?
- —
No personal income docs; deal must DSCR.
Hard money
10% down · 12.0% · 12mo
- Down + closing
- —
- Monthly P&I
- —
- Monthly cashflow
- —
- DSCR
- —
- Eligible?
- —
Short-term bridge; refi at stabilization.
Listing history 17 events
-
2026-06-19days on market $110,000 Active 42 DOM
-
2026-06-18days on market $110,000 Active 41 DOM
-
2026-06-17days on market $110,000 Active 40 DOM
-
2026-06-16days on market $110,000 Active 39 DOM
-
2026-06-15days on market $110,000 Active 38 DOM
-
2026-06-14days on market $110,000 Active 36 DOM
-
2026-06-13days on market $110,000 Active 35 DOM
-
2026-06-10days on market $110,000 Active 33 DOM
-
2026-06-09days on market $110,000 Active 32 DOM
-
2026-06-08days on market $110,000 Active 31 DOM
-
2026-06-07days on market $110,000 Active 30 DOM
-
2026-06-03days on market $110,000 Active 26 DOM
-
2026-06-02days on market $110,000 Active 25 DOM
-
2026-06-01days on market $110,000 Active 24 DOM
-
2026-05-31days on market $110,000 Active 23 DOM
-
2026-05-30pricedays on market $110,000 Active 22 DOM
-
2026-05-08$115,000 Active 602-char remark
ⓘ Source: listings_history table (triggers on properties + properties_extension) + one-shot
backfill from property_details.listing_events for pre-trigger history.
Tax reassessment forecast VA · Resets to sale price
- Current annual tax
- $1,475 · $123/mo
- Projected year-2 tax
- $1,475 · $123/mo
- Expected delta
- $0/yr ($0/mo · 0.0%)
ⓘ Screening estimate from a state-policy table — verify with the county assessor before closing.
Climate risk First Street
- Flood 1/10 Low FEMA zone X (unshaded) · 0% chance over 30 yrs
- Wildfire 5/10 Major
- Heat 6/10 Major 7 d/yr ≥103°F today · 18 d/yr by 30 yrs out
- Wind 2/10 Low 2% chance of damaging wind over 30 yrs
- Air quality 2/10 Low 0 unhealthy d/yr today · 1 by 30 yrs out
Nearby sold comps map
Loading sold comps map…
Walkable amenities ~0.75 mi
Loading nearby amenities…
Taxation est. · year 1
- Rental income
- $26,667
- − Mortgage interest
- −$6,162
- − Property taxes
- −$1,475
- − Insurance
- −$550
- − Repairs & maintenance
- −$2,133
- − Management
- −$2,133
- − Depreciation
- −$3,200
- Taxable income
- $11,014
- Est. tax owed @ 24.0%
- −$2,643
- After-tax cash flow
- $9,477/yr
For passive investors: Depreciation is non-cash, so a rental often shows a tax loss while cash-flowing — sheltering income. Rental losses are passive: they offset passive income freely, and up to $25,000/yr can offset ordinary (W-2) income if you actively participate and your MAGI is under $100k (phasing out to $0 by $150k); unused losses carry forward. On sale, claimed depreciation is recaptured at up to 25%, and gains may owe capital-gains tax (a 1031 exchange can defer both). Figures are a year-1 estimate at your 24.0% rate — not tax advice; consult a CPA.
Schools (NCES district)
- District
- Albemarle County Public School District
- NCES district ID
- 5100090
- Math proficiency
- 66% ▼ -16.00%
- Reading proficiency
- 77% ▼ -2.00%
- Median HH income
- $67,851
- Composite
- 62.28/100
- National rank
- #698
- State rank
- #14 of 131 in VA
Livability — Esmont
- Score
- 58/100
- State rank
- #488
- US rank
- #21526
Category grades
Schools grade is shown separately in the Schools card above.
Census & demographics
- Population (ZIP)
- 1,802
Population outlook (Albemarle County) Hauer SSP2
- Today (2025)
- 119,403 people
- By 2030
- 125,829 · +5.4%
- By 2040
- 137,705 · +15.3%
- By 2050
- 148,058 · +24.0%
- By 2075
- 172,223 · +44.2%
- By 2100
- 185,628 · +55.5%
Race, ethnicity, and origin ACS 2023
- Neighborhood character
- Predominantly White (84%)
- Race & ethnicity
- White 84% Black 12% Hispanic / Latino 3% Two or more races 2% Native American 2%
- Common ancestry
- Scotch-Irish 2% Romanian 2% Serbian 2%
- Foreign-born
- 2% · China
- Languages at home
- 95% English-only · Spanish 5%
Political lean MEDSL · Albemarle
- 2024 margin
- Solid D (+34.1) · D 66.3% · R 32.2% · Other 1.4%
- 2008→2024 swing
- +16.1pp toward D · 2008: 18.0pp · 2024: 34.1pp
- All cycles
- 2024: D+34.1 2020: D+33.5 2016: D+25.1 2012: D+12.0 2008: D+18.0
Not yet ingested
- Civics
- —
Market trends
- HPI YoY
- ▲ 25.98%
- Current HPI
- 283.4912
- Rent YoY
- —
- Metro
- —
- State GDP YoY
- ▲ 2.40%
- F500 in state
- 50
Industry mix (Fortune 500 HQ in VA)
| Industry | F500 HQs | Revenue |
|---|---|---|
| Aerospace / Defense | 4 | $236B |
|
||
| Technology / Defense | 3 | $32B |
|
||
| Financial Services | 2 | $176B |
|
||
| Utilities | 2 | $27B |
|
||
| Insurance | 2 | $25B |
|
||
| Technology | 2 | $15B |
|
||
Price history
-4.3% since first listed2 events — show timeline
- 2026-05-29 Price Changed $110,000 HRAR
- 2026-05-08 Listed $115,000 HRAR
Property tax history
+5.9%/yrLatest (2026): $1,475 · +14.5% YoY. Source: county tax records.
Cash-flow waterfall
monthlySold comps — $/sqft
last 12 mo · ≤1 miLoading sold comps…