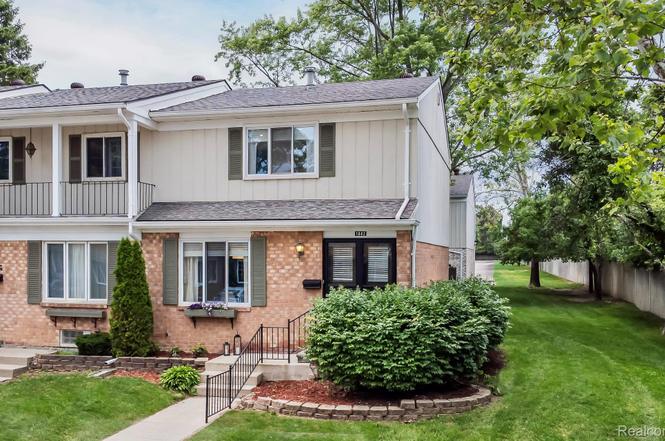
1882 Wickham St · Royal Oak, MI
Flood risk 1/10 · Minimal
- FEMA flood zone
- X (unshaded)
- Chance of flooding over 30 yrs
- 0.0%
- Est. flood insurance / yr
- $473 – $860
Fire risk 1/10 · Minimal
- Est. fire insurance / yr
- $784 – $1,456
Heat risk 3/10 · Minor
- Hot days now (above 97°F)
- 7 days/yr
- Hot days in 30 yrs
- 15 days/yr
Wind risk 2/10 · Minimal
- Chance of severe wind over 30 yrs
- —
Air-quality risk 4/10 · Minor
- Unhealthy air days now
- 3 days/yr
- Unhealthy air days in 30 yrs
- 6 days/yr
Risk factors via First Street. Map © Google.
Why this score? — see what drove the D+ grade
The composite is a weighted blend of 9 inputs, each scored 0–100. Each bar is that input's sub-score; the figure is the points it added to the 100-point composite (weight × sub-score).
- Cash flow +13.3/30.0
- ARV discount +7.5/15.0
- 1% rule +6.6/10.0
- Appreciation +5.0/10.0
- Schools +4.4/10.0
- Livability +4.2/5.0
- DSCR +4.0/10.0
- Rent growth +2.5/5.0
- Condition / age +2.5/5.0
$230,000
🖨 Deal sheet 📄 Offer letter ✓ Due diligence
Listing remarks MLS
Bright, updated end-unit townhouse in Royal Oak’s desirable Coventry Park. The open main level features new LVP flooring, fresh interior paint, a gas fireplace, and a door wall leading to a fenced, spacious, private brick paver patio. Updated baths, new carpet upstairs, generous bedroom sizes, excellent closet space, and a professionally finished lower level provide flexible living space. Recent updates include a new roof and newer water heater. Coventry Park features a pool, clubhouse, library, common park area, and an active community atmosphere with food truck nights, Bunco, and seasonal gatherings. HOA includes gas and water. * * Taxes are non-homestead * * BATVAI
Key facts
- Updated baths
- $438 HOA
- 2 parking spots
Tags
Property features AI
Finance
- Other: Pets allowed (cats and dogs) with limits; Paved street access; Directions: Wickham West off of Crooks, take the second right; 1882 is at the end on the left
- HOA & community: Monthly association fee of $438; Association fee covers gas, water/sewer, trash removal, lawn maintenance, snow removal, and clubhouse; Community amenities include clubhouse, private entry, and laundry facility; Association phone available
Exterior
- Parking: 2 parking spaces
- Utilities: Public water; Natural gas
- Home design: Condominium; 2-story structure; Built in 1971
- Construction: Brick and wood construction; Basement foundation
- Exterior features: Fenced yard; Inground pool; Patio; Built-in BBQ/grill
Interior
- Kitchen: Kitchen at entry level (approx. 11 x 8); Range/oven; Microwave; Dishwasher; Refrigerator; Disposal
- Bedrooms: Two bedrooms located on the second floor (approx. 17 x 12 and 15 x 10)
- Bathrooms: Two total bathrooms (1 full, 1 lavatory); Main bath located on second floor; lavatory at entry
- Heating & cooling: Forced air heating; Central air conditioning; Ceiling fans
- Interior features: DSL available; Gas fireplace in living room; Finished basement
- Laundry & utility: Washer and dryer included; Laundry facility in association
Neighborhood map
What this means for you Summary
Snapshot
- This is a 2-bed/1.5-bath condo listed at $230k.
Deal economics
- At list price, monthly cash flow is $-1 ($-10/yr) — negative.
- To cash-flow at today's rent, offer at most $230k (0.1% below list).
- Meets the 1% rule at list price ($3k rent vs $230k).
- Recommended offer: $230k (0.1% below list) — sets the bar for cash-flow.
- Cap rate 6.3% vs local median 3.8% in Royal Oak — top-decile yield for the area; either an underpriced asset or a hidden risk that comps aren't pricing in. Stress-test before assuming the spread holds.
Location & tenants
- Location reads 83/100 on livability (#50 in MI, #1,020 nationally) — a professional / high-income tenant draw. Strengths: crime A+, commute A+, employment A+; Watch: amenities D+.
- Royal Oak Schools (suburban): math 41% / reading 59% proficiency, ranked #89 of 540 in MI (top 16%) — acceptable for families but not a draw, mixed tenant base, ~2y average lease; only 20% free/reduced lunch — higher-income household profile.
- Market conditions: 1 active listings in the ZIP; 16 comparable units currently listed for rent nearby; rentals leasing fast (median 3d on market — plan ~1-2 weeks tenant-placement turnaround); 2,614 units permitted in Oakland County in 2024 (721 in 5+ unit buildings).
Forward outlook
- In year one you build about $8k of equity ($2k loan paydown + $7k appreciation (3.0% local appreciation)).
- Oakland County population projected at +10% by 2050 — modest demand growth; plan on rents tracking national, not racing it.
- At projected returns (3.0% appreciation + 3.0% rent growth), your $64k cash investment doubles in ~7 years — after that, you're playing with house money.
- By year 5, paydown + projected appreciation supports a ~$37k cash-out refi (75% LTV) — recoverable capital for the next deal without selling this one.
Negotiation context
- Only 1 days on market — expect competitive offers; lowballing is unlikely to land.
- 14 sale attempts since 22y ago with the ask held roughly flat each time — persistent listings suggest the price (not the market) is what's stuck; bring a comps-based counter.
- Current owner paid $155k; 48% above their basis — modest negotiation headroom, anchor on the comps not their cost.
Questions for the listing agent
- What do current leases actually rent for vs. the listed asking? Can we see a recent rent roll and the last 12 months of T-12 income?
- Built in 1971 — when were the roof, HVAC, electrical panel, plumbing, and water heater last replaced?
- What does the HOA fee cover, when was the last increase, and are there any pending special assessments or reserve-fund shortfalls?
- Any open or pending special assessments — roof, HVAC, plumbing, elevator, façade? What's the per-unit balance and payoff schedule, and is the seller paying it off at close or rolling it to the buyer?
- Is there a deadline driving the sale (1031 exchange, divorce, estate, relocation)? That informs how much negotiation room exists.
- Schools are B-rated — typically a magnet for longer-tenancy family renters. What's the average tenant stay here, and is there a school-zone premium baked into asking?
- The area grade is low — what's the realistic commute time and amenity access for the typical tenant pool here? Any planned neighborhood developments (good or bad) we should know about?
- What's the average days-on-market for RENTAL listings here right now (not sales)? A rising rental-DOM trend means longer vacancies and softer asking-rent achievability than the comps imply.
- What's the recent tenant-quality profile in this submarket — average credit score on applications, eviction rate, late-payment / NSF rate, and stable-employment percentage? A property-management company in the area should have these aggregated.
- How much new apartment / multifamily construction is in the pipeline within 1–3 miles? Heavy new supply (>2% of stock underway) typically softens rents 12–24 months out; light construction supports rent growth.
Investment metrics
- 1% rule
- 1.16% ✓
- Cap rate
- 6.29%
- Cash-on-cash
- -0.02%
- DSCR
- 1.00
- GRM
- 7.2
CMA / ARV
No comps found within radius.
Projected returns pro-forma
3.0% appreciation · 3.0% rent growth · sell at horizon
- IRR
- 7.6%
- Equity multiple
- 1.44×
- Total profit
- $28,015
- Equity at exit
- $103,418
- IRR
- 10.3%
- Equity multiple
- 2.56×
- Total profit
- $100,338
- Equity at exit
- $159,379
Cash invested: $64,400 (down + closing). Projections, not guarantees.
Landlord ↔ Tenant lean methodology
- Overall (STATE)
- 62 Landlord-Friendly
- State Michigan
- 62 Landlord-Friendly · EVEN
- County
- — inherits STATE
- City
- — inherits STATE
ZIP-level market 48073 1162
- Active inventory
- 1
- Price-to-rent
- 7.2×
Monthly cashflow live
- Estimated rent
- $2,672 high interval (Pro) →
- Mortgage (P&I)
- −$1,206
- Tax from tax record
- −$372 /mo · $4,462/yr
- Insurance
- −$96
- HOA
- −$438
- Vacancy / Maint / Mgmt
- −$561
- Net cashflow
- $-1
Break-even live
UW: 25.0% down · 7.5% · 30yr · 1.5% tax · 5.0% vac · 8.0% maint · 8.0% mgmt
Financing live
Cash to close
- Down payment
- $57,500
- Closing costs
- $6,900
- Reserves months
- —
- Total cash needed
- —
Loan-product check · same deal, 3 products live
Conventional
25% down · 7.5% · 30yr
- Down + closing
- —
- Monthly P&I
- —
- Monthly cashflow
- —
- DSCR
- —
- Eligible?
- —
Personal DTI + credit; lowest rate.
DSCR
20% down · 8.5% · 30yr
- Down + closing
- —
- Monthly P&I
- —
- Monthly cashflow
- —
- DSCR
- —
- Eligible?
- —
No personal income docs; deal must DSCR.
Hard money
10% down · 12.0% · 12mo
- Down + closing
- —
- Monthly P&I
- —
- Monthly cashflow
- —
- DSCR
- —
- Eligible?
- —
Short-term bridge; refi at stabilization.
Rent comps 16 comps
| Address | Beds | Baths | Sqft | Rent | $/sqft | DOM | Units | Dist |
|---|---|---|---|---|---|---|---|---|
| 1976 Ridge Ct Royal Oak, MI | 2.0 | 1.5 | 1929 | $2,500 | $1.30 | 1d | 1 | 0.22mi |
| 4014 Durham Rd Royal Oak, MI | 3.0 | 1.0 | 1827 | $2,400 | $1.31 | 2d | 1 | 1.08mi |
| 516 N Main St Clawson, MI | 2.0 | 2.0 | 1515 | $2,986 | $1.97 | 1d | 1 | 1.13mi |
| 3054 Camden Dr Unit 3054 Troy, MI | 2.0 | 2.5 | 1400 | $2,300 | $1.64 | 24d | 1 | 1.14mi |
| 1911 Golfview Dr Troy, MI | 1.0–3.0 | 1.0–2.0 | 1300 | $1,942 | $1.49 | 1d | 19 | 1.17mi |
| 3248 Newbury Pl #11 Troy, MI | 2.0 | 2.5 | 1398 | $2,250 | $1.61 | 24d | 1 | 1.21mi |
| 1300 Livernois Rd Troy, MI | 1.0–3.0 | 1.0–2.0 | 1000 | $2,326 | $2.33 | 1d | 18 | 1.21mi |
| 3257 Newbury Pl Unit 20 Troy, MI | 2.0 | 3.0 | 1480 | $2,450 | $1.66 | 20d | 1 | 1.21mi |
| 3202 Camden Dr Troy, MI | 2.0 | 2.5 | 1959 | $2,300 | $1.17 | 2d | 1 | 1.22mi |
| 3286 Camden Dr Troy, MI | 2.0 | 2.5 | 1550 | $2,450 | $1.58 | 23d | 1 | 1.27mi |
| 2751 Melcombe Cir Troy, MI | 1.0–3.0 | 1.0–2.5 | 1687 | $2,644 | $1.57 | 2d | 30 | 1.28mi |
| 2690 Crooks Rd Troy, MI | 1.0–2.0 | 1.0–2.0 | 1259 | $2,635 | $2.09 | 1d | 1 | 1.30mi |
| 2845 Summers Pl Troy, MI | 3.0 | 2.5 | 1665 | $3,600 | $2.16 | 43d | 1 | 1.39mi |
| 401 S Eton St Birmingham, MI | 2.0–4.0 | 2.5 | 2277 | $5,500 | $2.42 | 5d | 2 | 1.44mi |
| 2194 Dorchester Rd Birmingham, MI | 3.0 | 2.0 | 1909 | $3,500 | $1.83 | 24d | 1 | 1.46mi |
| 1997 Villa Rd Birmingham, MI | 1.0–3.0 | 1.0–2.5 | 1050 | $1,975 | $1.88 | 1d | 10 | 1.49mi |
HOA detail condo
- Monthly dues
- $438 · $5,256/yr
- Likely covers
- watergaspool
- Assessments
- None detected in remarks — confirm with the listing agent.
Listing history 2 events
-
2026-06-19remarks 681-char remark
Show marketing remark (687 chars)
Bright, updated end-unit townhouse in Royal Oak’s desirable Coventry Park. The open main level features new LVP flooring, fresh interior paint, a gas fireplace, and a door wall leading to a fenced, spacious, private brick paver patio. Updated baths, new carpet upstairs, generous bedroom sizes, excellent closet space, and a professionally finished lower level provide flexible living space. Recent updates include a new roof and newer water heater. Coventry Park features a pool, clubhouse, library, common park area, and an active community atmosphere with food truck nights, Bunco, and seasonal gatherings. HOA includes gas and water. * * Taxes are non-homestead * * BATVAI
-
2026-06-19$230,000 Coming Soon 1 DOM
Show marketing remark (687 chars)
Bright, updated end-unit townhouse in Royal Oak’s desirable Coventry Park. The open main level features new LVP flooring, fresh interior paint, a gas fireplace, and a door wall leading to a fenced, spacious, private brick paver patio. Updated baths, new carpet upstairs, generous bedroom sizes, excellent closet space, and a professionally finished lower level provide flexible living space. Recent updates include a new roof and newer water heater. Coventry Park features a pool, clubhouse, library, common park area, and an active community atmosphere with food truck nights, Bunco, and seasonal gatherings. HOA includes gas and water. * * Taxes are non-homestead * * BATVAI
ⓘ Source: listings_history table (triggers on properties + properties_extension) + one-shot
backfill from property_details.listing_events for pre-trigger history.
Tax reassessment forecast MI · Partial reset (capped growth)
- Current annual tax
- $4,462 · $372/mo
- Projected year-2 tax
- $4,462 · $372/mo
- Expected delta
- $0/yr ($0/mo · 0.0%)
ⓘ Screening estimate from a state-policy table — verify with the county assessor before closing.
Climate risk First Street
- Flood 1/10 Low FEMA zone X (unshaded) · 0% chance over 30 yrs
- Wildfire 1/10 Low
- Heat 3/10 Moderate 7 d/yr ≥97°F today · 15 d/yr by 30 yrs out
- Wind 2/10 Low
- Air quality 4/10 Moderate 3 unhealthy d/yr today · 6 by 30 yrs out
Nearby sold comps map
Loading sold comps map…
Walkable amenities ~0.75 mi
Loading nearby amenities…
Taxation est. · year 1
- Rental income
- $32,066
- − Mortgage interest
- −$12,884
- − Property taxes
- −$4,462
- − Insurance
- −$1,150
- − Repairs & maintenance
- −$2,565
- − Management
- −$2,565
- − HOA
- −$5,256
- − Depreciation
- −$6,691
- Taxable loss
- −$3,507
- Est. tax savings @ 24.0%
- +$842
- After-tax cash flow
- $832/yr
For passive investors: Depreciation is non-cash, so a rental often shows a tax loss while cash-flowing — sheltering income. Rental losses are passive: they offset passive income freely, and up to $25,000/yr can offset ordinary (W-2) income if you actively participate and your MAGI is under $100k (phasing out to $0 by $150k); unused losses carry forward. On sale, claimed depreciation is recaptured at up to 25%, and gains may owe capital-gains tax (a 1031 exchange can defer both). Figures are a year-1 estimate at your 24.0% rate — not tax advice; consult a CPA.
Schools (NCES district)
- District
- Royal Oak Schools
- NCES district ID
- 2630300
- Math proficiency
- 41% ▼ -10.00%
- Reading proficiency
- 59% ▼ -3.00%
- Median HH income
- $65,456
- Composite
- 44.19/100
- National rank
- #2853
- State rank
- #89 of 540 in MI
Livability — Royal Oak
- Score
- 83/100
- State rank
- #50
- US rank
- #1020
Category grades
Schools grade is shown separately in the Schools card above.
Census & demographics
- Census place
- Royal Oak, MI
Population outlook (Oakland County) Hauer SSP2
- Today (2025)
- 1,335,747 people
- By 2030
- 1,375,100 · +2.9%
- By 2040
- 1,435,385 · +7.5%
- By 2050
- 1,469,250 · +10.0%
- By 2075
- 1,531,946 · +14.7%
- By 2100
- 1,450,485 · +8.6%
Not yet ingested
- Political lean
- —
- Race & ethnicity
- —
- Common origin
- —
- Civics
- —
Market trends
- HPI YoY
- —
- Current HPI
- —
- Rent YoY
- —
- Metro
- —
- State GDP YoY
- ▲ 1.37%
- F500 in state
- 28
Industry mix (Fortune 500 HQ in MI)
| Industry | F500 HQs | Revenue |
|---|---|---|
| Automotive Parts | 3 | $48B |
|
||
| Automotive | 2 | $372B |
|
||
| Chemicals | 1 | $45B |
|
||
| Automotive Retail | 1 | $29B |
|
||
| Healthcare / Medical Devices | 1 | $23B |
|
||
| Automotive Technology | 1 | $20B |
|
||
Price history
+230.9% since first listed40 events — show timeline
- 2026-06-19 Listed $230,000 MiRealSource-MiMLS
- 2026-06-19 Listed $230,000 REALCOMP
- 2026-06-19 Coming Soon $230,000 MiRealSource-MiMLS
- 2025-05-16 Rental Removed $1,900 REALSOURCE
- 2025-05-09 Listed for Rent $1,900 REALSOURCE
- 2025-01-15 Rental Removed $1,900 REALCOMP
- 2024-12-18 Listed for Rent $1,900 REALCOMP
- 2024-12-18 Rental Removed $1,900 REALCOMP
- 2024-12-07 Listed for Rent $1,900 REALCOMP
- 2018-01-30 Sold (Public Records) $155,000 Public Records
- 2018-01-30 Sold (MLS) $155,000 MiRealSource-MiMLS
- 2018-01-30 Sold (MLS) $155,000 REALCOMP
- 2018-01-08 Pending — MiRealSource-MiMLS
- 2018-01-08 Pending — REALCOMP
- 2018-01-04 Listed $159,900 MiRealSource-MiMLS
- 2018-01-04 Listed $159,900 REALCOMP
- 2017-06-14 Sold (Public Records) $146,000 Public Records
- 2017-06-06 Sold (MLS) $146,000 MiRealSource-MiMLS
- 2017-06-06 Sold (MLS) $146,000 REALCOMP
- 2017-05-16 Pending — MiRealSource-MiMLS
- 2017-05-16 Pending — REALCOMP
- 2017-04-27 Listed $145,900 MiRealSource-MiMLS
- 2017-04-27 Listed $145,900 REALCOMP
- 2009-01-08 Listing Removed — MiRealSource-MiMLS
- 2008-01-27 Listing Removed — MiRealSource-MiMLS
- 2008-01-27 Listed $139,900 MiRealSource-MiMLS
- 2007-10-02 Listing Removed — MiRealSource-MiMLS
- 2007-09-28 Listed $147,900 MiRealSource-MiMLS
- 2007-09-26 Listing Removed — REALCOMP
- 2007-07-09 Listed $149,900 REALCOMP
- 2007-07-06 Listed $149,900 MiRealSource-MiMLS
- 2005-08-31 Sold (Public Records) $154,000 Public Records
- 2004-06-09 Sold (Public Records) $148,900 Public Records
- 2004-04-23 Sold (MLS) $148,900 MiRealSource-MiMLS
- 2004-04-02 Listed $154,700 MiRealSource-MiMLS
- 2004-04-02 Listing Removed — MiRealSource-MiMLS
- 1998-05-01 Sold (Public Records) $124,000 Public Records
- 1991-06-10 Sold (Public Records) $75,000 Public Records
- 1987-05-01 Sold (Public Records) $77,900 Public Records
- 1979-06-01 Sold (Public Records) $69,500 Public Records
Property tax history
+7.7%/yrLatest (2025): $4,462 · +2.7% YoY. Source: county tax records.
Cash-flow waterfall
monthlySold comps — $/sqft
last 12 mo · ≤1 miLoading sold comps…