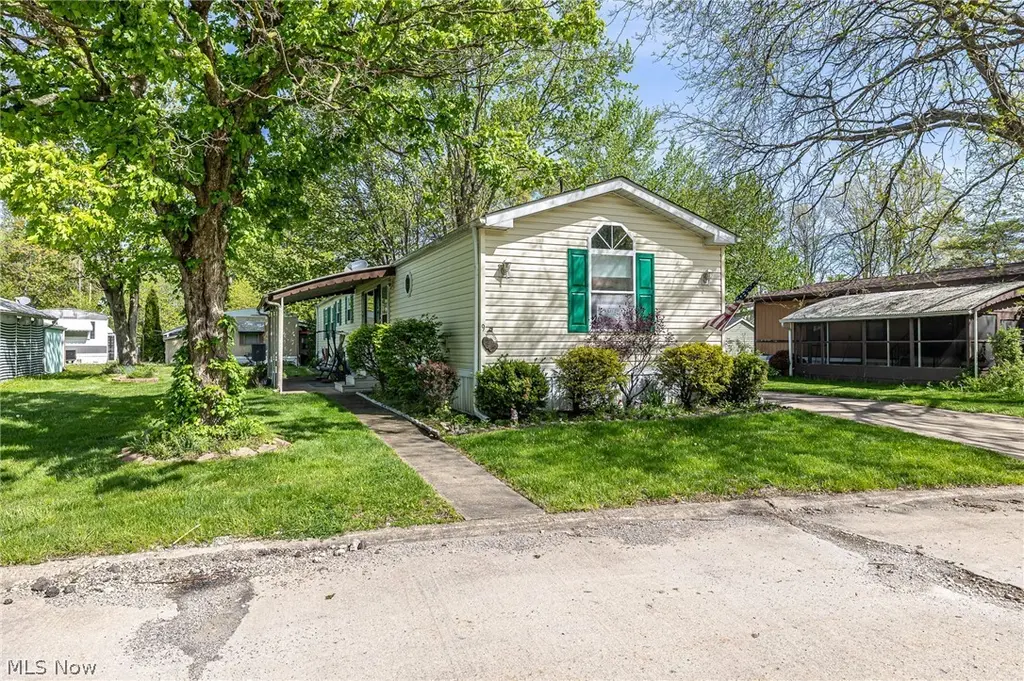
9 Overland Dr · Olmsted Falls, OH
Flood risk 9/10 · Severe
- FEMA flood zone
- X (unshaded)
- Chance of flooding over 30 yrs
- 0.99%
- Est. flood insurance / yr
- $507 – $1,088
Fire risk 1/10 · Minimal
- Est. fire insurance / yr
- $713 – $1,323
Heat risk 2/10 · Minimal
- Hot days now (above 96°F)
- 7 days/yr
- Hot days in 30 yrs
- 15 days/yr
Wind risk 1/10 · Minimal
- Chance of severe wind over 30 yrs
- —
Air-quality risk 2/10 · Minimal
- Unhealthy air days now
- 1 days/yr
- Unhealthy air days in 30 yrs
- 3 days/yr
Risk factors via First Street. Map © Google.
Why this score? — see what drove the B grade
The composite is a weighted blend of 9 inputs, each scored 0–100. Each bar is that input's sub-score; the figure is the points it added to the 100-point composite (weight × sub-score).
- Cash flow +30.0/30.0
- 1% rule +10.0/10.0
- DSCR +10.0/10.0
- ARV discount +7.5/15.0
- Schools +6.1/10.0
- Livability +3.7/5.0
- Rent growth +2.5/5.0
- Condition / age +2.2/5.0
- Appreciation +0.0/10.0
$59,900
🖨 Deal sheet 📄 Offer letter ✓ Due diligence
Listing remarks
COLUMBIA Park IS A 55 AND OLDER CONCEPT OF LIVING and is Ohio’s Premier Adult Land Lease Community! Amenities Include: Gated entrance! On site Shopping Plaza! On site Management! Walking Path/Dog Walking Path! Shuffleboard! Bocce Ball! Library! Crafts, and Social Hall! WELCOME HOME to this 2000 Skyline Singlewide Manufactured Home offering 1216 Sqft. This home features 3 Bedrooms, 2 Full Baths, Living Room and an Eat-In Kitchen, with a very open floor plan. Bedrooms are on opposite ends of the home with 2 Bedrooms at the front of the home and the Primary Suite with an awesome walk in closet in the rear of the home where it's nice and quiet. This home has only had one owner and is loo
Key facts
- Dog walking path
- Bocce ball
- Gated entrance
Tags
Property features AI
Finance
- Other: Pets allowed with restrictions (breed restrictions, cats OK, dogs OK, number limit)
- Financial info: Has land lease with monthly land lease payment
- HOA & community: Association management included in association fee; Park and street lights in the community; Senior community
Exterior
- Parking: Covered parking (carport); 2-car carport
- Security: Smoke detector(s)
- Utilities: Public water; Private sewer
- Home design: Single-story home; Vinyl siding exterior; Asphalt roof
- Construction: Vinyl siding construction; Asphalt roof; Owner-reported year built
- Exterior features: Patio; Shed(s)
Interior
- Kitchen: Dishwasher; Range; Disposal; Refrigerator
- Bedrooms: 3 main-level bedrooms
- Bathrooms: 2 full bathrooms (both on the main level)
- Heating & cooling: Heat pump and electric heating; Central air conditioning
- Interior features: Smoke detector(s)
- Laundry & utility: In-unit washer and dryer
Neighborhood map
What this means for you Summary
Snapshot
- This is a 3-bed/2.0-bath single-family listed at $60k. Condition is rated fair.
Deal economics
- At list price, monthly cash flow is $962 ($12k/yr) — positive.
- The deal already cash-flows at list — no discount required.
- Meets the 1% rule at list price ($2k rent vs $60k).
- Recommended offer: $58k (3.0% below list) — sets the bar for market timing.
- Cap rate 26.9% vs local median 4.2% in Olmsted Falls — top-decile yield for the area; either an underpriced asset or a hidden risk that comps aren't pricing in. Stress-test before assuming the spread holds.
Location & tenants
- Location reads 73/100 on livability (#343 in OH) — a middle-class / working-renter tenant base. Strengths: schools A+, crime A+, employment A+; Watch: amenities F, commute F, health & safety F.
- Olmsted Falls City (suburban): math 70% / reading 70% proficiency, ranked #134 of 656 in OH (top 20%) — strong family-tenant draw, lease renewals of 3-5y typical; only 13% free/reduced lunch — higher-income household profile.
- Market conditions: 183 active listings in the ZIP; 4 comparable units currently listed for rent nearby; rentals leasing fast (median 3d on market — plan ~1-2 weeks tenant-placement turnaround); solid renter incomes; 1,441 units permitted in Cuyahoga County in 2024 (700 in 5+ unit buildings).
Forward outlook
- Local home prices are declining (-3.0%/yr); year-one equity from $414 of loan paydown is wiped out by about $2k of value loss. Plan a longer hold.
- Cuyahoga County population projected to shrink 8% by 2050 — rents likely to lag national; underwrite the cash flow, not the appreciation.
- At projected returns (-3.0% appreciation + 3.0% rent growth), your $17k cash investment doubles in ~2 years — after that, you're playing with house money.
Negotiation context
- It's been on market 51 days — a 3% lower offer ($58k) is reasonable based on typical stale-listing flexibility.
Risks & watch-outs
- Watch-outs: flood insurance adds $66/mo.
- Climate carrying-cost: severe flood risk — expect insurance premiums to compound above CPI over the hold.
Questions for the listing agent
- It's been on market 51 days. Have you received any prior offers? Is the seller open to a 3% concession, seller financing, or rate buy-down credit?
- Have any recent inspections been done? Can we get a copy of the seller's disclosures and any deferred-maintenance estimates?
- What's the actual annual flood-insurance premium (NFIP or private), and is the property in a SFHA with mandatory coverage?
- Is there a deadline driving the sale (1031 exchange, divorce, estate, relocation)? That informs how much negotiation room exists.
- Schools are A-rated — typically a magnet for longer-tenancy family renters. What's the average tenant stay here, and is there a school-zone premium baked into asking?
- What's the average days-on-market for RENTAL listings here right now (not sales)? A rising rental-DOM trend means longer vacancies and softer asking-rent achievability than the comps imply.
- What's the recent tenant-quality profile in this submarket — average credit score on applications, eviction rate, late-payment / NSF rate, and stable-employment percentage? A property-management company in the area should have these aggregated.
- How much new for-sale + rental construction is in the pipeline within 1–3 miles? Heavy new supply typically softens prices + rents 12–24 months out; constrained supply supports both.
Investment metrics
- 1% rule
- 3.05% ✓
- Cap rate
- 26.90%
- Cash-on-cash
- 73.58%
- DSCR
- 4.27
- GRM
- 2.7
CMA / ARV
- ARV (median comp)
- $38,570
- List price
- $59,900
- Delta
- 55.30%
- Verdict
- OVERPRICED
- Comps
- 20 within 1.0 mi
Show comp detail 12 sales within ~0.75 mi
| Address | Dist | Beds/Ba | Sqft | Sold | Price | $/sf | Match |
|---|---|---|---|---|---|---|---|
| 15 Kimberly Ln | 0.06mi | 3/2.0 | 1,248 (+3%) | 1mo | $48,000 | $38 | 92 |
| 26 Van Ess Dr | 0.28mi | 3/2.0 | 1,248 (+3%) | 7mo | $65,500 | $52 | 76 |
| 26915 Eastwood Ln | 0.31mi | 3/2.0 | 1,114 (-8%) | 6mo | $295,000 | $265 | 66 |
| 4 Pageant Ln | 0.24mi | 2/2.0 (-1) | 1,088 (-10%) | 4mo | $50,000 | $46 | 62 |
| 42 Periwinkle | 0.54mi | 2/2.0 (-1) | 1,248 (+3%) | 6mo | $66,000 | $53 | 60 |
| 26946 Westwood Ln | 0.45mi | 4/1.5 (+1) | 1,286 (+6%) | 6mo | $275,000 | $214 | 57 |
| 52 Periwinkle Dr | 0.54mi | 2/2.0 (-1) | 1,152 (-5%) | 6mo | $63,500 | $55 | 56 |
| 55 Patio Ln | 0.59mi | 2/1.0 (-1) | 1,152 (-5%) | 6mo | $30,000 | $26 | 50 |
| 9 Jessica Ln | 0.65mi | 2/2.0 (-1) | 1,152 (-5%) | 9mo | $70,000 | $61 | 49 |
| 8 Harmony | 0.54mi | 2/2.0 (-1) | 1,344 (+10%) | 9mo | $75,000 | $56 | 45 |
| 2 Corktree | 0.62mi | 3/2.0 | 1,056 (-13%) | 7mo | $51,000 | $48 | 44 |
| 10 Corktree Dr | 0.63mi | 2/2.0 (-1) | 1,056 (-13%) | 0mo | $54,900 | $52 | 43 |
Match score weights: distance 35% · size 25% · config 20% · recency 20%. Top-matched comps best support the ARV.
Projected returns pro-forma
-3.0% appreciation · 3.0% rent growth · sell at horizon
- IRR
- 68.3%
- Equity multiple
- 4.08×
- Total profit
- $51,629
- Equity at exit
- $8,931
- IRR
- 72.4%
- Equity multiple
- 8.40×
- Total profit
- $124,126
- Equity at exit
- $5,179
Cash invested: $16,772 (down + closing). Projections, not guarantees.
Landlord ↔ Tenant lean methodology
- Overall (STATE)
- 73 Landlord-Friendly
- State Ohio
- 73 Landlord-Friendly · R+6
- County
- — inherits STATE
- City
- — inherits STATE
ZIP-level market 44138
- Home prices YoY
- -30.8%
- Active inventory
- 183
- Price-to-rent
- 2.7×
Monthly cashflow live
- Estimated rent
- $1,826 medium interval (Pro) →
- Mortgage (P&I)
- −$314
- Tax est. 1.5%
- −$75 /mo · $898/yr
- Insurance
- −$25
- Flood insurance flood zone
- −$66 /mo · $798/yr
- HOA
- −$0
- Vacancy / Maint / Mgmt
- −$383
- Net cashflow
- $962
Break-even live
UW: 25.0% down · 7.5% · 30yr · 1.5% tax · 5.0% vac · 8.0% maint · 8.0% mgmt
Financing live
Cash to close
- Down payment
- $14,975
- Closing costs
- $1,797
- Reserves months
- —
- Total cash needed
- —
Loan-product check · same deal, 3 products live
Conventional
25% down · 7.5% · 30yr
- Down + closing
- —
- Monthly P&I
- —
- Monthly cashflow
- —
- DSCR
- —
- Eligible?
- —
Personal DTI + credit; lowest rate.
DSCR
20% down · 8.5% · 30yr
- Down + closing
- —
- Monthly P&I
- —
- Monthly cashflow
- —
- DSCR
- —
- Eligible?
- —
No personal income docs; deal must DSCR.
Hard money
10% down · 12.0% · 12mo
- Down + closing
- —
- Monthly P&I
- —
- Monthly cashflow
- —
- DSCR
- —
- Eligible?
- —
Short-term bridge; refi at stabilization.
Rent comps 4 comps
| Address | Beds | Baths | Sqft | Rent | $/sqft | DOM | Units | Dist |
|---|---|---|---|---|---|---|---|---|
| 5785 Fitch Rd North Olmsted, OH | 2.0 | 1.0 | 1080 | $1,650 | $1.53 | 44d | 1 | 1.02mi |
| 27080 Oakwood Dr Olmsted Falls, OH | 1.0–2.0 | 1.0–2.0 | 975 | $1,780 | $1.83 | 2d | 39 | 1.16mi |
| 26875 Bagley Rd Olmsted Twp, OH | 1.0–3.0 | 1.0–2.0 | 890 | $1,299 | $1.46 | 3d | 1 | 1.41mi |
| 8450 Daylily DR Olmsted Falls, OH | 2.0–3.0 | 2.5 | 1541 | $2,680 | $1.74 | 2d | 10 | 1.47mi |
Listing history 14 events
-
2026-06-18days on market $59,900 Active 51 DOM
-
2026-06-17days on market $59,900 Active 50 DOM
-
2026-06-16days on market $59,900 Active 49 DOM
-
2026-06-15days on market $59,900 Active 48 DOM
-
2026-06-13days on market $59,900 Active 46 DOM
-
2026-06-13days on market $59,900 Active 45 DOM
-
2026-06-09days on market $59,900 Active 42 DOM
-
2026-06-08days on market $59,900 Active 41 DOM
-
2026-06-07days on market $59,900 Active 40 DOM
-
2026-06-03days on market $59,900 Active 36 DOM
-
2026-06-02days on market $59,900 Active 35 DOM
-
2026-06-01days on market $59,900 Active 34 DOM
-
2026-05-31days on market $59,900 Active 33 DOM
-
2026-04-28$59,900 Active 766-char remark
ⓘ Source: listings_history table (triggers on properties + properties_extension) + one-shot
backfill from property_details.listing_events for pre-trigger history.
Climate risk First Street
- Flood 9/10 Extreme FEMA zone X (unshaded) · 99% chance over 30 yrs
- Wildfire 1/10 Low
- Heat 2/10 Low 7 d/yr ≥96°F today · 15 d/yr by 30 yrs out
- Wind 1/10 Low
- Air quality 2/10 Low 1 unhealthy d/yr today · 3 by 30 yrs out
Nearby sold comps map
Loading sold comps map…
Walkable amenities ~0.75 mi
Loading nearby amenities…
Taxation est. · year 1
- Rental income
- $21,909
- − Mortgage interest
- −$3,355
- − Property taxes
- −$898
- − Insurance
- −$1,097
- − Repairs & maintenance
- −$1,753
- − Management
- −$1,753
- − Depreciation
- −$1,743
- Taxable income
- $11,310
- Est. tax owed @ 24.0%
- −$2,714
- After-tax cash flow
- $8,829/yr
For passive investors: Depreciation is non-cash, so a rental often shows a tax loss while cash-flowing — sheltering income. Rental losses are passive: they offset passive income freely, and up to $25,000/yr can offset ordinary (W-2) income if you actively participate and your MAGI is under $100k (phasing out to $0 by $150k); unused losses carry forward. On sale, claimed depreciation is recaptured at up to 25%, and gains may owe capital-gains tax (a 1031 exchange can defer both). Figures are a year-1 estimate at your 24.0% rate — not tax advice; consult a CPA.
Condition & rehab AI · 12 photos
This 2000 Skyline singlewide manufactured home requires moderate repairs and updates to improve its condition and value. Key areas for improvement include the exterior siding, carpet, and bathrooms.
Repairs flagged
- Moderate exterior siding — Lightly weathered and discolored
- Major carpet — Worn and in need of replacement
- Minor bathroom wallpaper — Dated and could be replaced
Value-add opportunities
- Both update bathrooms with new fixtures and paint — Modernizing bathrooms can improve both resale and rental value
- Both replace carpet with new flooring — New flooring can significantly improve the home's appearance and value
- Both paint exterior siding — Fresh paint can enhance curb appeal and home value
Renovation cost estimate screening
| Repair item | Severity | Est. cost |
|---|---|---|
| exterior siding · Lightly weathered and discolored | Moderate | $3,000–15,000 |
| carpet · Worn and in need of replacement | Major | $15,000–50,000 |
| bathroom wallpaper · Dated and could be replaced | Minor | $500–3,000 |
| Total estimated repair cost · 3 items | $18,500–68,000 |
Value-add ROI direction
- Both update bathrooms with new fixtures and paint — Modernizing bathrooms can improve both resale and rental value ↑
- Both replace carpet with new flooring — New flooring can significantly improve the home's appearance and value ↑
- Both paint exterior siding — Fresh paint can enhance curb appeal and home value ↑
ⓘ Cost ranges are severity-bucket heuristics (US national rule-of-thumb). Get contractor quotes + a written scope before underwriting a rehab budget.
Schools (NCES district)
- District
- Olmsted Falls City
- NCES district ID
- 3904657
- Math proficiency
- 70% ▼ -14.00%
- Reading proficiency
- 70% ▼ -10.00%
- Median HH income
- $68,307
- Composite
- 61.12/100
- National rank
- #787
- State rank
- #134 of 656 in OH
Livability — Olmsted Falls
- Score
- 73/100
- State rank
- #343
- US rank
- #5595
Category grades
Schools grade is shown separately in the Schools card above.
Census & demographics
- County
- Cuyahoga · 1,045,444 people
- City population
- 31,924
- Metro
- Cleveland, OH
- Population (ZIP)
- 23,129
- Household income
- $93,877
- Rent vs Own
- Severe rent burden
- 7.6
Population outlook (Cuyahoga County) Hauer SSP2
- Today (2025)
- 1,244,621 people
- By 2030
- 1,230,093 · -1.2%
- By 2040
- 1,189,108 · -4.5%
- By 2050
- 1,145,706 · -7.9%
- By 2075
- 1,076,557 · -13.5%
- By 2100
- 978,987 · -21.3%
Race, ethnicity, and origin ACS 2023
- Neighborhood character
- Predominantly White (85%)
- Race & ethnicity
- White 85% Hispanic / Latino 9% Two or more races 6% Black 3% Asian 2%
- Hispanic origin (detail)
- Mexican 3% Puerto Rican 3%
- Common ancestry
- Romanian 9% Slovak 2% Lithuanian 1%
- Foreign-born
- 6% · Canada, Jamaica, China
- Languages at home
- 93% English-only · Spanish 4% Other Indo-European 1% Arabic 1%
Political lean MEDSL · Cuyahoga
- 2024 margin
- Solid D (+31.5) · D 65.4% · R 33.9%
- 2008→2024 swing
- -7.4pp toward R · 2008: 38.9pp · 2024: 31.5pp
- All cycles
- 2024: D+31.5 2020: D+34.1 2016: D+35.0 2012: D+38.7 2008: D+38.9
Not yet ingested
- Civics
- —
Market trends
- HPI YoY
- ▼ -89.76%
- Current HPI
- 201.9716
- Rent YoY
- —
- Metro
- —
- State GDP YoY
- ▲ 1.98%
- F500 in state
- 48
Industry mix (Fortune 500 HQ in OH)
| Industry | F500 HQs | Revenue |
|---|---|---|
| Insurance | 3 | $145B |
|
||
| Industrial Machinery | 3 | $49B |
|
||
| Financial Services | 3 | $24B |
|
||
| Consumer Goods | 2 | $93B |
|
||
| Aerospace / Defense | 2 | $47B |
|
||
| Utilities | 2 | $33B |
|
||
Price history
1 event — show timeline
- 2026-04-28 Listed $59,900 MLSNOW
Cash-flow waterfall
monthlySold comps — $/sqft
last 12 mo · ≤1 miLoading sold comps…