4208 Vista Del Sol Dr · Fort Worth, TX
Flood risk 1/10 · Minimal
- FEMA flood zone
- X (unshaded)
- Chance of flooding over 30 yrs
- 0.0%
- Est. flood insurance / yr
- $507 – $1,088
Fire risk 1/10 · Minimal
- Est. fire insurance / yr
- $1,222 – $2,270
Heat risk 8/10 · Major
- Hot days now (above 110°F)
- 7 days/yr
- Hot days in 30 yrs
- 24 days/yr
Wind risk 4/10 · Minor
- Chance of severe wind over 30 yrs
- 22.0%
Air-quality risk 3/10 · Minor
- Unhealthy air days now
- 2 days/yr
- Unhealthy air days in 30 yrs
- 4 days/yr
Risk factors via First Street. Map © Google.
Why this score? — see what drove the B- grade
The composite is a weighted blend of 9 inputs, each scored 0–100. Each bar is that input's sub-score; the figure is the points it added to the 100-point composite (weight × sub-score).
- Cash flow +30.0/30.0
- 1% rule +10.0/10.0
- DSCR +10.0/10.0
- ARV discount +7.5/15.0
- Livability +4.0/5.0
- Condition / age +2.5/5.0
- Rent growth +2.1/5.0
- Schools +2.0/10.0
- Appreciation +0.0/10.0
$38,000
🖨 Deal sheet (PDF) 📄 Offer letter ✓ Due diligence
Listing remarks
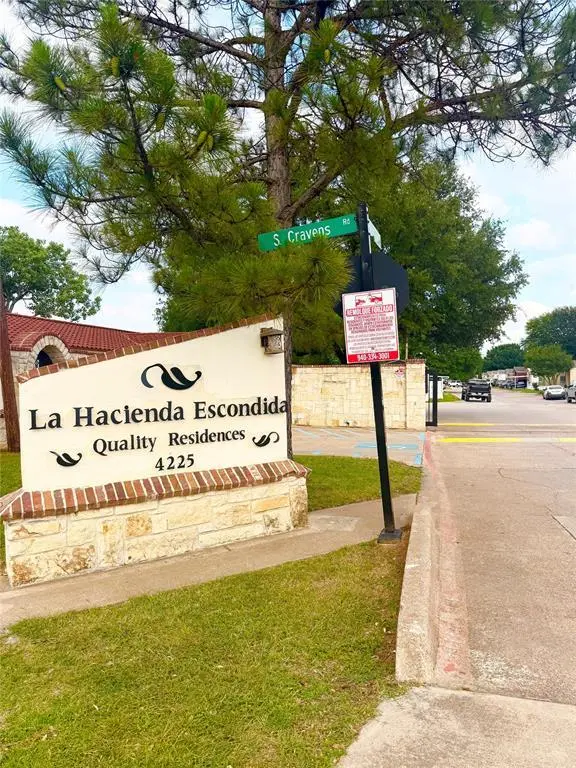
Beautiful home of 3 bedrooms, 2 full bathrooms. Completely remodeled. Located in La Hacienda Escondida residence mobile home park! Clean and safe park with a beautiful swimming pool, a big playground and a nice patio to enjoy the summer or a birthday party gathering! The home comes with a big, covered carport to park 2 cars and keep them away from the sun! Experience the beauty of open living. This thoughtfully designed layout blends kitchen, dining, and living areas into one seamless space, offering endless possibilities for entertaining, relaxing, and making memories. Love the outdoors? You’ll adore this property’s expansive yard — ideal for gardening, play, or entert
Key facts
- Remodeled
- Covered carport
- Big playground
Tags
Property features AI
Finance
- Other: Parcel number 40723739; County: Tarrant; Country: United States
- Financial info: Treat as clear loan type; No second mortgage indicated
- HOA & community: Mandatory association; Monthly association fee of $800; Association covers front yard maintenance; HOA management: Stonetown Hacienda (phone available)
Exterior
- Parking: Covered carport with 2 spaces; Driveway parking
- Utilities: City water; City sewer; Electricity available; Not in a municipal utility district
- Home design: Residential mobile home; Attached property; One level; Built in 1998; Subdivision: La Hacienda Escondida
- Construction: Year built 1998
- Exterior features: Zero lot (subdivided); Has pool
Interior
- Kitchen: Disposal; Eat-in layout
- Bedrooms: 3 bedrooms (all on the main level); Primary bedroom approximately 12 x 12; Second bedroom approximately 10 x 10; Third bedroom approximately 10 x 12
- Bathrooms: 2 full bathrooms
- Interior features: Open floorplan; Eat-in kitchen; One living area; One dining area; Total of 4 rooms
Neighborhood map
What this means for you Summary
Snapshot
- This is a 2-bed/1.0-bath manufactured listed at $38k.
Deal economics
- At list price, monthly cash flow is $183 ($2k/yr) — positive.
- The deal already cash-flows at list — no discount required.
- Meets the 1% rule at list price ($2k rent vs $38k).
- Cap rate 12.1% vs local median 3.9% in Fort Worth — top-decile yield for the area; either an underpriced asset or a hidden risk that comps aren't pricing in. Stress-test before assuming the spread holds.
Location & tenants
- Location reads 80/100 on livability (#49 in TX, #1,954 nationally) — a professional / high-income tenant draw. Strengths: amenities A+, cost of living A+, housing A+; Watch: crime F.
- Fort Worth ISD (urban): math 18% / reading 28% proficiency, ranked #742 of 826 in TX (top 90%) — low school quality limits family demand, transient renter base, plan for 1-2y turnover; 73% free/reduced lunch — lower-income household profile, screen leases tightly.
- Zoned schools: Sunrise - Mcmillan El (math 8% / reading 12%, grade F, #4,259 of 4,322 statewide, top 99%, 325 students, 98% FRL) — zoned schools average 98% FRL vs 73% district-wide (26 pts higher); higher-poverty schools than district average — tighter screening recommended.
- Zoned-school proficiency averages 10% at this address vs 23% district-wide (-13 pts) — the specific schools serving this property underperform the Fort Worth ISD average; the district grade overstates school quality for this exact location.
- Market conditions: Rents soft (-1.6%/yr); 187 active listings in the ZIP; 18 comparable units currently listed for rent nearby; rentals at typical pace (median 26d on market — plan ~3-4 weeks tenant-placement turnaround); 18,938 units permitted in Tarrant County in 2024 (8,336 in 5+ unit buildings).
- This rent runs 36% of the median local income ($51k/yr) — at the standard rent-burdened threshold; future hikes will face affordability resistance.
Forward outlook
- Local home prices are declining (-3.0%/yr); year-one equity from $263 of loan paydown is wiped out by about $1k of value loss. Plan a longer hold.
- Tarrant County population projected at +41% by 2050 — long-run rental-demand tailwind backs the buy-and-hold thesis.
Negotiation context
- Only 14 days on market — expect competitive offers; lowballing is unlikely to land.
Risks & watch-outs
- Watch-outs: HOA is 52% of rent.
- Climate carrying-cost: extreme-heat days projected 7→24/yr by 2055 (HVAC capex compounding) — expect insurance premiums to compound above CPI over the hold.
Questions for the listing agent
- What does the HOA fee cover, when was the last increase, and are there any pending special assessments or reserve-fund shortfalls?
- Is there a deadline driving the sale (1031 exchange, divorce, estate, relocation)? That informs how much negotiation room exists.
- Schools are D-rated, which usually means shorter tenancies and higher turnover. Who's the typical renter profile here, and what's been the actual vacancy rate?
- Crime grade is F in this area — have there been break-ins, vandalism, or insurance claims at this property in the last 3 years? What carrier currently insures it and at what premium?
- What's the average days-on-market for RENTAL listings here right now (not sales)? A rising rental-DOM trend means longer vacancies and softer asking-rent achievability than the comps imply.
- What's the recent tenant-quality profile in this submarket — average credit score on applications, eviction rate, late-payment / NSF rate, and stable-employment percentage? A property-management company in the area should have these aggregated.
- How much new for-sale + rental construction is in the pipeline within 1–3 miles? Heavy new supply typically softens prices + rents 12–24 months out; constrained supply supports both.
Investment metrics
- 1% rule
- 4.06% ✓
- Cap rate
- 12.06%
- Cash-on-cash
- 20.61%
- DSCR
- 1.92
- GRM
- 2.1
CMA / ARV
No comps found within radius.
Projected returns pro-forma
-3.0% appreciation · 0.0% rent growth · sell at horizon
- IRR
- 3.9%
- Equity multiple
- 1.14×
- Total profit
- $1,455
- Equity at exit
- $5,666
- IRR
- 1.8%
- Equity multiple
- 1.07×
- Total profit
- $795
- Equity at exit
- $3,286
Cash invested: $10,640 (down + closing). Projections, not guarantees.
Landlord ↔ Tenant lean methodology
- Overall (STATE)
- 87 Strongly Landlord-Friendly
- State Texas
- 87 Strongly Landlord-Friendly · R+5
- County
- — inherits STATE
- City
- — inherits STATE
ZIP-level market 76119
- Home prices YoY
- -6.4%
- Rents YoY
- -1.6%
- Active inventory
- 187
- Price-to-rent
- 2.1×
Monthly cashflow live
- Estimated rent
- $1,544 high interval (Pro) →
- Mortgage (P&I)
- −$199
- Tax from tax record
- −$22 /mo · $261/yr
- Insurance
- −$16
- HOA
- −$800
- Vacancy / Maint / Mgmt
- −$324
- Net cashflow
- $183
Break-even live
Sensitivity live
| Price | -10% $204 | -5% $193 | +0% $183 | +5% $172 | +10% $161 |
|---|---|---|---|---|---|
| Rent | -10% $61 | -5% $122 | +0% $183 | +5% $244 | +10% $305 |
| Rate | -1.0pp $202 | -0.5pp $192 | base $183 | +0.5pp $173 | +1.0pp $163 |
UW: 25.0% down · 7.5% · 30yr · 1.5% tax · 5.0% vac · 8.0% maint · 8.0% mgmt
Financing live
Cash to close
- Down payment
- $9,500
- Closing costs
- $1,140
- Reserves months
- —
- Total cash needed
- —
Loan-product check · same deal, 3 products live
Conventional
25% down · 7.5% · 30yr
- Down + closing
- —
- Monthly P&I
- —
- Monthly cashflow
- —
- DSCR
- —
- Eligible?
- —
Personal DTI + credit; lowest rate.
DSCR
20% down · 8.5% · 30yr
- Down + closing
- —
- Monthly P&I
- —
- Monthly cashflow
- —
- DSCR
- —
- Eligible?
- —
No personal income docs; deal must DSCR.
Hard money
10% down · 12.0% · 12mo
- Down + closing
- —
- Monthly P&I
- —
- Monthly cashflow
- —
- DSCR
- —
- Eligible?
- —
Short-term bridge; refi at stabilization.
Rent comps 18 comps
| Address | Beds | Baths | Sqft | Rent | $/sqft | DOM | Units | Dist |
|---|---|---|---|---|---|---|---|---|
| 5908 Oakdale Dr Fort Worth, TX | 3.0 | 2.0 | 1090 | $1,475 | $1.35 | 8d | 1 | 0.10mi |
| 5910 Wilkes Dr Fort Worth, TX | 3.0 | 2.0 | 872 | $1,399 | $1.60 | 0d | 1 | 0.14mi |
| 5912 Wilkes Dr Fort Worth, TX | 3.0 | 2.0 | 872 | $1,499 | $1.72 | 45d | 1 | 0.15mi |
| 5913 Montague St Fort Worth, TX | 3.0 | 2.0 | 1090 | $1,549 | $1.42 | 15d | 1 | 0.24mi |
| 5820 Grayson St Fort Worth, TX | 3.0 | 2.5 | 1417 | $1,895 | $1.34 | 45d | 1 | 0.29mi |
| 5818 Grayson St Unit 5818 Fort Worth, TX | 3.0 | 2.5 | 1400 | $2,000 | $1.43 | 20d | 1 | 0.30mi |
| 3848 Waldorf St Fort Worth, TX | 2.0 | 1.0 | 734 | $1,195 | $1.63 | 6d | 1 | 0.65mi |
| 3865 Stalcup Rd Fort Worth, TX | 3.0 | 2.0 | 1090 | $1,800 | $1.65 | 0d | 1 | 0.66mi |
| 3700 Radford Rd Fort Worth, TX | 3.0 | 2.0 | 1124 | $1,650 | $1.47 | 26d | 1 | 0.79mi |
| 3700 Radford Rd Fort Worth, TX | 3.0 | 2.0 | 1124 | $1,650 | $1.47 | 14d | 1 | 0.79mi |
| 5702 Shoreline Cir S Fort Worth, TX | 3.0 | 2.0 | 1200 | $1,450 | $1.21 | 45d | 1 | 1.02mi |
| 3201 Mount Horum Way Fort Worth, TX | 3.0 | 2.0 | 1045 | $1,675 | $1.60 | 0d | 1 | 1.17mi |
| 5055 Virgil St Fort Worth, TX | 3.0 | 2.0 | 1089 | $1,650 | $1.52 | 26d | 1 | 1.23mi |
| 5336 Cottey St Fort Worth, TX | 3.0 | 2.0 | 1045 | $1,699 | $1.63 | 45d | 1 | 1.27mi |
| 5605 Topwater Trl Fort Worth, TX | 2.0 | 2.0 | 845 | $2,200 | $2.60 | 45d | 1 | 1.31mi |
| 5532 Shore Point Trl Fort Worth, TX | 3.0 | 2.5 | 1446 | $1,950 | $1.35 | 45d | 1 | 1.32mi |
| 2167 Serenity Ln Arlington, TX | 3.0 | 2.5 | 1496 | $2,500 | $1.67 | 45d | 1 | 1.40mi |
| 5636 Lester Granger Dr Fort Worth, TX | 3.0 | 2.0 | 1300 | $1,495 | $1.15 | 26d | 1 | 1.42mi |
HOA detail
- Monthly dues
- $800 · $9,600/yr
- Likely covers
- pool
Listing history 6 events
-
2026-06-04days on market $38,000 Active 14 DOM
-
2026-06-03days on market $38,000 Active 13 DOM
-
2026-06-02days on market $38,000 Active 12 DOM
-
2026-06-01days on market $38,000 Active 11 DOM
-
2026-05-31days on market $38,000 Active 10 DOM
-
2026-05-21$38,000 Active
ⓘ Source: listings_history table (triggers on properties + properties_extension) + one-shot
backfill from property_details.listing_events for pre-trigger history.
Tax reassessment forecast TX · Resets to sale price
- Current annual tax
- $261 · $22/mo
- Projected year-2 tax
- $695 · $58/mo
- Expected delta
- +$434/yr (+$36/mo · 166.0%)
ⓘ Screening estimate from a state-policy table — verify with the county assessor before closing.
Climate risk First Street
- Flood 1/10 Low FEMA zone X (unshaded) · 0% chance over 30 yrs
- Wildfire 1/10 Low
- Heat 8/10 Severe 7 d/yr ≥110°F today · 24 d/yr by 30 yrs out
- Wind 4/10 Moderate 22% chance of damaging wind over 30 yrs
- Air quality 3/10 Moderate 2 unhealthy d/yr today · 4 by 30 yrs out
Nearby sold comps map
Loading sold comps map…
Walkable amenities ~0.75 mi
Loading nearby amenities…
Taxation est. · year 1
- Rental income
- $18,526
- − Mortgage interest
- −$2,129
- − Property taxes
- −$261
- − Insurance
- −$190
- − Repairs & maintenance
- −$1,482
- − Management
- −$1,482
- − HOA
- −$9,600
- − Depreciation
- −$1,105
- Taxable income
- $2,276
- Est. tax owed @ 24.0%
- −$546
- After-tax cash flow
- $1,646/yr
For passive investors: Depreciation is non-cash, so a rental often shows a tax loss while cash-flowing — sheltering income. Rental losses are passive: they offset passive income freely, and up to $25,000/yr can offset ordinary (W-2) income if you actively participate and your MAGI is under $100k (phasing out to $0 by $150k); unused losses carry forward. On sale, claimed depreciation is recaptured at up to 25%, and gains may owe capital-gains tax (a 1031 exchange can defer both). Figures are a year-1 estimate at your 24.0% rate — not tax advice; consult a CPA.
Schools (NCES district)
- District
- Fort Worth ISD
- NCES district ID
- 4819700
- Math proficiency
- 18% ▼ -16.00%
- Reading proficiency
- 28% ▼ -6.00%
- Median HH income
- $42,109
- Composite
- 19.61/100
- National rank
- #8753
- State rank
- #742 of 826 in TX
Livability — Fort Worth
- Score
- 80/100
- State rank
- #49
- US rank
- #1954
Category grades
Schools grade is shown separately in the Schools card above.
Census & demographics
- Census place
- Fort Worth, TX
- County
- Tarrant County · 2,033,669 people
- City population
- 911,619
- Metro
- Dallas-Fort Worth-Arlington, TX
- Population (ZIP)
- 52,974
- Household income
- $51,267
- Rent vs Own
- Severe rent burden
- 2221.0
Population outlook (Tarrant County) Hauer SSP2
- Today (2025)
- 2,380,417 people
- By 2030
- 2,578,900 · +8.3%
- By 2040
- 2,974,995 · +25.0%
- By 2050
- 3,350,489 · +40.8%
- By 2075
- 4,216,909 · +77.2%
- By 2100
- 4,741,527 · +99.2%
Race, ethnicity, and origin ACS 2023
- Neighborhood character
- Diverse neighborhood (Simpson 0.60)
- Race & ethnicity
- Hispanic / Latino 51% Black 36% Two or more races 26% White 8% Asian 3%
- Hispanic origin (detail)
- Mexican 44%
- Foreign-born
- 25% · Canada, Philippines
- Languages at home
- 54% English-only · Spanish 42% Other Indo-European 2% Other Asian/Pacific 1%
Political lean MEDSL · Tarrant
- 2024 margin
- Lean R (+5.1) · D 46.7% · R 51.9% · Other 1.4%
- 2008→2024 swing
- +6.6pp toward D · 2008: -11.7pp · 2024: -5.1pp
- All cycles
- 2024: R+5.1 2020: D+0.2 2016: R+8.7 2012: R+15.7 2008: R+11.7
Not yet ingested
- Civics
- —
Market trends
- HPI YoY
- ▼ -23.04%
- Current HPI
- 336.7941
- Rent YoY
- ▼ -1.61%
- Metro
- Dallas-Fort Worth-Arlington, TX
- State GDP YoY
- ▲ 3.95%
- F500 in state
- 110
Industry mix (Fortune 500 HQ in TX)
| Industry | F500 HQs | Revenue |
|---|---|---|
| Energy | 16 | $1,198B |
|
||
| Technology | 5 | $198B |
|
||
| Engineering / Construction | 4 | $72B |
|
||
| Energy Services | 3 | $60B |
|
||
| Utilities | 3 | $41B |
|
||
| Healthcare | 2 | $330B |
|
||
Price history
1 event — show timeline
- 2026-05-21 Listed $38,000 NTREIS
Property tax history
-1.9%/yrLatest (2025): $261 · -2.4% YoY. Source: county tax records.
Cash-flow waterfall
monthlySold comps — $/sqft
last 12 mo · ≤1 miLoading sold comps…