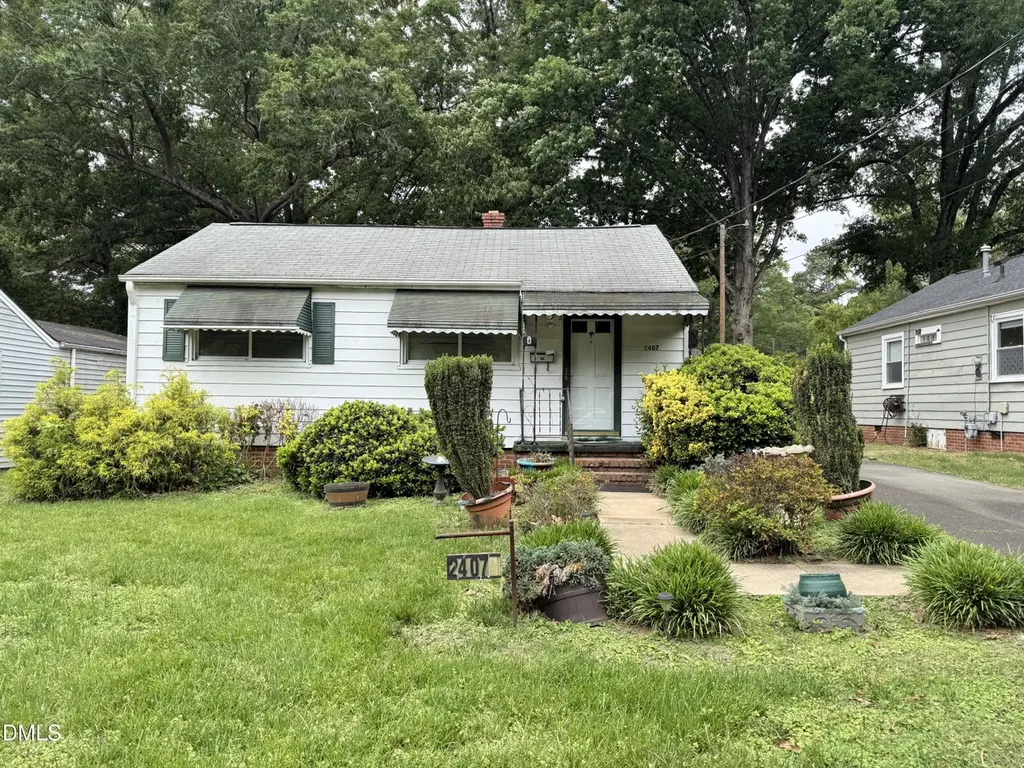
2407 Stephenson St · Durham, NC
Flood risk 1/10 · Minimal
- FEMA flood zone
- X (unshaded)
- Chance of flooding over 30 yrs
- 0.0%
- Est. flood insurance / yr
- $507 – $1,088
Fire risk 3/10 · Minor
- Est. fire insurance / yr
- $906 – $1,684
Heat risk 6/10 · Moderate
- Hot days now (above 106°F)
- 7 days/yr
- Hot days in 30 yrs
- 16 days/yr
Wind risk 6/10 · Moderate
- Chance of severe wind over 30 yrs
- 27.0%
Air-quality risk 2/10 · Minimal
- Unhealthy air days now
- 1 days/yr
- Unhealthy air days in 30 yrs
- 1 days/yr
Risk factors via First Street. Map © Google.
Why this score? — see what drove the D+ grade
The composite is a weighted blend of 9 inputs, each scored 0–100. Each bar is that input's sub-score; the figure is the points it added to the 100-point composite (weight × sub-score).
- ARV discount +15.0/15.0
- Cash flow +14.0/30.0
- DSCR +4.3/10.0
- Livability +4.0/5.0
- 1% rule +3.6/10.0
- Rent growth +3.1/5.0
- Schools +3.0/10.0
- Condition / age +2.5/5.0
- Appreciation +0.0/10.0
$160,000
🖨 Deal sheet (PDF) 📄 Offer letter ✓ Due diligence
Listing remarks
PRICE ADJUSTMENT= BEST DEAL IN DURHAM. Great opportunity in Durham's Colonial Village of East Durham. This charming 1950 bungalow offers 2 bedrooms, 1 bath, and 693 square feet full of potential on a spacious 0.17-acre lot. Whether you are looking for your next investment property, renovation project, or a home to personalize and make your own, this property offers endless possibilities. The home features a functional layout with a classic bungalow character ready to be restored or updated to your style. Outside, the flat, fenced backyard provides added privacy along with ample space for outdoor entertaining, gardening, expansion possibilities, or future improvements. Conveniently located n
Key facts
- Potential on lot
- Flat fenced backyard
- Outdoor space
Tags
Property features AI
Finance
- Other: Located in Durham County, postal code 27704; Directions: From Roxboro Street take a right on E Club. Stephenson Street is 1/4 mile on left. Home is on the left.
- HOA & community: No association
Exterior
- Utilities: Public water; Public sewer
- Home design: One-story house
- Construction: Vinyl siding; Combination foundation; Asphalt roof; Built as a house (total living area 693)
- Exterior features: Public maintained road access; Lot about 0.17 acres
Interior
- Bedrooms: 2 bedrooms (both on the main level)
- Flooring: Laminate
- Bathrooms: 1 full bathroom
- Heating & cooling: Space heater; Wall/window unit(s) for cooling
- Interior features: Laminate flooring
Neighborhood map
What this means for you Summary
Snapshot
- This is a 2-bed/1.0-bath single-family listed at $160k.
Deal economics
- At list price, monthly cash flow is $22 ($260/yr) — positive.
- The deal already cash-flows at list — no discount required.
- To meet the 1% rule (rent ≥ 1% of price), the offer needs to be $137k (14.4% below list).
- Recommended offer: $137k (14.4% below list) — sets the bar for 1% rule.
- Cap rate 6.5% vs local median 3.0% in Durham — top-decile yield for the area; either an underpriced asset or a hidden risk that comps aren't pricing in. Stress-test before assuming the spread holds.
Location & tenants
- Location reads 81/100 on livability (#15 in NC, #1,411 nationally) — a professional / high-income tenant draw. Strengths: amenities A+, commute A+, housing A+; Watch: crime F.
- Durham Public Schools (urban): math 29% / reading 39% proficiency, ranked #132 of 178 in NC (top 74%) — families likely to look elsewhere, expect single-tenant / working-renter base with shorter leases.
- Zoned schools: Holt Elementary (math 10% / reading 26%, grade F, #1,280 of 1,410 statewide, top 91%, 636 students, 83% FRL); George L Carrington Middle (math 23% / reading 37%, grade F, #335 of 475 statewide, top 72%, 755 students, 73% FRL); Riverside High (math 49% / reading 42%, grade D-, #347 of 535 statewide, top 65%, 1,812 students, 51% FRL).
- Market conditions: Rents rising (+2.6%/yr); 400 active listings in the ZIP; 10 comparable units currently listed for rent nearby; rentals at typical pace (median 25d on market — plan ~3-4 weeks tenant-placement turnaround); 2,905 units permitted in Durham County in 2024 (955 in 5+ unit buildings).
Forward outlook
- Local home prices are declining (-3.0%/yr); year-one equity from $1k of loan paydown is wiped out by about $5k of value loss. Plan a longer hold.
- Durham County population projected at +44% by 2050 — long-run rental-demand tailwind backs the buy-and-hold thesis.
Negotiation context
- It's been on market 58 days — a 3% lower offer ($155k) is reasonable based on typical stale-listing flexibility.
Risks & watch-outs
- Watch-outs: built in 1950 — expect roof / HVAC / electrical / plumbing capex.
- Climate carrying-cost: major wind risk, 27% chance of damaging wind over 30y; extreme-heat days projected 7→16/yr by 2055 (HVAC capex compounding) — expect insurance premiums to compound above CPI over the hold.
Questions for the listing agent
- It's been on market 58 days. Have you received any prior offers? Is the seller open to a 14% concession, seller financing, or rate buy-down credit?
- Built in 1950 — when were the roof, HVAC, electrical panel, plumbing, and water heater last replaced?
- Is there a deadline driving the sale (1031 exchange, divorce, estate, relocation)? That informs how much negotiation room exists.
- Schools are D-rated, which usually means shorter tenancies and higher turnover. Who's the typical renter profile here, and what's been the actual vacancy rate?
- Crime grade is F in this area — have there been break-ins, vandalism, or insurance claims at this property in the last 3 years? What carrier currently insures it and at what premium?
- The area grade is low — what's the realistic commute time and amenity access for the typical tenant pool here? Any planned neighborhood developments (good or bad) we should know about?
- What's the average days-on-market for RENTAL listings here right now (not sales)? A rising rental-DOM trend means longer vacancies and softer asking-rent achievability than the comps imply.
- What's the recent tenant-quality profile in this submarket — average credit score on applications, eviction rate, late-payment / NSF rate, and stable-employment percentage? A property-management company in the area should have these aggregated.
- How much new for-sale + rental construction is in the pipeline within 1–3 miles? Heavy new supply typically softens prices + rents 12–24 months out; constrained supply supports both.
Investment metrics
- 1% rule
- 0.86% ✗
- Cap rate
- 6.46%
- Cash-on-cash
- 0.58%
- DSCR
- 1.03
- GRM
- 9.7
CMA / ARV
- ARV (on-the-fly)
- $244,992
- Comps found
- 4
Show comp detail 4 sales within ~0.75 mi
| Address | Dist | Beds/Ba | Sqft | Sold | Price | $/sf | Match |
|---|---|---|---|---|---|---|---|
| 2408 Stephenson St | 0.03mi | 2/1.0 | 725 (+4%) | 6mo | $255,000 | $352 | 86 |
| 608 E Ellerbee St | 0.13mi | 2/1.0 | 692 (-1%) | 16mo | $150,000 | $217 | 80 |
| 2402 Stephenson St St | 0.03mi | 2/1.0 | 738 (+6%) | 24mo | $269,900 | $366 | 69 |
| 810 Nancy St | 0.74mi | 2/1.0 | 795 (+14%) | 14mo | $160,000 | $201 | 30 |
Match score weights: distance 35% · size 25% · config 20% · recency 20%. Top-matched comps best support the ARV.
Projected returns pro-forma
-3.0% appreciation · 2.58% rent growth · sell at horizon
- IRR
- -15.8%
- Equity multiple
- 0.44×
- Total profit
- $-25,131
- Equity at exit
- $23,857
- IRR
- -8.1%
- Equity multiple
- 0.50×
- Total profit
- $-22,481
- Equity at exit
- $13,834
Cash invested: $44,800 (down + closing). Projections, not guarantees.
Landlord ↔ Tenant lean methodology
- Overall (STATE)
- 85 Strongly Landlord-Friendly
- State North Carolina
- 85 Strongly Landlord-Friendly · R+3
- County
- — inherits STATE
- City
- — inherits STATE
ZIP-level market 27704
- Rents YoY
- 2.6%
- Active inventory
- 400
- Price-to-rent
- 9.7×
Monthly cashflow live
- Estimated rent
- $1,369 high interval (Pro) →
- Mortgage (P&I)
- −$839
- Tax from tax record
- −$154 /mo · $1,852/yr
- Insurance
- −$67
- HOA
- −$0
- Vacancy / Maint / Mgmt
- −$288
- Net cashflow
- $22
Break-even live
Sensitivity live
| Price | -10% $112 | -5% $67 | +0% $22 | +5% $-24 | +10% $-69 |
|---|---|---|---|---|---|
| Rent | -10% $-87 | -5% $-32 | +0% $22 | +5% $76 | +10% $130 |
| Rate | -1.0pp $102 | -0.5pp $62 | base $22 | +0.5pp $-20 | +1.0pp $-62 |
UW: 25.0% down · 7.5% · 30yr · 1.5% tax · 5.0% vac · 8.0% maint · 8.0% mgmt
Financing live
Cash to close
- Down payment
- $40,000
- Closing costs
- $4,800
- Reserves months
- —
- Total cash needed
- —
Loan-product check · same deal, 3 products live
Conventional
25% down · 7.5% · 30yr
- Down + closing
- —
- Monthly P&I
- —
- Monthly cashflow
- —
- DSCR
- —
- Eligible?
- —
Personal DTI + credit; lowest rate.
DSCR
20% down · 8.5% · 30yr
- Down + closing
- —
- Monthly P&I
- —
- Monthly cashflow
- —
- DSCR
- —
- Eligible?
- —
No personal income docs; deal must DSCR.
Hard money
10% down · 12.0% · 12mo
- Down + closing
- —
- Monthly P&I
- —
- Monthly cashflow
- —
- DSCR
- —
- Eligible?
- —
Short-term bridge; refi at stabilization.
Rent comps 10 comps
| Address | Beds | Baths | Sqft | Rent | $/sqft | DOM | Units | Dist |
|---|---|---|---|---|---|---|---|---|
| 114 E Club Blvd Unit A Durham, NC | 1.0 | 1.0 | 675 | $1,240 | $1.84 | 15d | 1 | 0.50mi |
| 114 E Club Blvd Unit B Durham, NC | 1.0 | 1.0 | 675 | $1,240 | $1.84 | 25d | 1 | 0.50mi |
| 1605 N Roxboro St Unit 00B Durham, NC | 1.0 | 1.0 | 492 | $1,050 | $2.13 | 25d | 1 | 1.03mi |
| 3523 N Roxboro St Durham, NC | 1.0–2.0 | 1.0–2.0 | 891 | $1,299 | $1.46 | 25d | 1 | 1.17mi |
| 3800 Meriwether Dr Durham, NC | 1.0–2.0 | 1.0–2.0 | 904 | $1,750 | $1.94 | 15d | 23 | 1.30mi |
| 414 Craven St Unit B Durham, NC | 1.0 | 1.0 | 610 | $1,200 | $1.97 | 25d | 1 | 1.30mi |
| 800 Demerius St Durham, NC | 2.0 | 1.0 | 715 | $1,445 | $2.02 | 25d | 1 | 1.32mi |
| 1001 Ruby St Durham, NC | 2.0 | 1.0–2.0 | 600 | $1,300 | $2.17 | 15d | 3 | 1.44mi |
| 308 W Trinity Ave Unit 19 Durham, NC | 1.0 | 1.0 | 595 | $1,100 | $1.85 | 15d | 1 | 1.45mi |
| 4001 Meriwether Dr Durham, NC | 1.0–3.0 | 1.0–2.0 | 909 | $1,450 | $1.60 | 25d | 1 | 1.45mi |
Listing history 18 events
-
2026-06-22days on market $160,000 Active 58 DOM
-
2026-06-18price $160,000 Active 55 DOM
-
2026-06-18days on market $169,000 Active 55 DOM
-
2026-06-17days on market $169,000 Active 54 DOM
-
2026-06-16days on market $169,000 Active 53 DOM
-
2026-06-15days on market $169,000 Active 52 DOM
-
2026-06-14days on market $169,000 Active 50 DOM
-
2026-06-10days on market $169,000 Active 47 DOM
-
2026-06-09days on market $169,000 Active 46 DOM
-
2026-06-08days on market $169,000 Active 45 DOM
-
2026-06-07days on market $169,000 Active 44 DOM
-
2026-06-05days on market $169,000 Active 41 DOM
-
2026-06-03days on market $169,000 Active 40 DOM
-
2026-06-02days on market $169,000 Active 39 DOM
-
2026-06-01days on market $169,000 Active 38 DOM
-
2026-05-31days on market $169,000 Active 37 DOM
-
2026-05-30days on market $169,000 Active 36 DOM
-
2026-04-24$169,000 Active
ⓘ Source: listings_history table (triggers on properties + properties_extension) + one-shot
backfill from property_details.listing_events for pre-trigger history.
Tax reassessment forecast NC · Resets to sale price
- Current annual tax
- $1,852 · $154/mo
- Projected year-2 tax
- $1,852 · $154/mo
- Expected delta
- $0/yr ($0/mo · 0.0%)
ⓘ Screening estimate from a state-policy table — verify with the county assessor before closing.
Climate risk First Street
- Flood 1/10 Low FEMA zone X (unshaded) · 0% chance over 30 yrs
- Wildfire 3/10 Moderate
- Heat 6/10 Major 7 d/yr ≥106°F today · 16 d/yr by 30 yrs out
- Wind 6/10 Major 27% chance of damaging wind over 30 yrs
- Air quality 2/10 Low 1 unhealthy d/yr today · 1 by 30 yrs out
Nearby sold comps map
Loading sold comps map…
Walkable amenities ~0.75 mi
Loading nearby amenities…
Taxation est. · year 1
- Rental income
- $16,431
- − Mortgage interest
- −$8,962
- − Property taxes
- −$1,852
- − Insurance
- −$800
- − Repairs & maintenance
- −$1,314
- − Management
- −$1,314
- − Depreciation
- −$4,655
- Taxable loss
- −$2,467
- Est. tax savings @ 24.0%
- +$592
- After-tax cash flow
- $852/yr
For passive investors: Depreciation is non-cash, so a rental often shows a tax loss while cash-flowing — sheltering income. Rental losses are passive: they offset passive income freely, and up to $25,000/yr can offset ordinary (W-2) income if you actively participate and your MAGI is under $100k (phasing out to $0 by $150k); unused losses carry forward. On sale, claimed depreciation is recaptured at up to 25%, and gains may owe capital-gains tax (a 1031 exchange can defer both). Figures are a year-1 estimate at your 24.0% rate — not tax advice; consult a CPA.
Schools (NCES district)
- District
- Durham Public Schools
- NCES district ID
- 3701260
- Math proficiency
- 29% ▼ -3.00%
- Reading proficiency
- 39% ▲ 2.00%
- Median HH income
- $52,143
- Composite
- 29.69/100
- National rank
- #6457
- State rank
- #132 of 178 in NC
Livability — Durham
- Score
- 81/100
- State rank
- #15
- US rank
- #1411
Category grades
Schools grade is shown separately in the Schools card above.
Census & demographics
- Census place
- Durham, NC
- County
- Durham County · 288,747 people
- City population
- 288,747
- Metro
- Durham-Chapel Hill, NC
- Population (ZIP)
- 40,102
- Household income
- $69,668
- Rent vs Own
- Severe rent burden
- 1280.0
Population outlook (Durham County) Hauer SSP2
- Today (2025)
- 368,962 people
- By 2030
- 402,686 · +9.1%
- By 2040
- 468,677 · +27.0%
- By 2050
- 531,727 · +44.1%
- By 2075
- 660,446 · +79.0%
- By 2100
- 739,971 · +100.6%
Race, ethnicity, and origin ACS 2023
- Neighborhood character
- Diverse neighborhood (Simpson 0.67)
- Race & ethnicity
- Black 48% White 23% Hispanic / Latino 22% Two or more races 10% Asian 2%
- Hispanic origin (detail)
- Mexican 9%
- Common ancestry
- Italian 2% Slovak 1% Lithuanian 1%
- Foreign-born
- 17% · Canada, Jamaica
- Languages at home
- 76% English-only · Spanish 19% Tagalog/Filipino 1% Other Indo-European 1%
Political lean MEDSL · Durham
- 2024 margin
- Solid D (+61.9) · D 80.2% · R 18.2% · Other 1.6%
- 2008→2024 swing
- +10.0pp toward D · 2008: 51.9pp · 2024: 61.9pp
- All cycles
- 2024: D+61.9 2020: D+62.4 2016: D+60.4 2012: D+52.7 2008: D+51.9
Not yet ingested
- Civics
- —
Market trends
- HPI YoY
- ▼ -383.91%
- Current HPI
- 265.4178
- Rent YoY
- ▲ 2.58%
- Metro
- Durham-Chapel Hill, NC
- State GDP YoY
- ▲ 3.28%
- F500 in state
- 26
Industry mix (Fortune 500 HQ in NC)
| Industry | F500 HQs | Revenue |
|---|---|---|
| Financial Services | 2 | $213B |
|
||
| Retail | 2 | $95B |
|
||
| Industrial Conglomerate | 1 | $38B |
|
||
| Metals / Steel | 1 | $35B |
|
||
| Utilities | 1 | $30B |
|
||
| Industrial Machinery | 1 | $19B |
|
||
Price history
1 event — show timeline
- 2026-04-24 Listed $169,000 TMLS
Property tax history
+13.1%/yrLatest (2025): $1,852 · +168.0% YoY. Source: county tax records.
Cash-flow waterfall
monthlySold comps — $/sqft
last 12 mo · ≤1 miLoading sold comps…