 🌊 Lakefront
2603 NW 103rd Ave · Sunrise, FL
Flood risk No data
- FEMA flood zone
- —
- Chance of flooding over 30 yrs
- —
- Est. flood insurance / yr
- —
Fire risk No data
- Est. fire insurance / yr
- —
Heat risk No data
- Hot days now (above threshold)
- —
- Hot days in 30 yrs
- —
Wind risk No data
- Chance of severe wind over 30 yrs
- —
Air-quality risk No data
- Unhealthy air days now
- —
- Unhealthy air days in 30 yrs
- —
Risk factors via First Street. Map © Google.
Why this score? — see what drove the D grade
The composite is a weighted blend of 9 inputs, each scored 0–100. Each bar is that input's sub-score; the figure is the points it added to the 100-point composite (weight × sub-score).
- Cash flow +11.5/30.0
- ARV discount +7.5/15.0
- 1% rule +6.9/10.0
- Livability +4.2/5.0
- Schools +4.1/10.0
- Condition / age +3.8/5.0
- DSCR +3.4/10.0
- Rent growth +2.7/5.0
- Appreciation +0.0/10.0
$239,900
🖨 Deal sheet (PDF) 📄 Offer letter ✓ Due diligence
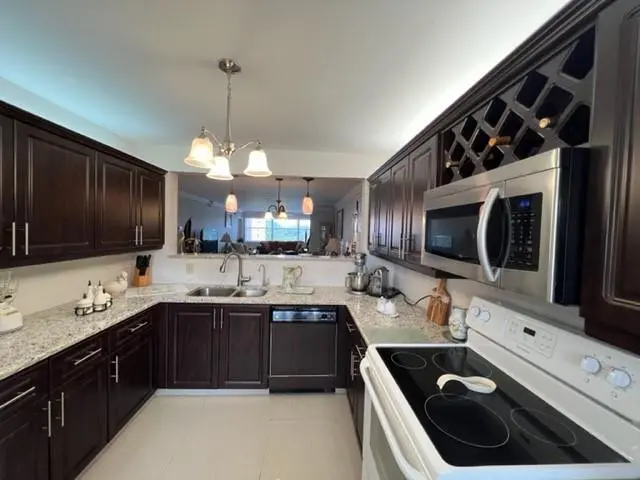
Listing remarks
Welcome to this spacious well maintained unit with nice tiles throughout. Enjoy the Resort style Massive 34,000 sq. ft. Clubhouse with a 1,000-seat theater and fitness center. Golf & Sports: Free private 9-hole golf course plus tennis, pickleball, and shuffleboard. Pools & Relaxation: Large heated main pool, hot tub, and multiple satellite pools. Social Hub: 5 regional clubhouses, card rooms, billiards, etc. .This is an active adult community where retirement is a pleasure. .
Key facts
- $685 HOA
- Parking
- Community pool
Property features AI
Finance
- Other: Community amenities include clubhouse, fitness center, billiard and game rooms, indoor and heated outdoor pools, spa/hot tub, sauna, tennis and pickleball courts, shuffleboard, golf course, business center, library, lobby, community room, courtesy bus, maintained community, security, recreation facilities
- HOA & community: Has association (SUNRISE LAKES PHASE 4); Monthly HOA fee; HOA covers water, sewer, trash, pest control, security, common areas, golf, reserve funds, roof repairs, pool and recreation facility service, maintenance
Exterior
- Parking: Assigned parking plus guest parking (1 open space total)
- Security: Security guard; Key card entry
- Utilities: Public water; Public sewer; Water connected
- Home design: Condominium; Resale condition; Building has 4 stories; Faces east
- Construction: CBS construction; Tile roof
- Exterior features: Waterfront property; Heated spa / hot tub
Interior
- Kitchen: Dishwasher; Electric range; Microwave; Refrigerator
- Bedrooms: 2 bedrooms on the main level
- Flooring: Tile
- Bathrooms: 2 full bathrooms on the main level
- Heating & cooling: Central heating; Central air conditioning
- Interior features: Walk-in closets; Split bedroom layout; Furnished
- Laundry & utility: In-unit laundry room
Neighborhood map
What this means for you Summary
Snapshot
- This is a 2-bed/2.0-bath condo listed at $240k. Condition is rated good.
Deal economics
- At list price, monthly cash flow is $-79 ($-944/yr) — negative.
- To cash-flow at today's rent, offer at most $229k (4.7% below list).
- Meets the 1% rule at list price ($3k rent vs $240k).
- Recommended offer: $229k (4.7% below list) — sets the bar for cash-flow.
- Cap rate 5.9% vs local median 4.9% in Sunrise — meaningfully above typical; check what's discounted (condition, days-on-market, listing class) to confirm the premium yield is real.
Location & tenants
- Location reads 83/100 on livability (#56 in FL, #986 nationally) — a professional / high-income tenant draw. Strengths: commute A+, housing A+, health & safety A+; Watch: employment C-, amenities F.
- Broward (suburban): math 42% / reading 53% proficiency, ranked #46 of 73 in FL (top 63%) — families likely to look elsewhere, expect single-tenant / working-renter base with shorter leases.
- Zoned schools: Nob Hill Elementary School (math 52% / reading 54%, grade C, #963 of 2,144 statewide, top 45%, 541 students, 57% FRL); Bair Middle School (math 23% / reading 38%, grade F, #465 of 571 statewide, top 82%, 766 students, 72% FRL); Piper High School (math 12% / reading 35%, grade F, #533 of 667 statewide, top 80%, 2,310 students, 65% FRL).
- Market conditions: Rents flat; 560 active listings in the ZIP; 40 comparable units currently listed for rent nearby; rentals at typical pace (median 24d on market — plan ~3-4 weeks tenant-placement turnaround); 2,111 units permitted in Broward County in 2024 (1,265 in 5+ unit buildings).
- At $2,866/mo this rent would consume 48% of the median local household income ($72k/yr) (locally 931% of renters already pay >50% of income on rent) — very limited rent-growth headroom before tenants either downsize or default.
Forward outlook
- Local home prices are declining (-3.0%/yr); year-one equity from $2k of loan paydown is wiped out by about $7k of value loss. Plan a longer hold.
- Broward County population projected at +34% by 2050 — long-run rental-demand tailwind backs the buy-and-hold thesis.
Negotiation context
- Only 8 days on market — expect competitive offers; lowballing is unlikely to land.
Risks & watch-outs
- Watch-outs: HOA is 24% of rent.
Questions for the listing agent
- What do current leases actually rent for vs. the listed asking? Can we see a recent rent roll and the last 12 months of T-12 income?
- What does the HOA fee cover, when was the last increase, and are there any pending special assessments or reserve-fund shortfalls?
- Any open or pending special assessments — roof, HVAC, plumbing, elevator, façade? What's the per-unit balance and payoff schedule, and is the seller paying it off at close or rolling it to the buyer?
- Is there a deadline driving the sale (1031 exchange, divorce, estate, relocation)? That informs how much negotiation room exists.
- The area grade is low — what's the realistic commute time and amenity access for the typical tenant pool here? Any planned neighborhood developments (good or bad) we should know about?
- This sits on a lake — are riparian / water-frontage rights deeded with the parcel? Any dock permits, shoreline easements, or HOA water-use restrictions?
- What's the documented flood / surge / shoreline-erosion history here (FEMA AND non-FEMA — e.g., storm surge, creek backup, septic-field saturation)?
- Any water-quality or seasonal algae-bloom issues that affect tenant satisfaction or short-term-rental demand?
- What's the average days-on-market for RENTAL listings here right now (not sales)? A rising rental-DOM trend means longer vacancies and softer asking-rent achievability than the comps imply.
- What's the recent tenant-quality profile in this submarket — average credit score on applications, eviction rate, late-payment / NSF rate, and stable-employment percentage? A property-management company in the area should have these aggregated.
- How much new apartment / multifamily construction is in the pipeline within 1–3 miles? Heavy new supply (>2% of stock underway) typically softens rents 12–24 months out; light construction supports rent growth.
Investment metrics
- 1% rule
- 1.19% ✓
- Cap rate
- 5.90%
- Cash-on-cash
- -1.41%
- DSCR
- 0.94
- GRM
- 7.0
CMA / ARV
No comps found within radius.
Projected returns pro-forma
-3.0% appreciation · 0.6% rent growth · sell at horizon
- IRR
- -22.3%
- Equity multiple
- 0.25×
- Total profit
- $-50,179
- Equity at exit
- $35,770
- IRR
- -28.0%
- Equity multiple
- -0.11×
- Total profit
- $-74,693
- Equity at exit
- $20,742
Cash invested: $67,172 (down + closing). Projections, not guarantees.
Landlord ↔ Tenant lean methodology
- Overall (STATE)
- 87 Strongly Landlord-Friendly
- State Florida
- 87 Strongly Landlord-Friendly · R+3
- County
- — inherits STATE
- City
- — inherits STATE
ZIP-level market 33322
- Home prices YoY
- -33.3%
- Rents YoY
- 0.6%
- Active inventory
- 560
- Price-to-rent
- 7.0×
Monthly cashflow live
- Estimated rent
- $2,866 high interval (Pro) →
- Mortgage (P&I)
- −$1,258
- Tax est. 1.5%
- −$300 /mo · $3,598/yr
- Insurance
- −$100
- HOA
- −$685
- Vacancy / Maint / Mgmt
- −$602
- Net cashflow
- $-79
Break-even live
Sensitivity live
| Price | -10% $87 | -5% $4 | +0% $-79 | +5% $-162 | +10% $-244 |
|---|---|---|---|---|---|
| Rent | -10% $-305 | -5% $-192 | +0% $-79 | +5% $35 | +10% $148 |
| Rate | -1.0pp $42 | -0.5pp $-18 | base $-79 | +0.5pp $-141 | +1.0pp $-204 |
UW: 25.0% down · 7.5% · 30yr · 1.5% tax · 5.0% vac · 8.0% maint · 8.0% mgmt
Financing live
Cash to close
- Down payment
- $59,975
- Closing costs
- $7,197
- Reserves months
- —
- Total cash needed
- —
Loan-product check · same deal, 3 products live
Conventional
25% down · 7.5% · 30yr
- Down + closing
- —
- Monthly P&I
- —
- Monthly cashflow
- —
- DSCR
- —
- Eligible?
- —
Personal DTI + credit; lowest rate.
DSCR
20% down · 8.5% · 30yr
- Down + closing
- —
- Monthly P&I
- —
- Monthly cashflow
- —
- DSCR
- —
- Eligible?
- —
No personal income docs; deal must DSCR.
Hard money
10% down · 12.0% · 12mo
- Down + closing
- —
- Monthly P&I
- —
- Monthly cashflow
- —
- DSCR
- —
- Eligible?
- —
Short-term bridge; refi at stabilization.
Rent comps 40 comps
| Address | Beds | Baths | Sqft | Rent | $/sqft | DOM | Units | Dist |
|---|---|---|---|---|---|---|---|---|
| 2566 N Nob Hill Rd Sunrise, FL | 2.0 | 2.0 | 954 | $2,600 | $2.73 | 0d | 1 | 0.24mi |
| 2698 N Nob Hill Rd Sunrise, FL | 2.0 | 2.0 | 1008 | $2,275 | $2.26 | 26d | 1 | 0.25mi |
| 2734 N Nob Hill Rd Sunrise, FL | 2.0 | 2.0 | 954 | $2,400 | $2.52 | 26d | 1 | 0.26mi |
| 2590 NW 98th Ave Sunrise, FL | 2.0 | 2.0 | 1247 | $3,000 | $2.41 | 3d | 1 | 0.37mi |
| 2590 NW 98th Ave Sunrise, FL | 2.0 | 2.0 | 1247 | $3,000 | $2.41 | 26d | 1 | 0.37mi |
| 2920 NW 99th Ter Sunrise, FL | 3.0 | 2.5 | 1680 | $4,800 | $2.86 | 26d | 1 | 0.38mi |
| 9999 Summerbreeze Dr Sunrise, FL | 1.0–2.0 | 1.0–2.0 | 889 | $2,200 | $2.47 | 20d | 6 | 0.49mi |
| 9999 Summerbreeze Dr Sunrise, FL | 1.0–2.0 | 1.0–2.0 | 889 | $2,200 | $2.47 | 3d | 9 | 0.49mi |
| 9999 Summerbreeze Dr Sunrise, FL | 1.0–2.0 | 1.0–2.0 | 889 | $2,200 | $2.47 | 6d | 9 | 0.49mi |
| 9999 Summerbreeze Dr Sunrise, FL | 1.0–2.0 | 1.0–2.0 | 889 | $2,200 | $2.47 | 3d | 8 | 0.49mi |
| 3160 NW 101st Ave Sunrise, FL | 3.0 | 2.0 | 1780 | $4,000 | $2.25 | 26d | 1 | 0.53mi |
| 10784 NW 23rd Ct Sunrise, FL | 3.0 | 2.0 | 1430 | $3,150 | $2.20 | 13d | 1 | 0.55mi |
| 10758 NW 30th Pl Sunrise, FL | 2.0 | 2.0 | 1074 | $2,200 | $2.05 | 19d | 1 | 0.55mi |
| 9650 NW 24th St Sunrise, FL | 3.0 | 2.0 | 1542 | $3,500 | $2.27 | 9d | 1 | 0.56mi |
| 9650 NW 24th St Sunrise, FL | 3.0 | 2.0 | 1542 | $3,500 | $2.27 | 26d | 1 | 0.56mi |
| 9970 NW 19th Pl Sunrise, FL | 3.0 | 2.5 | 1727 | $3,199 | $1.85 | 26d | 1 | 0.57mi |
| 9521 NW 25th St Sunrise, FL | 3.0 | 2.0 | 1616 | $2,935 | $1.82 | 0d | 1 | 0.60mi |
| 9840 NW 19th Pl Sunrise, FL | 3.0 | 2.5 | 1727 | $3,395 | $1.97 | 26d | 1 | 0.60mi |
| 10131 W Sunrise Blvd #206 Plantation, FL | 2.0 | 2.0 | 963 | $2,200 | $2.28 | 26d | 1 | 0.61mi |
| 9571 Sunset Strip Sunrise, FL | 3.0 | 2.0 | 1418 | $3,450 | $2.43 | 24d | 1 | 0.61mi |
| 9571 Sunset Strip Sunrise, FL | 3.0 | 2.0 | 1418 | $3,450 | $2.43 | 26d | 1 | 0.61mi |
| 2650 NW 94th Way Sunrise, FL | 2.0 | 2.0 | 1200 | $2,900 | $2.42 | 3d | 1 | 0.63mi |
| 2631 NW 94th Ave Sunrise, FL | 2.0 | 2.0 | 1350 | $3,456 | $2.56 | 6d | 1 | 0.65mi |
| 3344 NW 103rd Ave Sunrise, FL | 3.0 | 2.0 | 1512 | $3,100 | $2.05 | 9d | 1 | 0.68mi |
| 10240 NW 33rd Pl Sunrise, FL | 3.0 | 2.0 | 1512 | $2,950 | $1.95 | 26d | 1 | 0.68mi |
| 10105 W Sunrise Blvd #306 Plantation, FL | 2.0 | 2.0 | 963 | $2,300 | $2.39 | 26d | 1 | 0.71mi |
| 9551 NW 19th Pl Fort Lauderdale, FL | 3.0 | 2.0 | 1577 | $3,700 | $2.35 | 24d | 1 | 0.74mi |
| 10161 W Sunrise Blvd #101 Plantation, FL | 2.0 | 2.0 | 963 | $2,500 | $2.60 | 26d | 1 | 0.74mi |
| 10991 NW 30th Pl #10991 Sunrise, FL | 3.0 | 2.0 | 1144 | $2,950 | $2.58 | 26d | 1 | 0.78mi |
| 9100 NW 26th Pl Sunrise, FL | 2.0 | 2.0 | 1047 | $2,995 | $2.86 | 26d | 1 | 0.94mi |
| 9100 NW 26th Pl Sunrise, FL | 3.0 | 2.0 | 1047 | $2,995 | $2.86 | 24d | 1 | 0.94mi |
| 3633 NW 99th Ter Unit 7B Sunrise, FL | 2.0 | 2.0 | 1224 | $2,500 | $2.04 | 9d | 1 | 0.95mi |
| 3633 NW 99th Ter Unit 7B Sunrise, FL | 2.0 | 2.0 | 1224 | $2,500 | $2.04 | 24d | 1 | 0.95mi |
| 10900 NW 17th St Plantation, FL | 1.0–3.0 | 1.0–2.5 | 1270 | $2,344 | $1.85 | 0d | 19 | 0.98mi |
| 9151 W Sunrise Blvd #9151 Plantation, FL | 3.0 | 2.0 | 1482 | $2,750 | $1.86 | 26d | 1 | 0.99mi |
| 9827 NW 37th St Unit 4F Sunrise, FL | 2.0 | 2.0 | 1190 | $2,400 | $2.02 | 26d | 1 | 1.00mi |
| 3531 NW 94th Ave Unit 6B Sunrise, FL | 2.0 | 2.0 | 925 | $1,925 | $2.08 | 16d | 1 | 1.00mi |
| 3571 NW 95th Ter #707 Sunrise, FL | 3.0 | 2.0 | 1241 | $3,100 | $2.50 | 26d | 1 | 1.01mi |
| 3621 NW 95th Ter #523 Sunrise, FL | 2.0 | 2.0 | 970 | $2,150 | $2.22 | 26d | 1 | 1.03mi |
| 9982 Nob Hill Ct #9982 Sunrise, FL | 2.0 | 2.0 | 900 | $2,200 | $2.44 | 14d | 1 | 1.06mi |
HOA detail condo
- Monthly dues
- $685 · $8,220/yr
- Likely covers
- poolgym
- Assessments
- None detected in remarks — confirm with the listing agent.
Listing history 7 events
-
2026-06-21days on market $239,900 Active 8 DOM
-
2026-06-18days on market $239,900 Active 5 DOM
-
2026-06-17days on market $239,900 Active 4 DOM
-
2026-06-16days on market $239,900 Active 3 DOM
-
2026-06-15days on market $239,900 Active 2 DOM
-
2026-06-13remarks 485-char remark
-
2026-06-13$239,900 Active 1 DOM
ⓘ Source: listings_history table (triggers on properties + properties_extension) + one-shot
backfill from property_details.listing_events for pre-trigger history.
Nearby sold comps map
Loading sold comps map…
Walkable amenities ~0.75 mi
Loading nearby amenities…
Taxation est. · year 1
- Rental income
- $34,394
- − Mortgage interest
- −$13,438
- − Property taxes
- −$3,598
- − Insurance
- −$1,200
- − Repairs & maintenance
- −$2,751
- − Management
- −$2,751
- − HOA
- −$8,220
- − Depreciation
- −$6,979
- Taxable loss
- −$4,544
- Est. tax savings @ 24.0%
- +$1,091
- After-tax cash flow
- $147/yr
For passive investors: Depreciation is non-cash, so a rental often shows a tax loss while cash-flowing — sheltering income. Rental losses are passive: they offset passive income freely, and up to $25,000/yr can offset ordinary (W-2) income if you actively participate and your MAGI is under $100k (phasing out to $0 by $150k); unused losses carry forward. On sale, claimed depreciation is recaptured at up to 25%, and gains may owe capital-gains tax (a 1031 exchange can defer both). Figures are a year-1 estimate at your 24.0% rate — not tax advice; consult a CPA.
Condition & rehab AI · 12 photos
This well-maintained townhouse is in good condition with a good ROI potential for both resale and rental.
Value-add opportunities
- Both Paint the exterior — Enhances curb appeal and resale value
- Both Replace the light fixtures — Improves aesthetics and energy efficiency
- Both Install new flooring in bathrooms — Enhances resale and rental value
Renovation cost estimate screening
Value-add ROI direction
- Both Paint the exterior — Enhances curb appeal and resale value ↑
- Both Replace the light fixtures — Improves aesthetics and energy efficiency ↑
- Both Install new flooring in bathrooms — Enhances resale and rental value ↑
ⓘ Cost ranges are severity-bucket heuristics (US national rule-of-thumb). Get contractor quotes + a written scope before underwriting a rehab budget.
Schools (NCES district)
- District
- Broward
- NCES district ID
- 1200180
- Math proficiency
- 42% ▼ -18.00%
- Reading proficiency
- 53% ▼ -5.00%
- Median HH income
- $52,139
- Composite
- 40.88/100
- National rank
- #3621
- State rank
- #46 of 73 in FL
Livability — Sunrise
- Score
- 83/100
- State rank
- #56
- US rank
- #986
Category grades
Schools grade is shown separately in the Schools card above.
Census & demographics
- Census place
- Sunrise, FL
- County
- Broward County · 1,963,430 people
- City population
- 77,492
- Metro
- Miami-Fort Lauderdale-Pompano Beach, FL
- Population (ZIP)
- 41,128
- Household income
- $71,755
- Rent vs Own
- Severe rent burden
- 931.0
Population outlook (Broward County) Hauer SSP2
- Today (2025)
- 2,207,033 people
- By 2030
- 2,360,704 · +7.0%
- By 2040
- 2,661,208 · +20.6%
- By 2050
- 2,946,698 · +33.5%
- By 2075
- 3,602,273 · +63.2%
- By 2100
- 3,970,984 · +79.9%
Race, ethnicity, and origin ACS 2023
- Neighborhood character
- Highly diverse neighborhood (Simpson 0.72)
- Race & ethnicity
- Hispanic / Latino 35% White 32% Black 24% Two or more races 22% Asian 4%
- Hispanic origin (detail)
- Puerto Rican 5% Cuban 6% Dominican 2% Salvadoran 1%
- Common ancestry
- Hispanic 5% Romanian 2% Scotch-Irish 2%
- Foreign-born
- 41% · Canada, Jamaica, South Korea
- Languages at home
- 58% English-only · Spanish 30% French/Haitian/Cajun 6% Other Indo-European 1%
Political lean MEDSL · Broward
- 2024 margin
- D (+17.0) · D 58.0% · R 41.0%
- 2008→2024 swing
- -17.8pp toward R · 2008: 34.7pp · 2024: 17.0pp
- All cycles
- 2024: D+17.0 2020: D+29.8 2016: D+35.0 2012: D+34.9 2008: D+34.7
Not yet ingested
- Civics
- —
Market trends
- HPI YoY
- ▼ -203.34%
- Current HPI
- 407.5452
- Rent YoY
- ▲ 0.60%
- Metro
- Miami-Fort Lauderdale-Pompano Beach, FL
- State GDP YoY
- ▲ 3.28%
- F500 in state
- 36
Industry mix (Fortune 500 HQ in FL)
| Industry | F500 HQs | Revenue |
|---|---|---|
| Industrial Technology | 2 | $29B |
|
||
| Insurance | 2 | $17B |
|
||
| Retail | 1 | $60B |
|
||
| Technology Distribution | 1 | $58B |
|
||
| Homebuilding | 1 | $35B |
|
||
| Technology Manufacturing | 1 | $35B |
|
||
Price history
1 event — show timeline
- 2026-06-13 Listed $239,900 Beaches MLS
Cash-flow waterfall
monthlySold comps — $/sqft
last 12 mo · ≤1 miLoading sold comps…