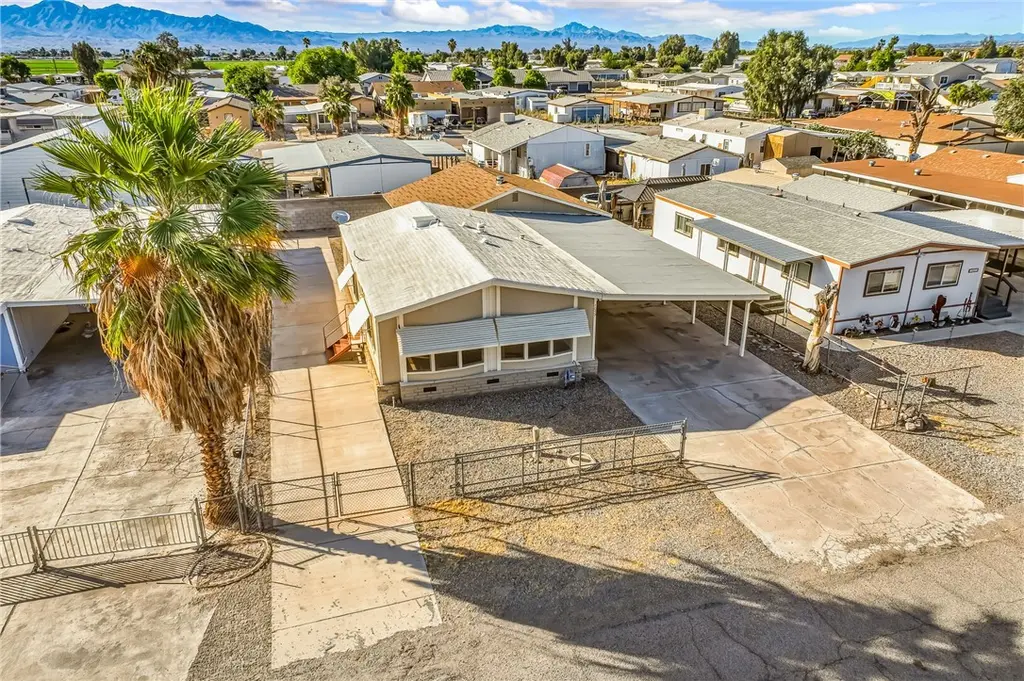
1037 E Spruce Dr · Willow Valley, AZ
Flood risk 1/10 · Minimal
- FEMA flood zone
- X (shaded)
- Chance of flooding over 30 yrs
- 0.0%
- Est. flood insurance / yr
- $507 – $1,088
Fire risk 4/10 · Minor
- Est. fire insurance / yr
- $610 – $1,132
Heat risk 9/10 · Severe
- Hot days now (above 117°F)
- 7 days/yr
- Hot days in 30 yrs
- 17 days/yr
Wind risk 1/10 · Minimal
- Chance of severe wind over 30 yrs
- —
Air-quality risk 1/10 · Minimal
- Unhealthy air days now
- 0 days/yr
- Unhealthy air days in 30 yrs
- 0 days/yr
Risk factors via First Street. Map © Google.
Why this score? — see what drove the F grade
The composite is a weighted blend of 9 inputs, each scored 0–100. Each bar is that input's sub-score; the figure is the points it added to the 100-point composite (weight × sub-score).
- Cash flow +10.2/30.0
- Appreciation +10.0/10.0
- Livability +3.0/5.0
- DSCR +2.9/10.0
- Rent growth +2.5/5.0
- Condition / age +2.5/5.0
- 1% rule +1.9/10.0
- Schools +1.3/10.0
- ARV discount +0.0/15.0
$262,000
🖨 Deal sheet (PDF) 📄 Offer letter ✓ Due diligence
Key facts
- 6,098 sq ft lot
- 2 garage spots
- Built 1985
Property features AI
Finance
- Other: Zoned R1 Single-Family Residential
- HOA & community: Homeowners association with an annual fee of $200 (about $16.67/month)
Exterior
- Parking: Attached garage with 2 spaces; 1-space carport
- Utilities: Septic tank
- Home design: Single-family residence; Residential property; Open entry with vaulted ceiling
- Construction: Shingle roof
- Exterior features: Chain link fencing; Paved road access; No pool
Interior
- Kitchen: Electric oven; Electric range; Water heater
- Bathrooms: 1 full bathroom; 2 three-quarter bathrooms
- Heating & cooling: Central heating (electric); Central air conditioning (electric)
- Interior features: Open floor plan; Vaulted ceilings
Neighborhood map
What this means for you Summary
Snapshot
- This is a 3-bed/3.0-bath manufactured listed at $262k.
Deal economics
- At list price, monthly cash flow is $-148 ($-2k/yr) — negative.
- To cash-flow at today's rent, offer at most $236k (10.0% below list).
- To meet the 1% rule (rent ≥ 1% of price), the offer needs to be $180k (31.3% below list).
- Recommended offer: $180k (31.3% below list) — sets the bar for 1% rule.
Location & tenants
- Location reads 60/100 on livability (#170 in AZ) — a middle-class / working-renter tenant base. Strengths: cost of living A+, housing A-; Watch: health & safety C-, crime D, amenities F.
- Colorado River Union High School District (4381) (town): math 13% / reading 17% proficiency, ranked #213 of 249 in AZ (top 86%) — low school quality limits family demand, transient renter base, plan for 1-2y turnover.
- Zoned schools: Camp Mohave Elementary School (math 29% / reading 40%, grade F, #471 of 1,109 statewide, top 44%, 375 students, 66% FRL); Mohave Valley Junior High School (math 28% / reading 31%, grade F, #84 of 218 statewide, top 41%, 448 students, 55% FRL); River Valley High School (math 12% / reading 12%, grade F, #287 of 381 statewide, top 76%, 545 students, 50% FRL).
- Market conditions: 223 active listings in the ZIP; 1 comparable units currently listed for rent nearby; 2,543 units permitted in Mohave County in 2024 (33 in 5+ unit buildings).
Forward outlook
- In year one you build about $28k of equity ($2k loan paydown + $26k appreciation (10.0% local appreciation)).
- Mohave County population projected to shrink 6% by 2050 — rents likely to lag national; underwrite the cash flow, not the appreciation.
- By year 2, paydown + projected appreciation supports a ~$45k cash-out refi (75% LTV) — recoverable capital for the next deal without selling this one.
Negotiation context
- Only 11 days on market — expect competitive offers; lowballing is unlikely to land.
- 2 sale attempts with the ask held roughly flat each time — persistent listings suggest the price (not the market) is what's stuck; bring a comps-based counter.
- Current owner paid $82k; list at $262k implies a 220% gain — meaningful room to come down on a strong offer.
Risks & watch-outs
- Climate carrying-cost: extreme-heat days projected 7→17/yr by 2055 (HVAC capex compounding) — expect insurance premiums to compound above CPI over the hold.
Questions for the listing agent
- What do current leases actually rent for vs. the listed asking? Can we see a recent rent roll and the last 12 months of T-12 income?
- What does the HOA fee cover, when was the last increase, and are there any pending special assessments or reserve-fund shortfalls?
- Is there a deadline driving the sale (1031 exchange, divorce, estate, relocation)? That informs how much negotiation room exists.
- Schools are F-rated, which usually means shorter tenancies and higher turnover. Who's the typical renter profile here, and what's been the actual vacancy rate?
- Crime grade is D in this area — have there been break-ins, vandalism, or insurance claims at this property in the last 3 years? What carrier currently insures it and at what premium?
- The area grade is low — what's the realistic commute time and amenity access for the typical tenant pool here? Any planned neighborhood developments (good or bad) we should know about?
- What's the average days-on-market for RENTAL listings here right now (not sales)? A rising rental-DOM trend means longer vacancies and softer asking-rent achievability than the comps imply.
- What's the recent tenant-quality profile in this submarket — average credit score on applications, eviction rate, late-payment / NSF rate, and stable-employment percentage? A property-management company in the area should have these aggregated.
- How much new for-sale + rental construction is in the pipeline within 1–3 miles? Heavy new supply typically softens prices + rents 12–24 months out; constrained supply supports both.
Investment metrics
- 1% rule
- 0.69% ✗
- Cap rate
- 5.62%
- Cash-on-cash
- -2.42%
- DSCR
- 0.89
- GRM
- 12.1
CMA / ARV
- ARV (on-the-fly)
- $196,800
- Comps found
- 2
Show comp detail 2 sales within ~0.75 mi
| Address | Dist | Beds/Ba | Sqft | Sold | Price | $/sf | Match |
|---|---|---|---|---|---|---|---|
| 8025 S Green Valley Rd | 0.52mi | 2/1.0 (-1) | 900 (-6%) | 1mo | $132,000 | $147 | 51 |
| 8105 S Evergreen Dr | 0.38mi | 2/1.0 (-1) | 1,025 (+7%) | 20mo | $210,000 | $205 | 41 |
Match score weights: distance 35% · size 25% · config 20% · recency 20%. Top-matched comps best support the ARV.
Projected returns pro-forma
10.0% appreciation · 3.0% rent growth · sell at horizon
- IRR
- 22.5%
- Equity multiple
- 2.82×
- Total profit
- $133,156
- Equity at exit
- $236,030
- IRR
- 20.2%
- Equity multiple
- 6.44×
- Total profit
- $399,286
- Equity at exit
- $509,008
Cash invested: $73,360 (down + closing). Projections, not guarantees.
Landlord ↔ Tenant lean methodology
- Overall (STATE)
- 87 Strongly Landlord-Friendly
- State Arizona
- 87 Strongly Landlord-Friendly · R+3
- County
- — inherits STATE
- City
- — inherits STATE
ZIP-level market 86440
- Home prices YoY
- 4.2%
- Active inventory
- 223
- Price-to-rent
- 12.1×
Monthly cashflow live
- Estimated rent
- $1,800 medium interval (Pro) →
- Mortgage (P&I)
- −$1,374
- Tax from tax record
- −$70 /mo · $836/yr
- Insurance
- −$109
- HOA
- −$17
- Vacancy / Maint / Mgmt
- −$378
- Net cashflow
- $-148
Break-even live
Sensitivity live
| Price | -10% $0 | -5% $-74 | +0% $-148 | +5% $-222 | +10% $-296 |
|---|---|---|---|---|---|
| Rent | -10% $-290 | -5% $-219 | +0% $-148 | +5% $-77 | +10% $-6 |
| Rate | -1.0pp $-16 | -0.5pp $-81 | base $-148 | +0.5pp $-216 | +1.0pp $-285 |
UW: 25.0% down · 7.5% · 30yr · 1.5% tax · 5.0% vac · 8.0% maint · 8.0% mgmt
Financing live
Cash to close
- Down payment
- $65,500
- Closing costs
- $7,860
- Reserves months
- —
- Total cash needed
- —
Loan-product check · same deal, 3 products live
Conventional
25% down · 7.5% · 30yr
- Down + closing
- —
- Monthly P&I
- —
- Monthly cashflow
- —
- DSCR
- —
- Eligible?
- —
Personal DTI + credit; lowest rate.
DSCR
20% down · 8.5% · 30yr
- Down + closing
- —
- Monthly P&I
- —
- Monthly cashflow
- —
- DSCR
- —
- Eligible?
- —
No personal income docs; deal must DSCR.
Hard money
10% down · 12.0% · 12mo
- Down + closing
- —
- Monthly P&I
- —
- Monthly cashflow
- —
- DSCR
- —
- Eligible?
- —
Short-term bridge; refi at stabilization.
Rent comps 1 comps
| Address | Beds | Baths | Sqft | Rent | $/sqft | DOM | Units | Dist |
|---|---|---|---|---|---|---|---|---|
| 7866 S Meadowlark St Mohave Valley, AZ | 3.0 | 2.0 | 1040 | $1,800 | $1.73 | 15d | 1 | 0.87mi |
HOA detail
- Monthly dues
- $17 · $204/yr
Listing history 7 events
-
2026-05-21status Pending
-
2026-05-11status Active
-
2026-04-29status Pending
-
2026-04-28$262,000 Active
-
2001-12-14soldstatus $82,000
-
1993-08-20soldstatus $69,000
-
1990-03-16soldstatus $62,000
ⓘ Source: listings_history table (triggers on properties + properties_extension) + one-shot
backfill from property_details.listing_events for pre-trigger history.
Tax reassessment forecast AZ · Resets to sale price
- Current annual tax
- $836 · $70/mo
- Projected year-2 tax
- $1,729 · $144/mo
- Expected delta
- +$893/yr (+$74/mo · 106.7%)
ⓘ Screening estimate from a state-policy table — verify with the county assessor before closing.
Climate risk First Street
- Flood 1/10 Low FEMA zone X (shaded) · 0% chance over 30 yrs
- Wildfire 4/10 Moderate
- Heat 9/10 Extreme 7 d/yr ≥117°F today · 17 d/yr by 30 yrs out
- Wind 1/10 Low
- Air quality 1/10 Low 0 unhealthy d/yr today · 0 by 30 yrs out
Nearby sold comps map
Loading sold comps map…
Walkable amenities ~0.75 mi
Loading nearby amenities…
Taxation est. · year 1
- Rental income
- $21,600
- − Mortgage interest
- −$14,676
- − Property taxes
- −$836
- − Insurance
- −$1,310
- − Repairs & maintenance
- −$1,728
- − Management
- −$1,728
- − HOA
- −$204
- − Depreciation
- −$7,622
- Taxable loss
- −$6,504
- Est. tax savings @ 24.0%
- +$1,561
- After-tax cash flow
- $-213/yr
For passive investors: Depreciation is non-cash, so a rental often shows a tax loss while cash-flowing — sheltering income. Rental losses are passive: they offset passive income freely, and up to $25,000/yr can offset ordinary (W-2) income if you actively participate and your MAGI is under $100k (phasing out to $0 by $150k); unused losses carry forward. On sale, claimed depreciation is recaptured at up to 25%, and gains may owe capital-gains tax (a 1031 exchange can defer both). Figures are a year-1 estimate at your 24.0% rate — not tax advice; consult a CPA.
Schools (NCES district)
- District
- Colorado River Union High School District (4381)
- NCES district ID
- 0400082
- Math proficiency
- 13% ▼ -17.00%
- Reading proficiency
- 17% ▼ -18.00%
- Median HH income
- $39,132
- Composite
- 12.72/100
- National rank
- #9603
- State rank
- #213 of 249 in AZ
Livability — Willow Valley
- Score
- 60/100
- State rank
- #170
- US rank
- #18589
Category grades
Schools grade is shown separately in the Schools card above.
Census & demographics
- Census place
- Willow Valley, AZ
- Population (ZIP)
- 8,403
Population outlook (Mohave County) Hauer SSP2
- Today (2025)
- 209,184 people
- By 2030
- 209,674 · +0.2%
- By 2040
- 205,897 · -1.6%
- By 2050
- 196,810 · -5.9%
- By 2075
- 169,454 · -19.0%
- By 2100
- 136,630 · -34.7%
Race, ethnicity, and origin ACS 2023
- Neighborhood character
- Predominantly White (73%)
- Race & ethnicity
- White 73% Hispanic / Latino 20% Two or more races 11% Native American 4%
- Hispanic origin (detail)
- Mexican 11%
- Common ancestry
- Lithuanian 3% Iranian 2% Italian 2%
- Foreign-born
- 1% · Canada
- Languages at home
- 96% English-only · Spanish 3%
Political lean MEDSL · Mohave
- 2024 margin
- Solid R (+55.8) · D 21.8% · R 77.6%
- 2008→2024 swing
- -22.9pp toward R · 2008: -32.9pp · 2024: -55.8pp
- All cycles
- 2024: R+55.8 2020: R+51.3 2016: R+51.5 2012: R+42.6 2008: R+32.9
Not yet ingested
- Civics
- —
Market trends
- HPI YoY
- ▲ 13.05%
- Current HPI
- 322.7772
- Rent YoY
- —
- Metro
- —
- State GDP YoY
- ▲ 4.54%
- F500 in state
- 20
Industry mix (Fortune 500 HQ in AZ)
| Industry | F500 HQs | Revenue |
|---|---|---|
| Technology | 2 | $13B |
|
||
| Mining / Metals | 1 | $23B |
|
||
| Environmental Services | 1 | $16B |
|
||
| Metals / Steel | 1 | $14B |
|
||
| Technology Distribution | 1 | $9B |
|
||
| Homebuilding | 1 | $8B |
|
||
Price history
+322.6% since first listed7 events — show timeline
- 2026-05-21 Pending — WARDEX
- 2026-05-11 Relisted — WARDEX
- 2026-04-29 Pending — WARDEX
- 2026-04-28 Listed $262,000 WARDEX
- 2001-12-14 Sold (Public Records) $82,000 Public Records
- 1993-08-20 Sold (Public Records) $69,000 Public Records
- 1990-03-16 Sold (Public Records) $62,000 Public Records
Property tax history
+2.1%/yrLatest (2025): $836 · +13.5% YoY. Source: county tax records.
Cash-flow waterfall
monthlySold comps — $/sqft
last 12 mo · ≤1 miLoading sold comps…