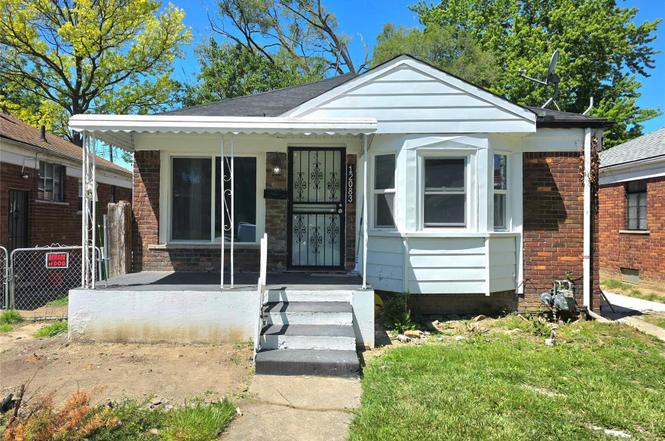
12083 Stahelin Ave · Detroit, MI
Flood risk 1/10 · Minimal
- FEMA flood zone
- X (unshaded)
- Chance of flooding over 30 yrs
- 0.0%
- Est. flood insurance / yr
- $473 – $860
Fire risk 1/10 · Minimal
- Est. fire insurance / yr
- $784 – $1,456
Heat risk 3/10 · Minor
- Hot days now (above 99°F)
- 7 days/yr
- Hot days in 30 yrs
- 15 days/yr
Wind risk 2/10 · Minimal
- Chance of severe wind over 30 yrs
- —
Air-quality risk 3/10 · Minor
- Unhealthy air days now
- 2 days/yr
- Unhealthy air days in 30 yrs
- 5 days/yr
Risk factors via First Street. Map © Google.
Why this score? — see what drove the D+ grade
The composite is a weighted blend of 9 inputs, each scored 0–100. Each bar is that input's sub-score; the figure is the points it added to the 100-point composite (weight × sub-score).
- Cash flow +23.2/30.0
- DSCR +7.4/10.0
- 1% rule +6.5/10.0
- Livability +3.7/5.0
- Condition / age +2.5/5.0
- Rent growth +1.9/5.0
- Schools +1.3/10.0
- ARV discount +0.0/15.0
- Appreciation +0.0/10.0
$109,900
🖨 Deal sheet (PDF) 📄 Offer letter ✓ Due diligence
Listing remarks MLS
* * HOMEBUYERS & INVESTORS * * This 3 bedroom, 1 bathroom brick ranch is located in the Franklin Park neighborhood and would be perfect for either a first-time homebuyer looking for an updated & cost effective home OR for an investor looking to expand their rental portfolio with a turn-key property! With Sec 8 rents for this property as high as $1,350/month, it could be a cash-flow monster for you! Recent updates include new vinyl windows, a newer furnace and HWT, new exterior doors, updated PEX plumbing, an updated kitchen w/ ceramic floor tile & stainless steel appliances, and updated full bathroom w/ ceramic floor and shower tile, a new vanity, and a new toilet, new vinyl plank flooring throughout the rest of the house, new light fixtures, fresh paint, leveled out & repaired driveway, and so much more! Also check out the refinished and freshly painted basement, complete with new glass block windows! Located conveniently close to both the I-96 and Southfield freeways! FHA & VA WELCOME, NO SELLER FINANCING!
Key facts
- Updated pex plumbing
- Newer furnace
- Ceramic floor tile
Tags
Property features AI
Finance
- Other: Lot approximately 0.1 acres (36 x 143)
Exterior
- Parking: No garage
- Utilities: Public water; Public sewer; Circuit breaker electrical service; Cable available; Underground utilities; Water and sewer available
- Home design: Single-family residence; One story; Ground-level entry with steps; Brick construction
- Construction: Asphalt roof
- Exterior features: Paved road access; No pool
Interior
- Kitchen: Free-standing gas oven; Free-standing refrigerator; Gas water heater
- Bedrooms: Total of 6 rooms (bedrooms/other rooms included)
- Bathrooms: 1 full bathroom; 1 half bathroom
- Heating & cooling: Forced air heating (natural gas); No central cooling
- Interior features: Unfurnished; Unfinished basement
- Laundry & utility: Gas water heater
Neighborhood map
What this means for you Summary
Snapshot
- This is a 3-bed/1.0-bath single-family listed at $110k.
Deal economics
- At list price, monthly cash flow is $199 ($2k/yr) — positive.
- The deal already cash-flows at list — no discount required.
- Meets the 1% rule at list price ($1k rent vs $110k).
- Recommended offer: $107k (3.0% below list) — sets the bar for market timing.
Location & tenants
- Location reads 73/100 on livability (#218 in MI) — a middle-class / working-renter tenant base. Strengths: amenities A+, commute A+, cost of living A+; Watch: crime F, employment F.
- Detroit Public Schools Community District (urban): math 10% / reading 24% proficiency, ranked #499 of 540 in MI (top 92%) — low school quality limits family demand, transient renter base, plan for 1-2y turnover; 90% free/reduced lunch — lower-income household profile, screen leases tightly.
- Zoned schools: Henderson Academy (math 10% / reading 10%, grade F, #1,230 of 1,397 statewide, top 91%, 520 students, 91% FRL); Cody High School (math 24% / reading 24%, grade F, #481 of 713 statewide, top 81%, 466 students, 88% FRL) — zoned schools at 89% FRL track the district average.
- Market conditions: Rents soft (-2.3%/yr); 367 active listings in the ZIP; 40 comparable units currently listed for rent nearby; rentals lingering (median 46d on market — plan ~5-8 weeks vacancy on turnover, expect pricing pressure); 58% of comp listings sitting > 30 days — soft ceiling on asking rent; lower-income renter base — watch delinquency; 2,639 units permitted in Wayne County in 2024 (1,216 in 5+ unit buildings).
- At $1,261/mo this rent would consume 49% of the median local household income ($31k/yr) (locally 4144% of renters already pay >50% of income on rent) — very limited rent-growth headroom before tenants either downsize or default.
Forward outlook
- Local home prices are declining (-3.0%/yr); year-one equity from $760 of loan paydown is wiped out by about $3k of value loss. Plan a longer hold.
- Wayne County population projected at -17% by 2050 — secular population decline; favor cash flow + early exit over multi-decade hold.
Negotiation context
- It's been on market 43 days — a 3% lower offer ($107k) is reasonable based on typical stale-listing flexibility.
- 8 sale attempts since 4y ago; this cycle's ask is 10% above the opening price — seller raised mid-cycle; expect resistance to lowballs.
- Current owner paid $32k; list at $110k implies a 241% gain — meaningful room to come down on a strong offer.
Risks & watch-outs
- Watch-outs: built in 1950 — expect roof / HVAC / electrical / plumbing capex.
Questions for the listing agent
- It's been on market 43 days. Have you received any prior offers? Is the seller open to a 3% concession, seller financing, or rate buy-down credit?
- Built in 1950 — when were the roof, HVAC, electrical panel, plumbing, and water heater last replaced?
- Is there a deadline driving the sale (1031 exchange, divorce, estate, relocation)? That informs how much negotiation room exists.
- Schools are F-rated, which usually means shorter tenancies and higher turnover. Who's the typical renter profile here, and what's been the actual vacancy rate?
- Crime grade is F in this area — have there been break-ins, vandalism, or insurance claims at this property in the last 3 years? What carrier currently insures it and at what premium?
- The area grade is low — what's the realistic commute time and amenity access for the typical tenant pool here? Any planned neighborhood developments (good or bad) we should know about?
- What's the average days-on-market for RENTAL listings here right now (not sales)? A rising rental-DOM trend means longer vacancies and softer asking-rent achievability than the comps imply.
- What's the recent tenant-quality profile in this submarket — average credit score on applications, eviction rate, late-payment / NSF rate, and stable-employment percentage? A property-management company in the area should have these aggregated.
- How much new for-sale + rental construction is in the pipeline within 1–3 miles? Heavy new supply typically softens prices + rents 12–24 months out; constrained supply supports both.
Investment metrics
- 1% rule
- 1.15% ✓
- Cap rate
- 8.46%
- Cash-on-cash
- 7.75%
- DSCR
- 1.34
- GRM
- 7.3
CMA / ARV
- ARV (on-the-fly)
- $76,107
- Comps found
- 12
Show comp detail 12 sales within ~0.75 mi
| Address | Dist | Beds/Ba | Sqft | Sold | Price | $/sf | Match |
|---|---|---|---|---|---|---|---|
| 11658 Ashton Ave | 0.44mi | 3/1.0 | 1,080 (-2%) | 0mo | $89,000 | $82 | 76 |
| 11646 Glastonbury Ave | 0.20mi | 3/2.0 | 1,189 (+8%) | 4mo | $50,000 | $42 | 70 |
| 13523 Faust Ave | 0.66mi | 3/1.0 | 1,098 (-0%) | 2mo | $55,000 | $50 | 67 |
| 10006 Auburn St | 0.60mi | 3/1.0 | 1,150 (+4%) | 1mo | $63,000 | $55 | 64 |
| 9934 Warwick St | 0.53mi | 3/1.0 | 1,018 (-8%) | 2mo | $70,000 | $69 | 61 |
| 9976 Warwick St | 0.49mi | 3/1.5 | 1,024 (-7%) | 4mo | $129,900 | $127 | 60 |
| 9608 Piedmont St | 0.64mi | 3/1.0 | 1,048 (-5%) | 4mo | $74,900 | $71 | 58 |
| 9977 Evergreen Ave | 0.74mi | 3/1.0 | 1,150 (+4%) | 2mo | $86,000 | $75 | 57 |
| 11700 Auburn St | 0.42mi | 3/1.5 | 964 (-13%) | 3mo | $55,000 | $57 | 55 |
| 13538 Penrod St | 0.70mi | 3/1.0 | 1,026 (-7%) | 3mo | $95,000 | $93 | 53 |
| 9570 Westwood St | 0.71mi | 3/1.0 | 1,188 (+8%) | 1mo | $80,000 | $67 | 53 |
| 12950 Glastonbury Ave | 0.60mi | 3/1.0 | 958 (-13%) | 4mo | $40,000 | $42 | 47 |
Match score weights: distance 35% · size 25% · config 20% · recency 20%. Top-matched comps best support the ARV.
Projected returns pro-forma
-3.0% appreciation · 0.0% rent growth · sell at horizon
- IRR
- -8.0%
- Equity multiple
- 0.71×
- Total profit
- $-8,806
- Equity at exit
- $16,386
- IRR
- -3.1%
- Equity multiple
- 0.82×
- Total profit
- $-5,480
- Equity at exit
- $9,502
Cash invested: $30,772 (down + closing). Projections, not guarantees.
Landlord ↔ Tenant lean methodology
- Overall (STATE)
- 62 Landlord-Friendly
- State Michigan
- 62 Landlord-Friendly · EVEN
- County
- — inherits STATE
- City
- — inherits STATE
ZIP-level market 48228
- Rents YoY
- -2.3%
- Active inventory
- 367
- Price-to-rent
- 7.3×
Monthly cashflow live
- Estimated rent
- $1,261 high interval (Pro) →
- Mortgage (P&I)
- −$576
- Tax from tax record
- −$175 /mo · $2,102/yr
- Insurance
- −$46
- HOA
- −$0
- Lot rent
- −$0
- Vacancy / Maint / Mgmt
- −$265
- Net cashflow
- $199
Break-even live
Sensitivity live
| Price | -10% $261 | -5% $230 | +0% $199 | +5% $168 | +10% $136 |
|---|---|---|---|---|---|
| Rent | -10% $99 | -5% $149 | +0% $199 | +5% $248 | +10% $298 |
| Rate | -1.0pp $254 | -0.5pp $227 | base $199 | +0.5pp $170 | +1.0pp $141 |
UW: 25.0% down · 7.5% · 30yr · 1.5% tax · 5.0% vac · 8.0% maint · 8.0% mgmt
Financing live
Cash to close
- Down payment
- $27,475
- Closing costs
- $3,297
- Reserves months
- —
- Total cash needed
- —
Loan-product check · same deal, 3 products live
Conventional
25% down · 7.5% · 30yr
- Down + closing
- —
- Monthly P&I
- —
- Monthly cashflow
- —
- DSCR
- —
- Eligible?
- —
Personal DTI + credit; lowest rate.
DSCR
20% down · 8.5% · 30yr
- Down + closing
- —
- Monthly P&I
- —
- Monthly cashflow
- —
- DSCR
- —
- Eligible?
- —
No personal income docs; deal must DSCR.
Hard money
10% down · 12.0% · 12mo
- Down + closing
- —
- Monthly P&I
- —
- Monthly cashflow
- —
- DSCR
- —
- Eligible?
- —
Short-term bridge; refi at stabilization.
Rent comps 40 comps
| Address | Beds | Baths | Sqft | Rent | $/sqft | DOM | Units | Dist |
|---|---|---|---|---|---|---|---|---|
| 11704 Greenview Ave Detroit, MI | 4.0 | 1.0 | 1046 | $1,300 | $1.24 | 26d | 1 | 0.19mi |
| 11741 Penrod St Detroit, MI | 3.0 | 1.0 | 1124 | $1,400 | $1.25 | 19d | 1 | 0.27mi |
| 12084 Vaughan St Detroit, MI | 3.0 | 1.0 | 1000 | $1,200 | $1.20 | 19d | 1 | 0.58mi |
| 12875 Faust Ave Detroit, MI | 2.0 | 1.0 | 735 | $1,200 | $1.63 | 7d | 1 | 0.58mi |
| 12950 Glastonbury Ave Detroit, MI | 3.0 | 1.0 | 1000 | $1,400 | $1.40 | 26d | 1 | 0.63mi |
| 19050 W Davison St Detroit, MI | 3.0 | 1.0 | 1118 | $1,400 | $1.25 | 46d | 1 | 0.65mi |
| 13514 Stahelin Ave Detroit, MI | 3.0 | 1.0 | 1000 | $1,400 | $1.40 | 20d | 1 | 0.66mi |
| 12941 Penrod St Detroit, MI | 2.0 | 1.0 | 1000 | $1,275 | $1.27 | 46d | 1 | 0.67mi |
| 12944 Rosemont Ave Detroit, MI | 2.0 | 1.0 | 800 | $1,050 | $1.31 | 7d | 1 | 0.71mi |
| 18450 W Chicago Detroit, MI | 1.0–2.0 | 1.0 | 687 | $1,111 | $1.62 | 0d | 15 | 0.72mi |
| 13591 Faust Ave Detroit, MI | 2.0 | 1.0 | 1000 | $1,275 | $1.27 | 46d | 1 | 0.75mi |
| 19440 W Chicago St Detroit, MI | 3.0 | 1.5 | 1200 | $1,225 | $1.02 | 20d | 1 | 0.76mi |
| 19440 W Chicago St Detroit, MI | 3.0 | 1.5 | 1200 | $1,225 | $1.02 | 24d | 1 | 0.76mi |
| 13581 Penrod St Detroit, MI | 4.0 | 1.0 | 1152 | $1,200 | $1.04 | 46d | 1 | 0.76mi |
| 11652 Fielding St Detroit, MI | 3.0 | 1.0 | 1000 | $1,386 | $1.39 | 46d | 1 | 0.78mi |
| 19449 W Chicago St Detroit, MI | 3.0 | 1.5 | 950 | $1,500 | $1.58 | 46d | 1 | 0.79mi |
| 13600 Southfield Fwy Detroit, MI | 2.0 | 1.0 | 848 | $1,100 | $1.30 | 7d | 1 | 0.88mi |
| 10030 Abington Ave Detroit, MI | 4.0 | 2.0 | 1350 | $1,475 | $1.09 | 13d | 1 | 0.88mi |
| 13500 Heyden St Detroit, MI | 2.0 | 1.0 | 850 | $1,200 | $1.41 | 46d | 1 | 0.90mi |
| 12711 Grandmont Ave Detroit, MI | 3.0 | 1.0 | 1000 | $1,400 | $1.40 | 20d | 1 | 0.92mi |
| 9090 Stahelin Ave Detroit, MI | 2.0 | 1.0 | 787 | $1,250 | $1.59 | 46d | 1 | 0.98mi |
| 12840 Grandmont Ave Detroit, MI | 3.0 | 1.0 | 1100 | $1,200 | $1.09 | 46d | 1 | 0.99mi |
| 20522 W Chicago Detroit, MI | 2.0 | 1.0 | 1000 | $950 | $0.95 | 46d | 1 | 1.06mi |
| 20550 W Chicago Detroit, MI | 2.0 | 1.0 | 1000 | $900 | $0.90 | 46d | 1 | 1.08mi |
| 20529 W Chicago Detroit, MI | 2.0 | 1.0 | 1000 | $900 | $0.90 | 46d | 1 | 1.08mi |
| 9401 Fielding St Detroit, MI | 2.0 | 1.0 | 1000 | $900 | $0.90 | 46d | 1 | 1.08mi |
| 20541 W Chicago Detroit, MI | 2.0 | 1.0 | 1000 | $900 | $0.90 | 46d | 1 | 1.09mi |
| 20545 W Chicago Detroit, MI | 2.0 | 1.0 | 1000 | $900 | $0.90 | 46d | 1 | 1.09mi |
| 20547 W Chicago Detroit, MI | 2.0 | 1.0 | 1000 | $900 | $0.90 | 46d | 1 | 1.09mi |
| 9410 Patton St Detroit, MI | 2.0 | 1.0 | 1000 | $900 | $0.90 | 46d | 1 | 1.09mi |
| 9108 Archdale St Detroit, MI | 3.0 | 1.0 | 1000 | $1,300 | $1.30 | 7d | 1 | 1.10mi |
| 9404 Patton St Detroit, MI | 2.0 | 1.0 | 1000 | $900 | $0.90 | 46d | 1 | 1.10mi |
| 20619 W Chicago Detroit, MI | 2.0 | 1.0 | 950 | $1,200 | $1.26 | 46d | 1 | 1.12mi |
| 11641 Mansfield St Unit 2 Detroit, MI | 3.0 | 1.0 | 1449 | $1,300 | $0.90 | 46d | 1 | 1.14mi |
| 8850 Rosemont Ave Detroit, MI | 3.0 | 1.0 | 933 | $1,100 | $1.18 | 20d | 1 | 1.19mi |
| 14258 Plainview Ave Detroit, MI | 3.0 | 1.0 | 918 | $1,200 | $1.31 | 46d | 1 | 1.21mi |
| 14347 Westwood St Detroit, MI | 2.0 | 1.0 | 706 | $1,200 | $1.70 | 26d | 1 | 1.21mi |
| 19301 Joy Rd Apt 1 Detroit, MI | 2.0 | 1.0 | 750 | $1,100 | $1.47 | 46d | 1 | 1.23mi |
| 9589 Mansfield St Detroit, MI | 4.0 | 1.0 | 1250 | $1,500 | $1.20 | 7d | 1 | 1.28mi |
| 20921 W Chicago Detroit, MI | 2.0 | 1.0 | 1000 | $950 | $0.95 | 46d | 1 | 1.28mi |
Listing history 12 events
-
2026-06-22days on market $109,900 Active 43 DOM
-
2026-06-21days on market $109,900 Active 42 DOM
-
2026-06-18days on market $109,900 Active 39 DOM
-
2026-06-17days on market $109,900 Active 38 DOM
-
2026-06-15days on market $109,900 Active 36 DOM
-
2026-06-13days on market $109,900 Active 34 DOM
-
2026-06-13days on market $109,900 Active 33 DOM
-
2026-06-09days on market $109,900 Active 30 DOM
-
2026-06-08days on market $109,900 Active 29 DOM
-
2026-06-07days on market $109,900 Active 28 DOM
-
2026-06-04remarks 687-char remark
-
2026-06-04$109,900 Active 25 DOM
ⓘ Source: listings_history table (triggers on properties + properties_extension) + one-shot
backfill from property_details.listing_events for pre-trigger history.
Tax reassessment forecast MI · Partial reset (capped growth)
- Current annual tax
- $2,102 · $175/mo
- Projected year-2 tax
- $2,102 · $175/mo
- Expected delta
- $0/yr ($0/mo · 0.0%)
ⓘ Screening estimate from a state-policy table — verify with the county assessor before closing.
Climate risk First Street
- Flood 1/10 Low FEMA zone X (unshaded) · 0% chance over 30 yrs
- Wildfire 1/10 Low
- Heat 3/10 Moderate 7 d/yr ≥99°F today · 15 d/yr by 30 yrs out
- Wind 2/10 Low
- Air quality 3/10 Moderate 2 unhealthy d/yr today · 5 by 30 yrs out
Nearby sold comps map
Loading sold comps map…
Walkable amenities ~0.75 mi
Loading nearby amenities…
Taxation est. · year 1
- Rental income
- $15,129
- − Mortgage interest
- −$6,156
- − Property taxes
- −$2,102
- − Insurance
- −$550
- − Repairs & maintenance
- −$1,210
- − Management
- −$1,210
- − Depreciation
- −$3,197
- Taxable income
- $703
- Est. tax owed @ 24.0%
- −$169
- After-tax cash flow
- $2,215/yr
For passive investors: Depreciation is non-cash, so a rental often shows a tax loss while cash-flowing — sheltering income. Rental losses are passive: they offset passive income freely, and up to $25,000/yr can offset ordinary (W-2) income if you actively participate and your MAGI is under $100k (phasing out to $0 by $150k); unused losses carry forward. On sale, claimed depreciation is recaptured at up to 25%, and gains may owe capital-gains tax (a 1031 exchange can defer both). Figures are a year-1 estimate at your 24.0% rate — not tax advice; consult a CPA.
Schools (NCES district)
- District
- Detroit Public Schools Community District
- NCES district ID
- 2601103
- Math proficiency
- 10% ▼ -2.00%
- Reading proficiency
- 24% ▲ 6.00%
- Median HH income
- $25,815
- Composite
- 13.06/100
- National rank
- #9564
- State rank
- #499 of 540 in MI
Livability — Detroit
- Score
- 73/100
- State rank
- #218
- US rank
- #5427
Category grades
Schools grade is shown separately in the Schools card above.
Census & demographics
- Census place
- Detroit, MI
- County
- Wayne County · 1,562,939 people
- City population
- 572,865
- Metro
- Detroit-Warren-Dearborn, MI
- Population (ZIP)
- 50,117
- Household income
- $30,680
- Rent vs Own
- Severe rent burden
- 4144.0
Population outlook (Wayne County) Hauer SSP2
- Today (2025)
- 1,675,273 people
- By 2030
- 1,620,300 · -3.3%
- By 2040
- 1,502,341 · -10.3%
- By 2050
- 1,384,039 · -17.4%
- By 2075
- 1,124,592 · -32.9%
- By 2100
- 881,193 · -47.4%
Race, ethnicity, and origin ACS 2023
- Neighborhood character
- Predominantly Black (71%)
- Race & ethnicity
- Black 71% White 16% Two or more races 7% Hispanic / Latino 6%
- Hispanic origin (detail)
- Mexican 3% Puerto Rican 2%
- Common ancestry
- Arab 2% Romanian 2% Lithuanian 1%
- Foreign-born
- 11% · Canada
- Languages at home
- 82% English-only · Arabic 11% Spanish 5%
Political lean MEDSL · Wayne
- 2024 margin
- Strong D (+29.0) · D 62.7% · R 33.7% · Other 3.6%
- 2008→2024 swing
- -20.5pp toward R · 2008: 49.5pp · 2024: 29.0pp
- All cycles
- 2024: D+29.0 2020: D+38.1 2016: D+37.3 2012: D+46.9 2008: D+49.5
Not yet ingested
- Civics
- —
Market trends
- HPI YoY
- ▼ -160.81%
- Current HPI
- 168.6843
- Rent YoY
- ▼ -2.30%
- Metro
- Detroit-Warren-Dearborn, MI
- State GDP YoY
- ▲ 1.37%
- F500 in state
- 28
Industry mix (Fortune 500 HQ in MI)
| Industry | F500 HQs | Revenue |
|---|---|---|
| Automotive Parts | 3 | $48B |
|
||
| Automotive | 2 | $372B |
|
||
| Chemicals | 1 | $45B |
|
||
| Automotive Retail | 1 | $29B |
|
||
| Healthcare / Medical Devices | 1 | $23B |
|
||
| Automotive Technology | 1 | $20B |
|
||
Price history
+745.4% since first listed33 events — show timeline
- 2026-06-03 Price Changed $109,900 MiRealSource-MiMLS
- 2026-06-03 Relisted — MiRealSource-MiMLS
- 2026-06-03 Relisted — REALCOMP
- 2026-06-03 Price Changed $109,900 REALCOMP
- 2026-03-06 Listing Removed — MiRealSource-MiMLS
- 2026-02-11 Listed $99,900 REALCOMP
- 2026-02-10 Listed $99,900 MiRealSource-MiMLS
- 2023-07-31 Sold (MLS) $32,200 MiRealSource-MiMLS
- 2023-07-31 Sold (MLS) $32,200 REALCOMP
- 2023-07-14 Pending — MiRealSource-MiMLS
- 2023-07-14 Pending — REALCOMP
- 2023-07-08 Price Changed $39,900 MiRealSource-MiMLS
- 2023-07-07 Price Changed $39,900 REALCOMP
- 2023-06-24 Price Changed $44,900 MiRealSource-MiMLS
- 2023-06-23 Price Changed $44,900 REALCOMP
- 2023-05-31 Price Changed $49,900 MiRealSource-MiMLS
- 2023-05-31 Price Changed $49,900 REALCOMP
- 2023-04-20 Listed $59,900 MiRealSource-MiMLS
- 2023-04-20 Listed $59,900 REALCOMP
- 2023-03-28 Sold (MLS) $29,500 MiRealSource-MiMLS
- 2023-03-28 Sold (MLS) $29,500 REALCOMP
- 2023-03-06 Pending — MiRealSource-MiMLS
- 2023-03-06 Pending — REALCOMP
- 2023-02-16 Price Changed $59,900 MiRealSource-MiMLS
- 2023-02-15 Price Changed $59,900 REALCOMP
- 2023-02-04 Price Changed $64,000 MiRealSource-MiMLS
- 2023-02-03 Price Changed $64,000 REALCOMP
- 2022-12-20 Listed $69,000 MiRealSource-MiMLS
- 2022-12-20 Listed $69,000 REALCOMP
- 2003-03-27 Sold (Public Records) $45,000 Public Records
- 1997-04-22 Sold (Public Records) $32,750 Public Records
- 1997-04-22 Sold (Public Records) $50,000 Public Records
- 1997-01-30 Sold (Public Records) $13,000 Public Records
Property tax history
+4.5%/yrLatest (2025): $2,102 · -0.1% YoY. Source: county tax records.
Cash-flow waterfall
monthlySold comps — $/sqft
last 12 mo · ≤1 miLoading sold comps…