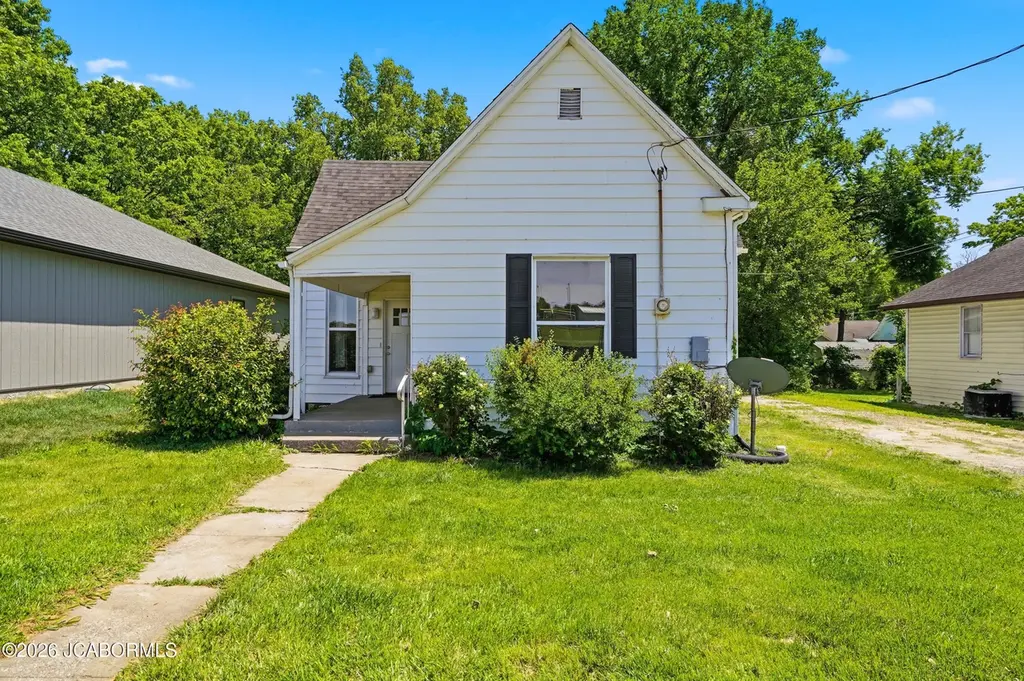
906 N 7th St · Columbia, MO
Flood risk 1/10 · Minimal
- FEMA flood zone
- X (unshaded)
- Chance of flooding over 30 yrs
- 0.0%
- Est. flood insurance / yr
- $473 – $860
Fire risk 1/10 · Minimal
- Est. fire insurance / yr
- $1,054 – $1,958
Heat risk 4/10 · Minor
- Hot days now (above 108°F)
- 7 days/yr
- Hot days in 30 yrs
- 19 days/yr
Wind risk 2/10 · Minimal
- Chance of severe wind over 30 yrs
- —
Air-quality risk 1/10 · Minimal
- Unhealthy air days now
- 0 days/yr
- Unhealthy air days in 30 yrs
- 0 days/yr
Risk factors via First Street. Map © Google.
Why this score? — see what drove the B grade
The composite is a weighted blend of 9 inputs, each scored 0–100. Each bar is that input's sub-score; the figure is the points it added to the 100-point composite (weight × sub-score).
- Cash flow +28.1/30.0
- ARV discount +13.7/15.0
- DSCR +10.0/10.0
- 1% rule +6.8/10.0
- Rent growth +5.0/5.0
- Livability +4.2/5.0
- Schools +3.1/10.0
- Condition / age +2.5/5.0
- Appreciation +0.0/10.0
$194,500
🖨 Deal sheet (PDF) 📄 Offer letter ✓ Due diligence
Listing remarks
Updated and move-in ready, this charming home blends classic character with modern comfort in one of Columbia's most convenient central locations. Just minutes from downtown, Mizzou, Columbia College, and Stephens, it's ideal for anyone wanting quick access to campus, restaurants, and nightlife. Inside, you'll find a spacious layout with four bedrooms and two full baths, offering flexibility for roommates, a home office, or a growing household. Fresh finishes, newer flooring, newer windows, stylish lighting, and updated paint create a clean, modern feel while maintaining the home's original warmth. The kitchen features a gas range, dishwasher, and generous counter space, making everyday coo
Key facts
- Modern comfort
- Move in ready
- Classic character
Tags
Property features AI
Exterior
- Utilities: Public water; Public sewer
- Home design: Single-family residence; Residential property; Updated/Remodeled
- Construction: Vinyl siding; Above-grade finished area approximately 1,600
- Exterior features: Fenced yard
Interior
- Kitchen: Dishwasher; Disposal; Microwave; Range
- Bedrooms: Total rooms: 1; Basement with interior entry (partial)
- Bathrooms: 2 full bathrooms
- Heating & cooling: Forced air heating (natural gas); Has cooling
- Interior features: Dishwasher; Disposal; Microwave; Range; Updated/remodeled interior
- Laundry & utility: Laundry on the main level
Neighborhood map
What this means for you Summary
Snapshot
- This is a 4-bed/2.0-bath single-family listed at $194k.
Deal economics
- At list price, monthly cash flow is $608 ($7k/yr) — positive.
- The deal already cash-flows at list — no discount required.
- Meets the 1% rule at list price ($2k rent vs $194k).
- Recommended offer: $189k (3.0% below list) — sets the bar for market timing.
- Cap rate 10.0% vs local median 2.9% in Columbia — top-decile yield for the area; either an underpriced asset or a hidden risk that comps aren't pricing in. Stress-test before assuming the spread holds.
Location & tenants
- Location reads 83/100 on livability (#9 in MO, #862 nationally) — a professional / high-income tenant draw. Strengths: amenities A+, commute A+, cost of living A+; Watch: crime D+.
- Columbia 93 (urban): math 30% / reading 43% proficiency, ranked #194 of 324 in MO (top 60%) — families likely to look elsewhere, expect single-tenant / working-renter base with shorter leases.
- Market conditions: Rents rising fast (+10.3%/yr); 355 active listings in the ZIP; 33 comparable units currently listed for rent nearby; rentals lingering (median 45d on market — plan ~5-8 weeks vacancy on turnover, expect pricing pressure); 55% of comp listings sitting > 30 days — soft ceiling on asking rent; 1,303 units permitted in Boone County in 2024 (549 in 5+ unit buildings).
- At $2,288/mo this rent would consume 57% of the median local household income ($48k/yr) (locally 4323% of renters already pay >50% of income on rent) — very limited rent-growth headroom before tenants either downsize or default.
Forward outlook
- Local home prices are declining (-3.0%/yr); year-one equity from $1k of loan paydown is wiped out by about $6k of value loss. Plan a longer hold.
- Boone County population projected at +36% by 2050 — long-run rental-demand tailwind backs the buy-and-hold thesis.
- At projected returns (-3.0% appreciation + 8.0% rent growth), your $54k cash investment doubles in ~7 years — after that, you're playing with house money.
Negotiation context
- It's been on market 34 days — a 3% lower offer ($189k) is reasonable based on typical stale-listing flexibility.
- 7 sale attempts since 11y ago with the ask held roughly flat each time — persistent listings suggest the price (not the market) is what's stuck; bring a comps-based counter.
Risks & watch-outs
- Watch-outs: built in 1920 — expect roof / HVAC / electrical / plumbing capex.
Questions for the listing agent
- It's been on market 34 days. Have you received any prior offers? Is the seller open to a 3% concession, seller financing, or rate buy-down credit?
- Built in 1920 — when were the roof, HVAC, electrical panel, plumbing, and water heater last replaced?
- Is there a deadline driving the sale (1031 exchange, divorce, estate, relocation)? That informs how much negotiation room exists.
- Schools are B-rated — typically a magnet for longer-tenancy family renters. What's the average tenant stay here, and is there a school-zone premium baked into asking?
- Crime grade is D in this area — have there been break-ins, vandalism, or insurance claims at this property in the last 3 years? What carrier currently insures it and at what premium?
- What's the average days-on-market for RENTAL listings here right now (not sales)? A rising rental-DOM trend means longer vacancies and softer asking-rent achievability than the comps imply.
- What's the recent tenant-quality profile in this submarket — average credit score on applications, eviction rate, late-payment / NSF rate, and stable-employment percentage? A property-management company in the area should have these aggregated.
- How much new for-sale + rental construction is in the pipeline within 1–3 miles? Heavy new supply typically softens prices + rents 12–24 months out; constrained supply supports both.
Investment metrics
- 1% rule
- 1.18% ✓
- Cap rate
- 10.05%
- Cash-on-cash
- 13.40%
- DSCR
- 1.60
- GRM
- 7.1
CMA / ARV
- ARV (on-the-fly)
- $225,360
- Comps found
- 7
Show comp detail 7 sales within ~0.75 mi
| Address | Dist | Beds/Ba | Sqft | Sold | Price | $/sf | Match |
|---|---|---|---|---|---|---|---|
| 710 King Ave | 0.31mi | 3/1.5 (-1) | 1,437 (-8%) | 1mo | $215,000 | $150 | 64 |
| 809 King Ave | 0.33mi | 4/1.5 | 1,459 (-7%) | 8mo | $209,900 | $144 | 64 |
| 415 N 9th St | 0.33mi | 3/2.0 (-1) | 1,702 (+9%) | 2mo | $280,000 | $165 | 63 |
| 1111 Pannell St | 0.32mi | 4/2.0 | 1,792 (+14%) | 6mo | $220,000 | $123 | 56 |
| 21 Fourth Ave | 0.41mi | 3/1.5 (-1) | 1,469 (-6%) | 11mo | $179,000 | $122 | 54 |
| 318 Bryant St | 0.56mi | 3/1.5 (-1) | 1,528 (-2%) | 18mo | $95,000 | $62 | 48 |
| 207 Lynn St | 0.66mi | 3/2.0 (-1) | 1,485 (-5%) | 12mo | $230,000 | $155 | 45 |
Match score weights: distance 35% · size 25% · config 20% · recency 20%. Top-matched comps best support the ARV.
Projected returns pro-forma
-3.0% appreciation · 8.0% rent growth · sell at horizon
- IRR
- 8.5%
- Equity multiple
- 1.35×
- Total profit
- $19,255
- Equity at exit
- $29,001
- IRR
- 21.4%
- Equity multiple
- 3.23×
- Total profit
- $121,453
- Equity at exit
- $16,817
Cash invested: $54,460 (down + closing). Projections, not guarantees.
Landlord ↔ Tenant lean methodology
- Overall (STATE)
- 81 Strongly Landlord-Friendly
- State Missouri
- 81 Strongly Landlord-Friendly · R+10
- County
- — inherits STATE
- City
- — inherits STATE
ZIP-level market 65201
- Rents YoY
- 10.3%
- Active inventory
- 355
- Price-to-rent
- 7.1×
Monthly cashflow live
- Estimated rent
- $2,288 high interval (Pro) →
- Mortgage (P&I)
- −$1,020
- Tax from tax record
- −$98 /mo · $1,177/yr
- Insurance
- −$81
- HOA
- −$0
- Vacancy / Maint / Mgmt
- −$480
- Net cashflow
- $608
Break-even live
Sensitivity live
| Price | -10% $718 | -5% $663 | +0% $608 | +5% $553 | +10% $498 |
|---|---|---|---|---|---|
| Rent | -10% $427 | -5% $518 | +0% $608 | +5% $699 | +10% $789 |
| Rate | -1.0pp $706 | -0.5pp $658 | base $608 | +0.5pp $558 | +1.0pp $507 |
UW: 25.0% down · 7.5% · 30yr · 1.5% tax · 5.0% vac · 8.0% maint · 8.0% mgmt
Financing live
Cash to close
- Down payment
- $48,625
- Closing costs
- $5,835
- Reserves months
- —
- Total cash needed
- —
Loan-product check · same deal, 3 products live
Conventional
25% down · 7.5% · 30yr
- Down + closing
- —
- Monthly P&I
- —
- Monthly cashflow
- —
- DSCR
- —
- Eligible?
- —
Personal DTI + credit; lowest rate.
DSCR
20% down · 8.5% · 30yr
- Down + closing
- —
- Monthly P&I
- —
- Monthly cashflow
- —
- DSCR
- —
- Eligible?
- —
No personal income docs; deal must DSCR.
Hard money
10% down · 12.0% · 12mo
- Down + closing
- —
- Monthly P&I
- —
- Monthly cashflow
- —
- DSCR
- —
- Eligible?
- —
Short-term bridge; refi at stabilization.
Rent comps 33 comps
| Address | Beds | Baths | Sqft | Rent | $/sqft | DOM | Units | Dist |
|---|---|---|---|---|---|---|---|---|
| 403 N 9th St Columbia, MO | 3.0 | 2.0 | 1397 | $1,800 | $1.29 | 14d | 1 | 0.37mi |
| 1409 Paris Rd Unit 101 Columbia, MO | 4.0 | 2.0 | 1468 | $3,200 | $2.18 | 44d | 1 | 0.57mi |
| 1413 Paris Rd Unit 101 Columbia, MO | 4.0 | 4.0 | 1659 | $2,800 | $1.69 | 44d | 1 | 0.58mi |
| 1415 Paris Rd Unit A Columbia, MO | 4.0 | 2.0 | 1659 | $3,200 | $1.93 | 44d | 1 | 0.59mi |
| 503 N William St Columbia, MO | 4.0 | 2.0 | 1340 | $2,400 | $1.79 | 14d | 1 | 0.71mi |
| 600 N William St Columbia, MO | 5.0 | 2.5 | 2120 | $2,400 | $1.13 | 22d | 1 | 0.72mi |
| 301 W Forest Ave Columbia, MO | 3.0 | 2.0 | 1162 | $1,395 | $1.20 | 14d | 1 | 0.75mi |
| 1514 Richardson St Columbia, MO | 4.0 | 2.0 | 1827 | $1,800 | $0.99 | 22d | 1 | 0.77mi |
| 103 N Garth Ave Columbia, MO | 3.0 | 2.0 | 1196 | $2,950 | $2.47 | 22d | 1 | 0.79mi |
| 302 Alexander Ave Columbia, MO | 3.0 | 2.0 | 1296 | $1,350 | $1.04 | 22d | 1 | 0.85mi |
| 409 Sanford Ave Unit 102 Columbia, MO | 4.0 | 3.0 | 1798 | $2,400 | $1.33 | 44d | 1 | 0.91mi |
| 1800 McAlester St Columbia, MO | 3.0 | 2.0 | 1390 | $1,695 | $1.22 | 44d | 1 | 0.97mi |
| 1007 Hardin St Columbia, MO | 3.0 | 2.0 | 1554 | $1,625 | $1.05 | 22d | 1 | 1.23mi |
| 319 West Blvd N Columbia, MO | 4.0 | 2.0 | 1456 | $2,800 | $1.92 | 44d | 1 | 1.33mi |
| 215 West Blvd N Columbia, MO | 4.0 | 2.0 | 1456 | $2,800 | $1.92 | 44d | 1 | 1.34mi |
| 215 West Blvd N Columbia, MO | 4.0 | 2.0 | 1456 | $2,800 | $1.92 | 14d | 1 | 1.34mi |
| 205 West Blvd N Columbia, MO | 4.0 | 2.0 | 1456 | $1,550 | $1.06 | 44d | 1 | 1.34mi |
| 1007 W Ash St Columbia, MO | 4.0 | 2.0 | 1456 | $1,550 | $1.06 | 44d | 1 | 1.37mi |
| 1011 W Ash St Columbia, MO | 4.0 | 2.0 | 1456 | $1,550 | $1.06 | 44d | 1 | 1.38mi |
| 212 Wheaton Ct Columbia, MO | 3.0 | 2.0 | 1456 | $2,800 | $1.92 | 22d | 1 | 1.40mi |
| 210 Wheaton Ct Columbia, MO | 3.0 | 2.0 | 1456 | $1,550 | $1.06 | 44d | 1 | 1.40mi |
| 204 Wheaton Ct Columbia, MO | 3.0 | 2.0 | 1456 | $2,800 | $1.92 | 44d | 1 | 1.41mi |
| 202 Wheaton Ct Columbia, MO | 3.0 | 2.0 | 1456 | $2,800 | $1.92 | 44d | 1 | 1.41mi |
| 215 Wheaton Ct Columbia, MO | 3.0 | 2.0 | 1456 | $1,550 | $1.06 | 44d | 1 | 1.42mi |
| 211 Wheaton Ct Columbia, MO | 3.0 | 2.0 | 1456 | $1,550 | $1.06 | 44d | 1 | 1.43mi |
| 205 Wheaton Ct Columbia, MO | 3.0 | 2.0 | 1456 | $2,800 | $1.92 | 44d | 1 | 1.43mi |
| 205 Wheaton Ct Columbia, MO | 3.0 | 2.0 | 1456 | $2,800 | $1.92 | 14d | 1 | 1.43mi |
| 207 Wheaton Ct Columbia, MO | 3.0 | 2.0 | 1456 | $2,800 | $1.92 | 22d | 1 | 1.43mi |
| 201 Wheaton Ct Columbia, MO | 3.0 | 2.0 | 1456 | $2,800 | $1.92 | 44d | 1 | 1.44mi |
| 201 Wheaton Ct Columbia, MO | 3.0 | 2.0 | 1456 | $2,800 | $1.92 | 14d | 1 | 1.44mi |
| 203 Wheaton Ct Columbia, MO | 3.0 | 2.0 | 1456 | $2,800 | $1.92 | 44d | 1 | 1.44mi |
| 613 Bear Valley Ct Columbia, MO | 3.0 | 1.0 | 1206 | $1,600 | $1.33 | 22d | 1 | 1.45mi |
| 2011 Bridgewater Dr Columbia, MO | 3.0 | 2.0 | 1436 | $1,825 | $1.27 | 22d | 1 | 1.49mi |
Listing history 31 events
-
2026-06-19days on market $194,500 Active 34 DOM
-
2026-06-18days on market $194,500 Active 33 DOM
-
2026-06-17days on market $194,500 Active 32 DOM
-
2026-06-16days on market $194,500 Active 31 DOM
-
2026-06-15days on market $194,500 Active 30 DOM
-
2026-06-14days on market $194,500 Active 28 DOM
-
2026-06-13days on market $194,500 Active 27 DOM
-
2026-06-10days on market $194,500 Active 25 DOM
-
2026-06-09days on market $194,500 Active 24 DOM
-
2026-06-09price $194,500 Active 23 DOM
-
2026-06-08days on market $199,777 Active 23 DOM
-
2026-06-07days on market $199,777 Active 22 DOM
-
2026-06-05days on market $199,777 Active 19 DOM
-
2026-06-03days on market $199,777 Active 18 DOM
-
2026-06-02days on market $199,777 Active 17 DOM
-
2026-05-31days on market $199,777 Active 15 DOM
-
2026-05-30days on market $199,777 Active 14 DOM
-
2026-05-16$199,777 Active
-
2025-07-17historical
-
2025-07-03price $185,000
-
2025-06-01price $195,000
-
2025-05-31status Active
-
2025-05-31price $200,000
-
2025-05-20historical
-
2025-05-17$195,000 Active
-
2017-11-17$130,000
-
2017-04-10$139,990
-
2016-01-29soldstatus
-
2016-01-29soldstatus
-
2015-12-19$62,500
-
2015-09-18$62,500
ⓘ Source: listings_history table (triggers on properties + properties_extension) + one-shot
backfill from property_details.listing_events for pre-trigger history.
Tax reassessment forecast MO · Resets to sale price
- Current annual tax
- $1,177 · $98/mo
- Projected year-2 tax
- $1,887 · $157/mo
- Expected delta
- +$710/yr (+$59/mo · 60.3%)
ⓘ Screening estimate from a state-policy table — verify with the county assessor before closing.
Climate risk First Street
- Flood 1/10 Low FEMA zone X (unshaded) · 0% chance over 30 yrs
- Wildfire 1/10 Low
- Heat 4/10 Moderate 7 d/yr ≥108°F today · 19 d/yr by 30 yrs out
- Wind 2/10 Low
- Air quality 1/10 Low 0 unhealthy d/yr today · 0 by 30 yrs out
Nearby sold comps map
Loading sold comps map…
Walkable amenities ~0.75 mi
Loading nearby amenities…
Taxation est. · year 1
- Rental income
- $27,453
- − Mortgage interest
- −$10,895
- − Property taxes
- −$1,177
- − Insurance
- −$972
- − Repairs & maintenance
- −$2,196
- − Management
- −$2,196
- − Depreciation
- −$5,658
- Taxable income
- $4,358
- Est. tax owed @ 24.0%
- −$1,046
- After-tax cash flow
- $6,253/yr
For passive investors: Depreciation is non-cash, so a rental often shows a tax loss while cash-flowing — sheltering income. Rental losses are passive: they offset passive income freely, and up to $25,000/yr can offset ordinary (W-2) income if you actively participate and your MAGI is under $100k (phasing out to $0 by $150k); unused losses carry forward. On sale, claimed depreciation is recaptured at up to 25%, and gains may owe capital-gains tax (a 1031 exchange can defer both). Figures are a year-1 estimate at your 24.0% rate — not tax advice; consult a CPA.
Schools (NCES district)
- District
- Columbia 93
- NCES district ID
- 2901000
- Math proficiency
- 30% ▼ -12.00%
- Reading proficiency
- 43% ▼ -4.00%
- Median HH income
- $46,547
- Composite
- 31.21/100
- National rank
- #6036
- State rank
- #194 of 324 in MO
Livability — Columbia
- Score
- 83/100
- State rank
- #9
- US rank
- #862
Category grades
Schools grade is shown separately in the Schools card above.
Census & demographics
- Census place
- Columbia, MO
- County
- Boone County · 158,877 people
- City population
- 158,877
- Metro
- Columbia, MO
- Population (ZIP)
- 50,011
- Household income
- $48,113
- Rent vs Own
- Severe rent burden
- 4323.0
Population outlook (Boone County) Hauer SSP2
- Today (2025)
- 202,891 people
- By 2030
- 217,799 · +7.3%
- By 2040
- 246,789 · +21.6%
- By 2050
- 276,116 · +36.1%
- By 2075
- 348,426 · +71.7%
- By 2100
- 400,856 · +97.6%
Race, ethnicity, and origin ACS 2023
- Neighborhood character
- Predominantly White (74%)
- Race & ethnicity
- White 74% Black 8% Two or more races 7% Asian 7% Hispanic / Latino 6%
- Hispanic origin (detail)
- Mexican 5%
- Common ancestry
- Slovak 2% Italian 2% Romanian 2%
- Foreign-born
- 9% · China, Canada, Vietnam
- Languages at home
- 88% English-only · Spanish 4% Chinese 2% Other Indo-European 2%
Political lean MEDSL · Boone
- 2024 margin
- Lean D (+9.8) · D 53.9% · R 44.1% · Other 2.1%
- 2008→2024 swing
- -2.2pp toward R · 2008: 12.0pp · 2024: 9.8pp
- All cycles
- 2024: D+9.8 2020: D+12.5 2016: D+5.9 2012: D+3.1 2008: D+12.0
Not yet ingested
- Civics
- —
Market trends
- HPI YoY
- ▼ -170.32%
- Current HPI
- 195.2059
- Rent YoY
- ▲ 10.33%
- Metro
- Columbia, MO
- State GDP YoY
- ▲ 1.84%
- F500 in state
- 20
Industry mix (Fortune 500 HQ in MO)
| Industry | F500 HQs | Revenue |
|---|---|---|
| Healthcare | 1 | $163B |
|
||
| Insurance | 1 | $21B |
|
||
| Industrial Technology | 1 | $17B |
|
||
| Retail | 1 | $16B |
|
||
| Industrial Distribution | 1 | $10B |
|
||
| Utilities | 1 | $9B |
|
||
Price history
+219.6% since first listed14 events — show timeline
- 2026-05-16 Listed $199,777 JCMLS
- 2025-07-17 Delisted — CBORMLS
- 2025-07-03 Price Changed $185,000 CBORMLS
- 2025-06-01 Price Changed $195,000 CBORMLS
- 2025-05-31 Relisted — CBORMLS
- 2025-05-31 Price Changed $200,000 CBORMLS
- 2025-05-20 Delisted — CBORMLS
- 2025-05-17 Listed $195,000 CBORMLS
- 2017-11-17 Listed $130,000 CBORMLS
- 2017-04-10 Listed $139,990 CBORMLS
- 2016-01-29 Sold (Public Records) — Public Records
- 2016-01-29 Sold (MLS) — CBORMLS
- 2015-12-19 Listed $62,500 CBORMLS
- 2015-09-18 Listed $62,500 CBORMLS
Property tax history
+6.8%/yrLatest (2024): $1,177 · +0.8% YoY. Source: county tax records.
Cash-flow waterfall
monthlySold comps — $/sqft
last 12 mo · ≤1 miLoading sold comps…