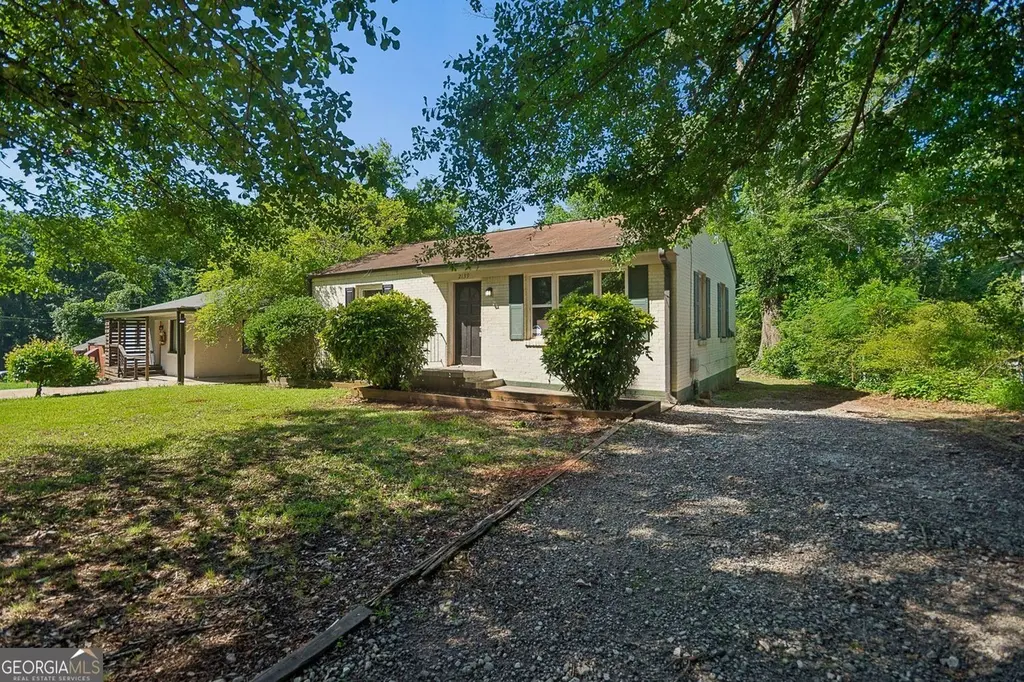
2139 Clanton Ter · Panthersville, GA
Flood risk 1/10 · Minimal
- FEMA flood zone
- X (unshaded)
- Chance of flooding over 30 yrs
- 0.0%
- Est. flood insurance / yr
- $507 – $1,088
Fire risk 1/10 · Minimal
- Est. fire insurance / yr
- $963 – $1,789
Heat risk 5/10 · Moderate
- Hot days now (above 105°F)
- 6 days/yr
- Hot days in 30 yrs
- 15 days/yr
Wind risk 5/10 · Moderate
- Chance of severe wind over 30 yrs
- 24.0%
Air-quality risk 5/10 · Moderate
- Unhealthy air days now
- 6 days/yr
- Unhealthy air days in 30 yrs
- 8 days/yr
Risk factors via First Street. Map © Google.
Why this score? — see what drove the C- grade
The composite is a weighted blend of 9 inputs, each scored 0–100. Each bar is that input's sub-score; the figure is the points it added to the 100-point composite (weight × sub-score).
- Cash flow +21.1/30.0
- ARV discount +8.6/15.0
- DSCR +6.7/10.0
- 1% rule +6.0/10.0
- Livability +3.3/5.0
- Rent growth +3.0/5.0
- Condition / age +2.5/5.0
- Schools +2.1/10.0
- Appreciation +0.0/10.0
$150,000
🖨 Deal sheet 📄 Offer letter ✓ Due diligence
Listing remarks MLS
Opportunity doesn't always arrive wrapped in granite countertops and fresh paint. Sometimes it shows up with solid hardwood floors, good bones, and a chance to create something special. Nestled on a generous lot in Decatur, this two-bedroom, one-bath home is waiting for a buyer with vision and a toolbox-or at least the number of someone who owns one. Inside, the footprint is intentionally manageable, making everyday living refreshingly simple. Less square footage means less to maintain, lower utility costs, and the ability to focus your renovation budget where it counts. Original hardwood flooring runs throughout much of the home, providing a warm foundation and a head start for anyone looking to restore its character. Step outside and the story gets even better. The spacious backyard offers room to garden, entertain, play, or simply enjoy a little breathing room that's becoming increasingly hard to find. A welcoming front yard adds curb appeal and creates an inviting first impression before you even step through the door. Whether you're an investor searching for your next project, a first-time buyer eager to build equity, or someone who appreciates the charm of a home with untapped potential, this property offers a rare chance to bring your ideas to life. The bones are here. The yard is here. The vision is yours.
Key facts
- Generous lot
- Spacious backyard
- Welcoming front yard
Tags
Property features AI
Exterior
- Parking: Driveway with 2 parking spaces; Open parking available
- Utilities: Public water; Public sewer; Electricity available; Water available; Sewer available
- Home design: One-story home; Brick construction
- Construction: Brick/mortar foundation; Composition roof; Resale condition; Other on-site structures
- Exterior features: Rain gutters
Interior
- Kitchen: Stained cabinets; Refrigerator; Gas oven
- Bedrooms: 2 bedrooms on the main level; Primary bedroom on the main level
- Flooring: Hardwood floors
- Bathrooms: 1 full bathroom with tub/shower combo
- Heating & cooling: Central heating; Central air conditioning
- Interior features: Wood window frames; Open-concept dining area; Other interior features
- Laundry & utility: Laundry area in the kitchen
Neighborhood map
What this means for you Summary
Snapshot
- This is a 2-bed/1.0-bath single-family listed at $150k.
Deal economics
- At list price, monthly cash flow is $215 ($3k/yr) — positive.
- The deal already cash-flows at list — no discount required.
- Meets the 1% rule at list price ($2k rent vs $150k).
- Cap rate 8.0% vs local median 5.3% in Panthersville — top-decile yield for the area; either an underpriced asset or a hidden risk that comps aren't pricing in. Stress-test before assuming the spread holds.
Location & tenants
- Location reads 66/100 on livability (#180 in GA) — a middle-class / working-renter tenant base. Strengths: cost of living A+, housing A+; Watch: crime C-, employment D, amenities F.
- Dekalb County (suburban): math 19% / reading 28% proficiency, ranked #125 of 174 in GA (top 72%) — low school quality limits family demand, transient renter base, plan for 1-2y turnover; 68% free/reduced lunch — lower-income household profile, screen leases tightly.
- Zoned schools: Mcnair High School (math 2% / reading 5%, grade F, #413 of 424 statewide, top 99%, 768 students, 100% FRL) — zoned schools average 100% FRL vs 68% district-wide (32 pts higher); higher-poverty schools than district average — tighter screening recommended.
- Zoned-school proficiency averages 4% at this address vs 24% district-wide (-20 pts) — the specific schools serving this property underperform the Dekalb County average; the district grade overstates school quality for this exact location.
- Market conditions: Rents rising (+2.2%/yr); 353 active listings in the ZIP; 17 comparable units currently listed for rent nearby; rentals lingering (median 44d on market — plan ~5-8 weeks vacancy on turnover, expect pricing pressure); 53% of comp listings sitting > 30 days — soft ceiling on asking rent; 1,240 units permitted in DeKalb County in 2024 (385 in 5+ unit buildings).
- This rent runs 31% of the median local income ($64k/yr) — at the standard rent-burdened threshold; future hikes will face affordability resistance.
Forward outlook
- Local home prices are declining (-3.0%/yr); year-one equity from $1k of loan paydown is wiped out by about $4k of value loss. Plan a longer hold.
- DeKalb County population projected at +28% by 2050 — long-run rental-demand tailwind backs the buy-and-hold thesis.
Negotiation context
- Only 14 days on market — expect competitive offers; lowballing is unlikely to land.
- 6 sale attempts since 10y ago with the ask held roughly flat each time — persistent listings suggest the price (not the market) is what's stuck; bring a comps-based counter.
- Current owner paid $51k; list at $150k implies a 194% gain — meaningful room to come down on a strong offer.
Risks & watch-outs
- Watch-outs: built in 1953 — expect roof / HVAC / electrical / plumbing capex.
- Climate carrying-cost: moderate wind risk, 24% chance of damaging wind over 30y; extreme-heat days projected 6→15/yr by 2055 (HVAC capex compounding) — expect insurance premiums to compound above CPI over the hold.
Questions for the listing agent
- Built in 1953 — when were the roof, HVAC, electrical panel, plumbing, and water heater last replaced?
- Is there a deadline driving the sale (1031 exchange, divorce, estate, relocation)? That informs how much negotiation room exists.
- Schools are D-rated, which usually means shorter tenancies and higher turnover. Who's the typical renter profile here, and what's been the actual vacancy rate?
- What's the average days-on-market for RENTAL listings here right now (not sales)? A rising rental-DOM trend means longer vacancies and softer asking-rent achievability than the comps imply.
- What's the recent tenant-quality profile in this submarket — average credit score on applications, eviction rate, late-payment / NSF rate, and stable-employment percentage? A property-management company in the area should have these aggregated.
- How much new for-sale + rental construction is in the pipeline within 1–3 miles? Heavy new supply typically softens prices + rents 12–24 months out; constrained supply supports both.
Investment metrics
- 1% rule
- 1.10% ✓
- Cap rate
- 8.01%
- Cash-on-cash
- 6.13%
- DSCR
- 1.27
- GRM
- 7.6
CMA / ARV
- ARV (on-the-fly)
- $153,900
- Comps found
- 8
Show comp detail 8 sales within ~0.75 mi
| Address | Dist | Beds/Ba | Sqft | Sold | Price | $/sf | Match |
|---|---|---|---|---|---|---|---|
| 2168 Clanton Ter | 0.07mi | 2/1.0 | 900 (0%) | 10mo | $105,000 | $117 | 89 |
| 2576 Flat Shoals Dr | 0.14mi | 2/1.0 | 900 (0%) | 9mo | $160,000 | $178 | 86 |
| 2168 Doris Dr | 0.10mi | 2/1.0 | 1,026 (+14%) | 11mo | $185,000 | $180 | 63 |
| 2028 Cook Rd | 0.35mi | 2/1.0 | 1,012 (+12%) | 6mo | $168,000 | $166 | 58 |
| 2022 Cook Rd | 0.36mi | 2/1.0 | 1,012 (+12%) | 12mo | $50,000 | $49 | 52 |
| 2327 Scotty Cir | 0.63mi | 2/2.0 | 1,010 (+12%) | 7mo | $210,000 | $208 | 41 |
| 2352 Scotty Cir | 0.59mi | 3/1.0 (+1) | 1,010 (+12%) | 10mo | $173,000 | $171 | 39 |
| 2958 Flat Shoals Rd | 0.67mi | 3/1.5 (+1) | 1,008 (+12%) | 12mo | $140,000 | $139 | 32 |
Match score weights: distance 35% · size 25% · config 20% · recency 20%. Top-matched comps best support the ARV.
Projected returns pro-forma
-3.0% appreciation · 2.18% rent growth · sell at horizon
- IRR
- -7.8%
- Equity multiple
- 0.72×
- Total profit
- $-11,925
- Equity at exit
- $22,365
- IRR
- 0.7%
- Equity multiple
- 1.05×
- Total profit
- $2,009
- Equity at exit
- $12,969
Cash invested: $42,000 (down + closing). Projections, not guarantees.
Landlord ↔ Tenant lean methodology
- Overall (STATE)
- 90 Strongly Landlord-Friendly
- State Georgia
- 90 Strongly Landlord-Friendly · R+3
- County
- — inherits STATE
- City
- — inherits STATE
ZIP-level market 30034
- Home prices YoY
- -27.4%
- Rents YoY
- 2.2%
- Active inventory
- 353
- Price-to-rent
- 7.6×
Monthly cashflow live
- Estimated rent
- $1,646 high interval (Pro) →
- Mortgage (P&I)
- −$787
- Tax from tax record
- −$237 /mo · $2,838/yr
- Insurance
- −$62
- HOA
- −$0
- Vacancy / Maint / Mgmt
- −$346
- Net cashflow
- $215
Break-even live
UW: 25.0% down · 7.5% · 30yr · 1.5% tax · 5.0% vac · 8.0% maint · 8.0% mgmt
Financing live
Cash to close
- Down payment
- $37,500
- Closing costs
- $4,500
- Reserves months
- —
- Total cash needed
- —
Loan-product check · same deal, 3 products live
Conventional
25% down · 7.5% · 30yr
- Down + closing
- —
- Monthly P&I
- —
- Monthly cashflow
- —
- DSCR
- —
- Eligible?
- —
Personal DTI + credit; lowest rate.
DSCR
20% down · 8.5% · 30yr
- Down + closing
- —
- Monthly P&I
- —
- Monthly cashflow
- —
- DSCR
- —
- Eligible?
- —
No personal income docs; deal must DSCR.
Hard money
10% down · 12.0% · 12mo
- Down + closing
- —
- Monthly P&I
- —
- Monthly cashflow
- —
- DSCR
- —
- Eligible?
- —
Short-term bridge; refi at stabilization.
Rent comps 17 comps
| Address | Beds | Baths | Sqft | Rent | $/sqft | DOM | Units | Dist |
|---|---|---|---|---|---|---|---|---|
| 2126 Rexford Dr Decatur, GA | 3.0 | 1.5 | 1092 | $1,400 | $1.28 | 43d | 1 | 0.16mi |
| 2078 Parker Ranch Rd SE Atlanta, GA | 3.0 | 1.0 | 1014 | $1,650 | $1.63 | 24d | 1 | 0.38mi |
| 2480 Flat Shoals Rd Decatur, GA | 1.0–3.0 | 1.0–2.0 | 1017 | $1,699 | $1.67 | 1d | 23 | 0.40mi |
| 2335 Scotty Cir Decatur, GA | 3.0 | 1.0 | 1010 | $1,495 | $1.48 | 43d | 1 | 0.62mi |
| 2911 Gresham Rd SE Atlanta, GA | 3.0 | 1.0 | 960 | $1,700 | $1.77 | 43d | 1 | 0.71mi |
| 1989 Wee Kirk Rd SE Atlanta, GA | 3.0 | 1.0 | 925 | $1,800 | $1.95 | 24d | 1 | 0.87mi |
| 2510 Corner Shoals Dr Decatur, GA | 3.0 | 2.0 | 1065 | $1,723 | $1.62 | 20d | 1 | 0.99mi |
| 3054 Will Rogers Pl SE Atlanta, GA | 3.0 | 2.0 | 1050 | $2,600 | $2.48 | 43d | 1 | 1.15mi |
| 200 Vineyard Walk Atlanta, GA | 2.0 | 1.0 | 884 | $1,294 | $1.46 | 1d | 6 | 1.19mi |
| 2191 Greystone Way Decatur, GA | 3.0 | 1.0 | 1053 | $1,800 | $1.71 | 43d | 1 | 1.22mi |
| 2163 Lilac Ln Decatur, GA | 3.0 | 2.0 | 1107 | $2,150 | $1.94 | 43d | 1 | 1.23mi |
| 2386 Cresta Dr Decatur, GA | 3.0 | 2.5 | 1107 | $2,000 | $1.81 | 43d | 1 | 1.27mi |
| 2435 Aylesbury Loop Decatur, GA | 1.0–3.0 | 1.0–2.0 | 937 | $1,242 | $1.32 | 3d | 12 | 1.34mi |
| 2571 Candler Rd Decatur, GA | 1.0–2.0 | 1.0–2.0 | 901 | $1,149 | $1.27 | 12d | 121 | 1.43mi |
| 1670 Cecilia Dr SE Atlanta, GA | 3.0 | 2.0 | 1032 | $2,350 | $2.28 | 43d | 1 | 1.44mi |
| 2000 Bouldercrest Rd Atlanta, GA | 1.0–3.0 | 1.0–2.0 | 1050 | $1,336 | $1.27 | 1d | 16 | 1.48mi |
| 2000 Bouldercrest Rd Atlanta, GA | 1.0–2.0 | 1.0–2.0 | 925 | $1,520 | $1.64 | 43d | 3 | 1.48mi |
Listing history 9 events
-
2026-06-18days on market $150,000 Active 14 DOM
-
2026-06-17days on market $150,000 Active 13 DOM
-
2026-06-16days on market $150,000 Active 12 DOM
-
2026-06-15days on market $150,000 Active 11 DOM
-
2026-06-13days on market $150,000 Active 9 DOM
-
2026-06-09days on market $150,000 Active 5 DOM
-
2026-06-08days on market $150,000 Active 4 DOM
-
2026-06-07remarks 699-char remark
-
2026-06-07$150,000 Active 3 DOM
ⓘ Source: listings_history table (triggers on properties + properties_extension) + one-shot
backfill from property_details.listing_events for pre-trigger history.
Tax reassessment forecast GA · Resets to sale price
- Current annual tax
- $2,838 · $237/mo
- Projected year-2 tax
- $2,838 · $237/mo
- Expected delta
- $0/yr ($0/mo · 0.0%)
ⓘ Screening estimate from a state-policy table — verify with the county assessor before closing.
Climate risk First Street
- Flood 1/10 Low FEMA zone X (unshaded) · 0% chance over 30 yrs
- Wildfire 1/10 Low
- Heat 5/10 Major 6 d/yr ≥105°F today · 15 d/yr by 30 yrs out
- Wind 5/10 Major 24% chance of damaging wind over 30 yrs
- Air quality 5/10 Major 6 unhealthy d/yr today · 8 by 30 yrs out
Nearby sold comps map
Loading sold comps map…
Walkable amenities ~0.75 mi
Loading nearby amenities…
Taxation est. · year 1
- Rental income
- $19,752
- − Mortgage interest
- −$8,402
- − Property taxes
- −$2,838
- − Insurance
- −$750
- − Repairs & maintenance
- −$1,580
- − Management
- −$1,580
- − Depreciation
- −$4,364
- Taxable income
- $237
- Est. tax owed @ 24.0%
- −$57
- After-tax cash flow
- $2,519/yr
For passive investors: Depreciation is non-cash, so a rental often shows a tax loss while cash-flowing — sheltering income. Rental losses are passive: they offset passive income freely, and up to $25,000/yr can offset ordinary (W-2) income if you actively participate and your MAGI is under $100k (phasing out to $0 by $150k); unused losses carry forward. On sale, claimed depreciation is recaptured at up to 25%, and gains may owe capital-gains tax (a 1031 exchange can defer both). Figures are a year-1 estimate at your 24.0% rate — not tax advice; consult a CPA.
Schools (NCES district)
- District
- Dekalb County
- NCES district ID
- 1301740
- Math proficiency
- 19% ▼ -12.00%
- Reading proficiency
- 28% ▼ -7.00%
- Median HH income
- $51,448
- Composite
- 20.92/100
- National rank
- #8482
- State rank
- #125 of 174 in GA
Livability — Panthersville
- Score
- 66/100
- State rank
- #180
- US rank
- #11244
Category grades
Schools grade is shown separately in the Schools card above.
Census & demographics
- Census place
- Panthersville, GA
- County
- Dekalb County · 782,738 people
- Metro
- Atlanta-Sandy Springs-Alpharetta, GA
- Population (ZIP)
- 41,847
- Household income
- $63,517
- Rent vs Own
- Severe rent burden
- 1659.0
Population outlook (DeKalb County) Hauer SSP2
- Today (2025)
- 839,977 people
- By 2030
- 891,768 · +6.2%
- By 2040
- 988,894 · +17.7%
- By 2050
- 1,074,583 · +27.9%
- By 2075
- 1,245,026 · +48.2%
- By 2100
- 1,303,135 · +55.1%
Race, ethnicity, and origin ACS 2023
- Neighborhood character
- Predominantly Black (90%)
- Race & ethnicity
- Black 90% White 4% Two or more races 3% Hispanic / Latino 2%
- Common ancestry
- Hispanic 1% Lithuanian 1%
- Foreign-born
- 8% · Canada
- Languages at home
- 93% English-only · Spanish 2% French/Haitian/Cajun 1%
Political lean MEDSL · DeKalb
- 2024 margin
- Solid D (+64.8) · D 81.9% · R 17.1% · Other 1.0%
- 2008→2024 swing
- +6.1pp toward D · 2008: 58.6pp · 2024: 64.8pp
- All cycles
- 2024: D+64.8 2020: D+67.4 2016: D+64.8 2012: D+56.8 2008: D+58.6
Not yet ingested
- Civics
- —
Market trends
- HPI YoY
- ▼ -78.92%
- Current HPI
- 209.5638
- Rent YoY
- ▲ 2.18%
- Metro
- Atlanta-Sandy Springs-Alpharetta, GA
- State GDP YoY
- ▲ 2.66%
- F500 in state
- 28
Industry mix (Fortune 500 HQ in GA)
| Industry | F500 HQs | Revenue |
|---|---|---|
| Paper / Packaging | 2 | $29B |
|
||
| Retail | 1 | $160B |
|
||
| Transportation / Logistics | 1 | $91B |
|
||
| Airlines | 1 | $62B |
|
||
| Consumer Goods | 1 | $47B |
|
||
| Utilities | 1 | $25B |
|
||
Price history
+466.0% since first listed16 events — show timeline
- 2026-06-04 Listed $150,000 GAMLS
- 2026-06-04 Listed $150,000 FMLS
- 2025-03-31 Rental Removed $1,450 FMLS
- 2025-02-25 Price Changed $1,450 FMLS
- 2025-02-01 Price Changed $1,545 FMLS
- 2025-01-24 Listed for Rent $1,600 FMLS
- 2025-01-24 Rental Removed $1,600 APPFOLIO
- 2025-01-18 Listed for Rent $1,600 APPFOLIO
- 2017-01-25 Sold (Public Records) $51,000 Public Records
- 2017-01-24 Sold (MLS) $51,000 GAMLS
- 2017-01-24 Sold (MLS) $51,000 FMLS
- 2017-01-13 Pending — GAMLS
- 2017-01-13 Contingent — FMLS
- 2017-01-06 Listed $59,900 FMLS
- 2016-12-30 Listed $59,900 GAMLS
- 1990-12-01 Sold (Public Records) $26,500 Public Records
Property tax history
+2.9%/yrLatest (2025): $2,838 · -12.7% YoY. Source: county tax records.
Cash-flow waterfall
monthlySold comps — $/sqft
last 12 mo · ≤1 miLoading sold comps…