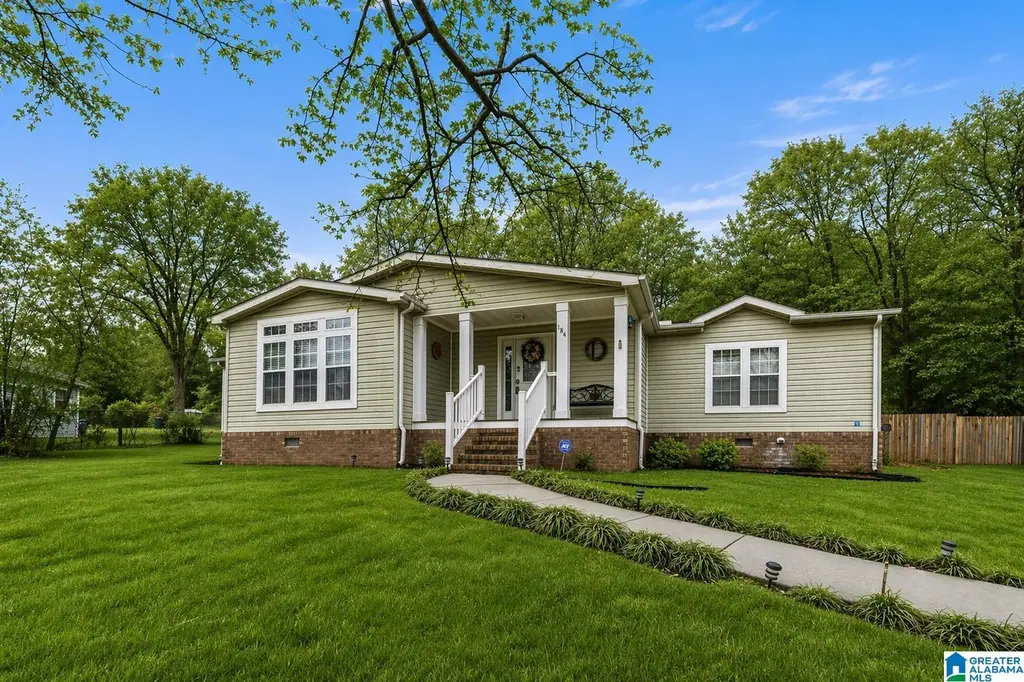
184 Maylene Ln · Alabaster, AL
Flood risk 1/10 · Minimal
- FEMA flood zone
- X (unshaded)
- Chance of flooding over 30 yrs
- 0.0%
- Est. flood insurance / yr
- $507 – $1,088
Fire risk 4/10 · Minor
- Est. fire insurance / yr
- $916 – $1,700
Heat risk 6/10 · Moderate
- Hot days now (above 106°F)
- 7 days/yr
- Hot days in 30 yrs
- 20 days/yr
Wind risk 6/10 · Moderate
- Chance of severe wind over 30 yrs
- 55.0%
Air-quality risk 3/10 · Minor
- Unhealthy air days now
- 3 days/yr
- Unhealthy air days in 30 yrs
- 3 days/yr
Risk factors via First Street. Map © Google.
Why this score? — see what drove the C grade
The composite is a weighted blend of 9 inputs, each scored 0–100. Each bar is that input's sub-score; the figure is the points it added to the 100-point composite (weight × sub-score).
- Cash flow +19.4/30.0
- ARV discount +15.0/15.0
- DSCR +6.1/10.0
- Schools +3.9/10.0
- 1% rule +3.8/10.0
- Livability +3.8/5.0
- Rent growth +2.5/5.0
- Condition / age +2.5/5.0
- Appreciation +0.0/10.0
$200,000
🖨 Deal sheet (PDF) 📄 Offer letter ✓ Due diligence
Listing remarks
CALLING ALL CASH BUYERS - We are looking for a QUICK SALE! Looking for room to spread out while still be close to schools and shopping? Be sure to check out this beautiful home in Maylene! Wide open layout with a beautifully upgraded kitchen with oversized island with gorgeous granite counter tops, stainless steel appliances including NEW dishwasher, NEW microwave, trash compactor and an oversized refrigerator. This home offers a split bedroom floorplan offering plenty of privacy from your guests or children! The great room is open to the kitchen and is the perfect space to relax by the wood-burning fireplace. Step out back to the open deck and your own private POOL! You know warmer days
Key facts
- 0.64 acre lot
- Pool
- Built 2010
Property features AI
Finance
- Other: Parcel ID: 23-5-16-0-001-042.000; Lot size approximately 0.64 acres
- Financial info: Down payment assistance available
- HOA & community: Garbage service fee ($50 monthly)
Exterior
- Parking: Driveway parking
- Security: Security system
- Utilities: Public water; Septic system; Electric water heater; AT&T internet availability
- Home design: Existing single-family home; Main-level entry; Crawl space foundation; Vinyl siding
- Construction: Vinyl siding construction; Crawl space foundation
- Exterior features: Above-ground personal pool; Open deck; Some trees on lot; Subdivision setting; Not waterfront; No patio
Interior
- Kitchen: Stone countertops; Breakfast bar; Kitchen island; Pantry; Compactor (built-in); Electric cooktop; Built-in microwave; Electric oven; Refrigerator; Some stainless steel appliances
- Bedrooms: Master bedroom (main level); Additional bedrooms (main level); Walk-in closets in bedrooms
- Flooring: Carpet; Hardwood laminate; Vinyl
- Bathrooms: Two full bathrooms; Master bath with separate shower and jetted tub; Second bath with tub/shower combo; Linen closet
- Heating & cooling: Central heating; Central cooling with heat pump; Ceiling fans
- Interior features: Crown molding; Recessed lighting; Security system; Split bedroom floor plan; All window treatments remain; One wood-burning fireplace with stone surround in the living room; Attic access
- Laundry & utility: Main-level laundry room; Washer hookup; Electric dryer hookup
Neighborhood map
What this means for you Summary
Snapshot
- This is a 3-bed/2.0-bath single-family listed at $200k.
Deal economics
- At list price, monthly cash flow is $223 ($3k/yr) — positive.
- The deal already cash-flows at list — no discount required.
- To meet the 1% rule (rent ≥ 1% of price), the offer needs to be $177k (11.6% below list).
- Recommended offer: $176k (12.0% below list) — sets the bar for market timing.
- Cap rate 7.6% vs local median 4.1% in Alabaster — top-decile yield for the area; either an underpriced asset or a hidden risk that comps aren't pricing in. Stress-test before assuming the spread holds.
Location & tenants
- Location reads 76/100 on livability (#14 in AL, #3,512 nationally) — a middle-class / working-renter tenant base. Strengths: employment A+, cost of living A+, housing A+; Watch: amenities D-, commute F, health & safety F.
- Alabaster City (suburban): math 30% / reading 57% proficiency, ranked #17 of 129 in AL (top 13%) — families likely to look elsewhere, expect single-tenant / working-renter base with shorter leases.
- Zoned schools: Creek View Elementary School (math 56% / reading 71%, grade B, #46 of 627 statewide, top 8%, 946 students, 48% FRL); Thompson Middle School (math 24% / reading 57%, grade F, #56 of 257 statewide, top 22%, 1,434 students, 51% FRL); Thompson High School (math 34% / reading 38%, grade F, #43 of 305 statewide, top 14%, 2,203 students, 48% FRL) — zoned schools average 49% FRL vs 31% district-wide (18 pts higher); higher-poverty schools than district average — tighter screening recommended.
- Market conditions: 40 active listings in the ZIP; 2 comparable units currently listed for rent nearby; 987 units permitted in Shelby County in 2024 (0 in 5+ unit buildings).
Forward outlook
- Local home prices are declining (-3.0%/yr); year-one equity from $1k of loan paydown is wiped out by about $6k of value loss. Plan a longer hold.
- Shelby County population projected at +23% by 2050 — long-run rental-demand tailwind backs the buy-and-hold thesis.
Negotiation context
- It's been on market 127 days — a 12% lower offer ($176k) is reasonable based on typical stale-listing flexibility.
- 5 sale attempts since 4y ago; this cycle's ask has dropped $25k (11%) from the opening price — seller is motivated, your offer sets the floor, not the list.
Risks & watch-outs
- Climate carrying-cost: major wind risk, 55% chance of damaging wind over 30y; extreme-heat days projected 7→20/yr by 2055 (HVAC capex compounding) — expect insurance premiums to compound above CPI over the hold.
Questions for the listing agent
- It's been on market 127 days. Have you received any prior offers? Is the seller open to a 12% concession, seller financing, or rate buy-down credit?
- Why hasn't it sold? Are there any deal-killer items the seller is aware of (foundation, flood, title, zoning, code violations)?
- Is there a deadline driving the sale (1031 exchange, divorce, estate, relocation)? That informs how much negotiation room exists.
- Schools are B-rated — typically a magnet for longer-tenancy family renters. What's the average tenant stay here, and is there a school-zone premium baked into asking?
- What's the average days-on-market for RENTAL listings here right now (not sales)? A rising rental-DOM trend means longer vacancies and softer asking-rent achievability than the comps imply.
- What's the recent tenant-quality profile in this submarket — average credit score on applications, eviction rate, late-payment / NSF rate, and stable-employment percentage? A property-management company in the area should have these aggregated.
- How much new for-sale + rental construction is in the pipeline within 1–3 miles? Heavy new supply typically softens prices + rents 12–24 months out; constrained supply supports both.
Investment metrics
- 1% rule
- 0.88% ✗
- Cap rate
- 7.63%
- Cash-on-cash
- 4.78%
- DSCR
- 1.21
- GRM
- 9.4
CMA / ARV
- ARV (on-the-fly)
- $391,391
- Comps found
- 12
Show comp detail 12 sales within ~0.75 mi
| Address | Dist | Beds/Ba | Sqft | Sold | Price | $/sf | Match |
|---|---|---|---|---|---|---|---|
| 223 Grande View Pkwy | 0.30mi | 4/3.5 (+1) | 2,389 (-2%) | 9mo | $385,000 | $161 | 65 |
| 143 Grande Club Dr | 0.53mi | 3/3.0 | 2,400 (-1%) | 9mo | $389,000 | $162 | 62 |
| 1101 Grande View Rdg | 0.50mi | 4/2.5 (+1) | 2,566 (+6%) | 1mo | $415,000 | $162 | 60 |
| 2111 N Grande View Ln | 0.41mi | 4/3.5 (+1) | 2,521 (+4%) | 5mo | $420,000 | $167 | 60 |
| 117 Grande View Pkwy | 0.57mi | 3/2.0 | 2,190 (-10%) | 1mo | $349,000 | $159 | 57 |
| 147 Grande View Ln | 0.59mi | 4/3.0 (+1) | 2,514 (+3%) | 3mo | $332,000 | $132 | 55 |
| 605 N Grande View Cir | 0.52mi | 4/3.5 (+1) | 2,546 (+5%) | 12mo | $460,000 | $181 | 47 |
| 101 Grande View Ln | 0.60mi | 4/3.0 (+1) | 2,493 (+3%) | 16mo | $340,000 | $136 | 46 |
| 1077 Grande View Pass | 0.60mi | 4/3.5 (+1) | 2,638 (+8%) | 1mo | $525,000 | $199 | 46 |
| 124 Grande Club Dr | 0.60mi | 3/2.0 | 2,160 (-11%) | 11mo | $133,537 | $62 | 44 |
| 148 Grande View Ln | 0.62mi | 3/3.0 | 2,729 (+12%) | 10mo | $348,500 | $128 | 39 |
| 130 Big Oak Dr | 0.73mi | 4/3.0 (+1) | 2,736 (+12%) | 13mo | $315,000 | $115 | 26 |
Match score weights: distance 35% · size 25% · config 20% · recency 20%. Top-matched comps best support the ARV.
Projected returns pro-forma
-3.0% appreciation · 3.0% rent growth · sell at horizon
- IRR
- -8.9%
- Equity multiple
- 0.67×
- Total profit
- $-18,293
- Equity at exit
- $29,821
- IRR
- 0.5%
- Equity multiple
- 1.04×
- Total profit
- $1,966
- Equity at exit
- $17,292
Cash invested: $56,000 (down + closing). Projections, not guarantees.
Landlord ↔ Tenant lean methodology
- Overall (STATE)
- 90 Strongly Landlord-Friendly
- State Alabama
- 90 Strongly Landlord-Friendly · R+15
- County
- — inherits STATE
- City
- — inherits STATE
ZIP-level market 35114
- Home prices YoY
- -25.9%
- Active inventory
- 40
- Price-to-rent
- 9.4×
Monthly cashflow live
- Estimated rent
- $1,768 medium interval (Pro) →
- Mortgage (P&I)
- −$1,049
- Tax from tax record
- −$41 /mo · $496/yr
- Insurance
- −$83
- HOA
- −$0
- Vacancy / Maint / Mgmt
- −$371
- Net cashflow
- $223
Break-even live
Sensitivity live
| Price | -10% $336 | -5% $280 | +0% $223 | +5% $167 | +10% $110 |
|---|---|---|---|---|---|
| Rent | -10% $84 | -5% $153 | +0% $223 | +5% $293 | +10% $363 |
| Rate | -1.0pp $324 | -0.5pp $274 | base $223 | +0.5pp $171 | +1.0pp $119 |
UW: 25.0% down · 7.5% · 30yr · 1.5% tax · 5.0% vac · 8.0% maint · 8.0% mgmt
Financing live
Cash to close
- Down payment
- $50,000
- Closing costs
- $6,000
- Reserves months
- —
- Total cash needed
- —
Loan-product check · same deal, 3 products live
Conventional
25% down · 7.5% · 30yr
- Down + closing
- —
- Monthly P&I
- —
- Monthly cashflow
- —
- DSCR
- —
- Eligible?
- —
Personal DTI + credit; lowest rate.
DSCR
20% down · 8.5% · 30yr
- Down + closing
- —
- Monthly P&I
- —
- Monthly cashflow
- —
- DSCR
- —
- Eligible?
- —
No personal income docs; deal must DSCR.
Hard money
10% down · 12.0% · 12mo
- Down + closing
- —
- Monthly P&I
- —
- Monthly cashflow
- —
- DSCR
- —
- Eligible?
- —
Short-term bridge; refi at stabilization.
Rent comps 2 comps
| Address | Beds | Baths | Sqft | Rent | $/sqft | DOM | Units | Dist |
|---|---|---|---|---|---|---|---|---|
| 122 Carriage Dr Maylene, AL | 3.0 | 2.5 | 1839 | $1,731 | $0.94 | 45d | 1 | 0.66mi |
| 320 Willow Glen Ct Alabaster, AL | 3.0 | 2.0 | 1652 | $1,855 | $1.12 | 45d | 1 | 1.41mi |
Listing history 11 events
-
2026-05-21price $200,000
-
2026-05-20status Active
-
2026-04-30historical Contingent
-
2026-04-13status Active
-
2026-03-18historical Contingent
-
2026-02-17status Active
-
2026-02-07historical Contingent
-
2026-01-23$225,000 Active
-
2026-01-18historical $225,000
-
2022-09-13status Pending
-
2022-09-05$200,000 Active
ⓘ Source: listings_history table (triggers on properties + properties_extension) + one-shot
backfill from property_details.listing_events for pre-trigger history.
Tax reassessment forecast AL · Resets to sale price
- Current annual tax
- $496 · $41/mo
- Projected year-2 tax
- $820 · $68/mo
- Expected delta
- +$324/yr (+$27/mo · 65.4%)
ⓘ Screening estimate from a state-policy table — verify with the county assessor before closing.
Climate risk First Street
- Flood 1/10 Low FEMA zone X (unshaded) · 0% chance over 30 yrs
- Wildfire 4/10 Moderate
- Heat 6/10 Major 7 d/yr ≥106°F today · 20 d/yr by 30 yrs out
- Wind 6/10 Major 55% chance of damaging wind over 30 yrs
- Air quality 3/10 Moderate 3 unhealthy d/yr today · 3 by 30 yrs out
Nearby sold comps map
Loading sold comps map…
Walkable amenities ~0.75 mi
Loading nearby amenities…
Taxation est. · year 1
- Rental income
- $21,216
- − Mortgage interest
- −$11,203
- − Property taxes
- −$496
- − Insurance
- −$1,000
- − Repairs & maintenance
- −$1,697
- − Management
- −$1,697
- − Depreciation
- −$5,818
- Taxable loss
- −$696
- Est. tax savings @ 24.0%
- +$167
- After-tax cash flow
- $2,846/yr
For passive investors: Depreciation is non-cash, so a rental often shows a tax loss while cash-flowing — sheltering income. Rental losses are passive: they offset passive income freely, and up to $25,000/yr can offset ordinary (W-2) income if you actively participate and your MAGI is under $100k (phasing out to $0 by $150k); unused losses carry forward. On sale, claimed depreciation is recaptured at up to 25%, and gains may owe capital-gains tax (a 1031 exchange can defer both). Figures are a year-1 estimate at your 24.0% rate — not tax advice; consult a CPA.
Schools (NCES district)
- District
- Alabaster City
- NCES district ID
- 0100190
- Math proficiency
- 30% ▼ -27.00%
- Reading proficiency
- 57% ▲ 5.00%
- Median HH income
- $68,690
- Composite
- 39.07/100
- National rank
- #4052
- State rank
- #17 of 129 in AL
Livability — Alabaster
- Score
- 76/100
- State rank
- #14
- US rank
- #3512
Category grades
Schools grade is shown separately in the Schools card above.
Census & demographics
- Census place
- Alabaster, AL
- City population
- 28,586
- Population (ZIP)
- 7,777
Population outlook (Shelby County) Hauer SSP2
- Today (2025)
- 237,024 people
- By 2030
- 249,868 · +5.4%
- By 2040
- 272,778 · +15.1%
- By 2050
- 291,062 · +22.8%
- By 2075
- 326,049 · +37.6%
- By 2100
- 335,870 · +41.7%
Race, ethnicity, and origin ACS 2023
- Neighborhood character
- Predominantly White (75%)
- Race & ethnicity
- White 75% Black 15% Hispanic / Latino 7% Two or more races 2% Native American 2%
- Hispanic origin (detail)
- Mexican 4%
- Common ancestry
- Slovak 4% Serbian 2% Romanian 2%
- Foreign-born
- 6% · Canada
- Languages at home
- 94% English-only · Spanish 5%
Political lean MEDSL · Shelby
- 2024 margin
- Solid R (+40.9) · D 29.0% · R 69.9% · Other 1.1%
- 2008→2024 swing
- +12.6pp toward D · 2008: -53.4pp · 2024: -40.9pp
- All cycles
- 2024: R+40.9 2020: R+40.4 2016: R+50.3 2012: R+55.6 2008: R+53.4
Not yet ingested
- Civics
- —
Market trends
- HPI YoY
- ▼ -73.31%
- Current HPI
- 209.5917
- Rent YoY
- —
- Metro
- —
- State GDP YoY
- ▲ 2.94%
- F500 in state
- 4
Industry mix (Fortune 500 HQ in AL)
| Industry | F500 HQs | Revenue |
|---|---|---|
| Financial Services | 1 | $8B |
|
||
| Healthcare | 1 | $5B |
|
||
Price history
+0.0% since first listed11 events — show timeline
- 2026-05-21 Price Changed $200,000 Greater Alabama MLS
- 2026-05-20 Relisted — Greater Alabama MLS
- 2026-04-30 Contingent — Greater Alabama MLS
- 2026-04-13 Relisted — Greater Alabama MLS
- 2026-03-18 Contingent — Greater Alabama MLS
- 2026-02-17 Relisted — Greater Alabama MLS
- 2026-02-07 Contingent — Greater Alabama MLS
- 2026-01-23 Listed $225,000 Greater Alabama MLS
- 2026-01-18 Coming Soon $225,000 Greater Alabama MLS
- 2022-09-13 Pending — VMLS
- 2022-09-05 Listed $200,000 VMLS
Property tax history
+4.8%/yrLatest (2025): $496 · +7.5% YoY. Source: county tax records.
Cash-flow waterfall
monthlySold comps — $/sqft
last 12 mo · ≤1 miLoading sold comps…