106 Nottingham Ct · Montgomery, AL
Flood risk 6/10 · Moderate
- FEMA flood zone
- X (unshaded)
- Chance of flooding over 30 yrs
- 0.71%
- Est. flood insurance / yr
- $473 – $860
Fire risk 3/10 · Minor
- Est. fire insurance / yr
- $916 – $1,700
Heat risk 7/10 · Major
- Hot days now (above 107°F)
- 6 days/yr
- Hot days in 30 yrs
- 17 days/yr
Wind risk 8/10 · Major
- Chance of severe wind over 30 yrs
- 80.0%
Air-quality risk 3/10 · Minor
- Unhealthy air days now
- 4 days/yr
- Unhealthy air days in 30 yrs
- 4 days/yr
Risk factors via First Street. Map © Google.
Why this score? — see what drove the B- grade
The composite is a weighted blend of 9 inputs, each scored 0–100. Each bar is that input's sub-score; the figure is the points it added to the 100-point composite (weight × sub-score).
- Cash flow +30.0/30.0
- DSCR +10.0/10.0
- 1% rule +8.2/10.0
- ARV discount +8.0/15.0
- Rent growth +3.2/5.0
- Livability +3.2/5.0
- Condition / age +2.5/5.0
- Schools +1.7/10.0
- Appreciation +0.0/10.0
$99,900
🖨 Deal sheet (PDF) 📄 Offer letter ✓ Due diligence
Listing remarks MLS
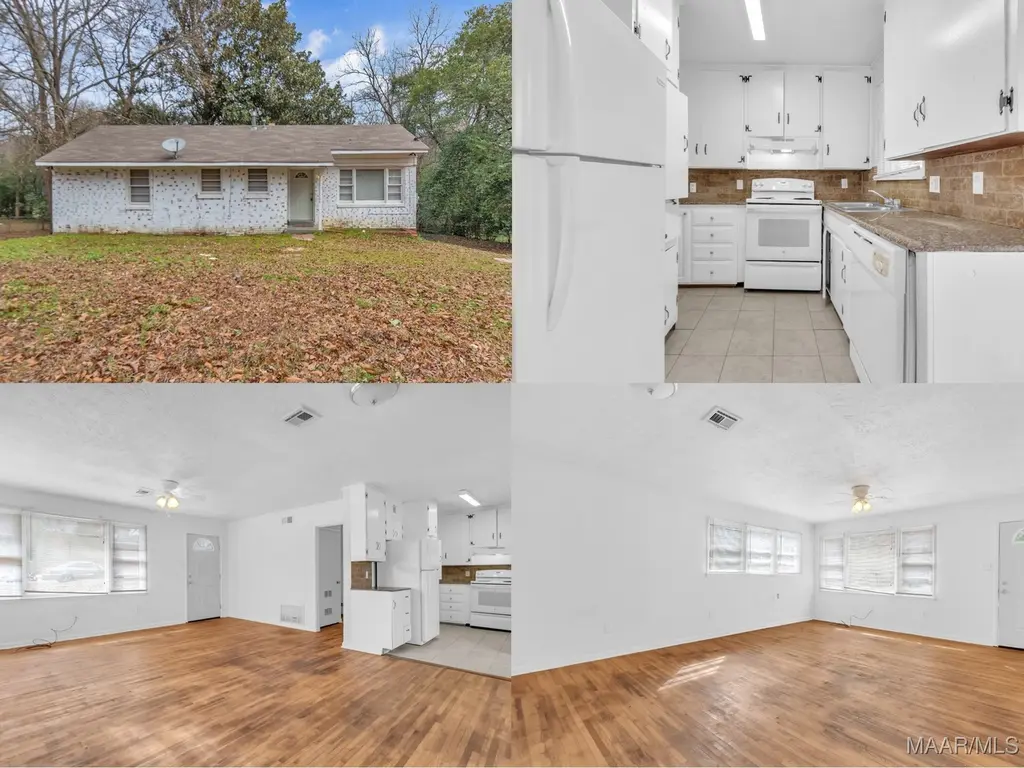
Welcome home to this inviting single-story ranch offering comfort, simplicity, and fresh updates throughout. This home features a bright, open living space with beautiful hardwood floors and abundant natural light from multiple windows. The kitchen showcases crisp white cabinetry, matching appliances, ample counter space, and a functional layout perfect for everyday living. The home offers well-proportioned rooms, neutral paint tones, and a seamless flow that makes the space feel open and welcoming. Step outside to enjoy a spacious yard surrounded by mature trees, providing privacy and plenty of room for outdoor activities or future landscaping. Conveniently laid out and move-in ready. Don’t miss the opportunity to make this charming home your own! Roof replaced in 2020.
Key facts
- Single-story ranch
- Matching appliances
- Hardwood floors
Tags
Neighborhood map
What this means for you Summary
Snapshot
- This is a 3-bed/2.0-bath single-family listed at $100k.
Deal economics
- At list price, monthly cash flow is $381 ($5k/yr) — positive.
- The deal already cash-flows at list — no discount required.
- Meets the 1% rule at list price ($1k rent vs $100k).
- Recommended offer: $88k (12.0% below list) — sets the bar for market timing.
- Cap rate 10.9% vs local median 6.0% in Montgomery — top-decile yield for the area; either an underpriced asset or a hidden risk that comps aren't pricing in. Stress-test before assuming the spread holds.
Location & tenants
- Location reads 65/100 on livability (#138 in AL) — a middle-class / working-renter tenant base. Strengths: cost of living A+, housing A+; Watch: employment D, crime F, amenities D-.
- Montgomery County (urban): math 9% / reading 31% proficiency, ranked #106 of 129 in AL (top 82%) — low school quality limits family demand, transient renter base, plan for 1-2y turnover; 70% free/reduced lunch — lower-income household profile, screen leases tightly.
- Zoned schools: Flowers Elementary School (math 2% / reading 27%, grade F, #508 of 627 statewide, top 84%, 394 students, 74% FRL); Goodwyn Middle School (math 0% / reading 16%, grade F, #239 of 257 statewide, top 93%, 808 students, 84% FRL); Lee High School (math 2% / reading 8%, grade F, #276 of 305 statewide, top 95%, 1,374 students, 86% FRL).
- Market conditions: Rents rising (+2.6%/yr); 209 active listings in the ZIP; 40 comparable units currently listed for rent nearby; rentals at typical pace (median 23d on market — plan ~3-4 weeks tenant-placement turnaround); 48% of comp listings sitting > 30 days — soft ceiling on asking rent; 460 units permitted in Montgomery County in 2024 (37 in 5+ unit buildings).
Forward outlook
- Local home prices are declining (-3.0%/yr); year-one equity from $691 of loan paydown is wiped out by about $3k of value loss. Plan a longer hold.
- Montgomery County population projected to shrink 8% by 2050 — rents likely to lag national; underwrite the cash flow, not the appreciation.
- At projected returns (-3.0% appreciation + 2.6% rent growth), your $28k cash investment doubles in ~8 years — after that, you're playing with house money.
Negotiation context
- It's been on market 137 days — a 12% lower offer ($88k) is reasonable based on typical stale-listing flexibility.
- 2 sale attempts since 11y ago; this cycle's ask has dropped $10k (9%) from the opening price — seller is motivated, your offer sets the floor, not the list.
- Current owner paid $67k; 49% above their basis — modest negotiation headroom, anchor on the comps not their cost.
Risks & watch-outs
- Watch-outs: built in 1956 — expect roof / HVAC / electrical / plumbing capex.
- Climate carrying-cost: major flood risk; severe wind risk, 80% chance of damaging wind over 30y; extreme-heat days projected 6→17/yr by 2055 (HVAC capex compounding) — expect insurance premiums to compound above CPI over the hold.
Questions for the listing agent
- It's been on market 137 days. Have you received any prior offers? Is the seller open to a 12% concession, seller financing, or rate buy-down credit?
- Built in 1956 — when were the roof, HVAC, electrical panel, plumbing, and water heater last replaced?
- Why hasn't it sold? Are there any deal-killer items the seller is aware of (foundation, flood, title, zoning, code violations)?
- Is there a deadline driving the sale (1031 exchange, divorce, estate, relocation)? That informs how much negotiation room exists.
- Crime grade is F in this area — have there been break-ins, vandalism, or insurance claims at this property in the last 3 years? What carrier currently insures it and at what premium?
- What's the average days-on-market for RENTAL listings here right now (not sales)? A rising rental-DOM trend means longer vacancies and softer asking-rent achievability than the comps imply.
- What's the recent tenant-quality profile in this submarket — average credit score on applications, eviction rate, late-payment / NSF rate, and stable-employment percentage? A property-management company in the area should have these aggregated.
- How much new for-sale + rental construction is in the pipeline within 1–3 miles? Heavy new supply typically softens prices + rents 12–24 months out; constrained supply supports both.
Investment metrics
- 1% rule
- 1.32% ✓
- Cap rate
- 10.87%
- Cash-on-cash
- 16.36%
- DSCR
- 1.73
- GRM
- 6.3
CMA / ARV
- ARV (median comp)
- $101,055
- List price
- $99,900
- Delta
- -1.14%
- Verdict
- FAIR
- Comps
- 20 within 1.0 mi
Show comp detail 12 sales within ~0.75 mi
| Address | Dist | Beds/Ba | Sqft | Sold | Price | $/sf | Match |
|---|---|---|---|---|---|---|---|
| 3508 Cottonwood Dr | 0.25mi | 3/1.5 | 1,066 (-3%) | 10mo | $93,000 | $87 | 73 |
| 238 Easthaven Rd | 0.28mi | 3/2.0 | 1,188 (+8%) | 5mo | $77,900 | $66 | 70 |
| 3405 Vermont Dr | 0.37mi | 3/1.5 | 1,061 (-4%) | 6mo | $88,000 | $83 | 70 |
| 3618 Nottingham Rd | 0.50mi | 3/1.0 | 1,035 (-6%) | 6mo | $97,000 | $94 | 57 |
| 3831 Avondale Ct | 0.71mi | 3/2.0 | 1,144 (+4%) | 4mo | $151,000 | $132 | 57 |
| 3700 Ramos Ct | 0.46mi | 3/2.0 | 1,232 (+12%) | 3mo | $134,400 | $109 | 56 |
| 3556 N Wareingwood Dr | 0.56mi | 3/1.0 | 1,215 (+10%) | 3mo | $71,500 | $59 | 50 |
| 508 Forest Hills Dr | 0.57mi | 3/2.0 | 1,267 (+15%) | 1mo | $55,500 | $44 | 47 |
| 3712 Ware Ct | 0.37mi | 2/1.0 (-1) | 1,240 (+12%) | 8mo | $135,000 | $109 | 46 |
| 302 Whetstone Dr | 0.62mi | 2/1.0 (-1) | 1,025 (-7%) | 8mo | $72,000 | $70 | 44 |
| 2933 Willow Lane Dr | 0.70mi | 3/2.0 | 1,234 (+12%) | 7mo | $121,000 | $98 | 42 |
| 3515 Pelzer Ave | 0.68mi | 2/1.0 (-1) | 1,194 (+8%) | 4mo | $110,000 | $92 | 42 |
Match score weights: distance 35% · size 25% · config 20% · recency 20%. Top-matched comps best support the ARV.
Projected returns pro-forma
-3.0% appreciation · 2.65% rent growth · sell at horizon
- IRR
- 7.0%
- Equity multiple
- 1.27×
- Total profit
- $7,640
- Equity at exit
- $14,895
- IRR
- 16.0%
- Equity multiple
- 2.29×
- Total profit
- $36,049
- Equity at exit
- $8,638
Cash invested: $27,972 (down + closing). Projections, not guarantees.
Landlord ↔ Tenant lean methodology
- Overall (STATE)
- 90 Strongly Landlord-Friendly
- State Alabama
- 90 Strongly Landlord-Friendly · R+15
- County
- — inherits STATE
- City
- — inherits STATE
ZIP-level market 36109
- Home prices YoY
- -20.1%
- Rents YoY
- 2.6%
- Active inventory
- 209
- Price-to-rent
- 6.3×
Monthly cashflow live
- Estimated rent
- $1,317 high interval (Pro) →
- Mortgage (P&I)
- −$524
- Tax from tax record
- −$94 /mo · $1,125/yr
- Insurance
- −$42
- HOA
- −$0
- Vacancy / Maint / Mgmt
- −$277
- Net cashflow
- $381
Break-even live
Sensitivity live
| Price | -10% $438 | -5% $410 | +0% $381 | +5% $353 | +10% $325 |
|---|---|---|---|---|---|
| Rent | -10% $277 | -5% $329 | +0% $381 | +5% $433 | +10% $485 |
| Rate | -1.0pp $432 | -0.5pp $407 | base $381 | +0.5pp $355 | +1.0pp $329 |
UW: 25.0% down · 7.5% · 30yr · 1.5% tax · 5.0% vac · 8.0% maint · 8.0% mgmt
Financing live
Cash to close
- Down payment
- $24,975
- Closing costs
- $2,997
- Reserves months
- —
- Total cash needed
- —
Loan-product check · same deal, 3 products live
Conventional
25% down · 7.5% · 30yr
- Down + closing
- —
- Monthly P&I
- —
- Monthly cashflow
- —
- DSCR
- —
- Eligible?
- —
Personal DTI + credit; lowest rate.
DSCR
20% down · 8.5% · 30yr
- Down + closing
- —
- Monthly P&I
- —
- Monthly cashflow
- —
- DSCR
- —
- Eligible?
- —
No personal income docs; deal must DSCR.
Hard money
10% down · 12.0% · 12mo
- Down + closing
- —
- Monthly P&I
- —
- Monthly cashflow
- —
- DSCR
- —
- Eligible?
- —
Short-term bridge; refi at stabilization.
Rent comps 40 comps
| Address | Beds | Baths | Sqft | Rent | $/sqft | DOM | Units | Dist |
|---|---|---|---|---|---|---|---|---|
| 118 Nottingham Ct Montgomery, AL | 3.0 | 2.0 | 1344 | $1,275 | $0.95 | 45d | 1 | 0.02mi |
| 3515 Cottonwood Dr Montgomery, AL | 3.0 | 1.5 | 1246 | $1,350 | $1.08 | 45d | 1 | 0.23mi |
| 3602 Little John Dr Montgomery, AL | 4.0 | 1.0 | 1286 | $1,400 | $1.09 | 23d | 1 | 0.23mi |
| 239 Forest Hills Dr Montgomery, AL | 4.0 | 1.5 | 1500 | $1,450 | $0.97 | 23d | 1 | 0.34mi |
| 3334 Cottonwood Dr Montgomery, AL | 3.0 | 2.0 | 1025 | $1,295 | $1.26 | 15d | 1 | 0.39mi |
| 103 Dalraida Rd Unit D Montgomery, AL | 2.0 | 2.0 | 838 | $875 | $1.04 | 45d | 1 | 0.42mi |
| 3329 Vermont Dr Montgomery, AL | 3.0 | 1.5 | 1465 | $1,395 | $0.95 | 15d | 1 | 0.43mi |
| 107 Dalraida Rd Unit A Montgomery, AL | 3.0 | 2.0 | 1237 | $1,200 | $0.97 | 45d | 1 | 0.46mi |
| 3233 Hillcrest Ln Montgomery, AL | 3.0 | 2.0 | 1278 | $1,395 | $1.09 | 23d | 1 | 0.47mi |
| 688 Joryne Dr Montgomery, AL | 3.0 | 2.0 | 1500 | $1,200 | $0.80 | 45d | 1 | 0.48mi |
| 3319 Willow Lane Dr Montgomery, AL | 3.0 | 2.0 | 1032 | $1,200 | $1.16 | 45d | 1 | 0.49mi |
| 860 Greg Dr Montgomery, AL | 3.0 | 2.0 | 1400 | $1,295 | $0.93 | 15d | 1 | 0.64mi |
| 67 Holliday Dr Montgomery, AL | 3.0 | 1.0 | 1156 | $1,200 | $1.04 | 45d | 1 | 0.65mi |
| 4046 Camellia Dr Unit 1 Montgomery, AL | 3.0 | 2.0 | 1500 | $1,200 | $0.80 | 45d | 1 | 0.67mi |
| 895 Greg Dr Montgomery, AL | 3.0 | 2.0 | 1489 | $1,600 | $1.07 | 15d | 1 | 0.76mi |
| 186 E Salem Dr Montgomery, AL | 3.0 | 1.0 | 1040 | $1,195 | $1.15 | 23d | 1 | 0.76mi |
| 4023 Ware Hill Dr Unit 1507324P Montgomery, AL | 2.0 | 2.0 | 1420 | $4,076 | $2.87 | 15d | 1 | 0.77mi |
| 200 Eton Rd Montgomery, AL | 3.0 | 1.5 | 1500 | $895 | $0.60 | 15d | 1 | 0.79mi |
| 610 S Georgetown Dr Unit 1386555P Montgomery, AL | 3.0 | 1.0 | 1474 | $3,635 | $2.47 | 15d | 1 | 0.86mi |
| 122 Oak Forest Dr Montgomery, AL | 3.0 | 1.0 | 1092 | $975 | $0.89 | 23d | 1 | 0.88mi |
| 3456 Harrison Rd Montgomery, AL | 3.0 | 1.0 | 1008 | $1,300 | $1.29 | 45d | 1 | 0.91mi |
| 7 Calhoun Rd Unit B Montgomery, AL | 2.0 | 1.0 | 961 | $850 | $0.88 | 45d | 1 | 0.93mi |
| 301 Bradley Dr Montgomery, AL | 2.0 | 1.0 | 841 | $935 | $1.11 | 15d | 1 | 0.93mi |
| 311 Bradley Dr Montgomery, AL | 3.0 | 1.0 | 1104 | $825 | $0.75 | 45d | 1 | 0.95mi |
| 15 Bradley Dr Montgomery, AL | 3.0 | 2.0 | 1365 | $1,500 | $1.10 | 23d | 1 | 0.95mi |
| 108 Calhoun Rd Unit 108B Montgomery, AL | 2.0 | 1.0 | 1350 | $750 | $0.56 | 45d | 1 | 0.97mi |
| 319 Olivia Ct Montgomery, AL | 2.0 | 1.0 | 850 | $700 | $0.82 | 23d | 1 | 0.98mi |
| 3323 Bedford Ln Montgomery, AL | 3.0 | 2.0 | 1134 | $1,200 | $1.06 | 23d | 1 | 1.03mi |
| 1117 Karen Rd Montgomery, AL | 3.0 | 1.0 | 1308 | $1,195 | $0.91 | 45d | 1 | 1.03mi |
| 3346 Bedford Ln Montgomery, AL | 3.0 | 1.0 | 1134 | $1,295 | $1.14 | 15d | 1 | 1.04mi |
| 750 S Marquette Dr Montgomery, AL | 3.0 | 1.0 | 1325 | $1,195 | $0.90 | 45d | 1 | 1.05mi |
| 804 Hillman St Montgomery, AL | 3.0 | 2.0 | 1356 | $1,295 | $0.96 | 23d | 1 | 1.10mi |
| 804 Hillman St Montgomery, AL | 3.0 | 2.0 | 1370 | $1,295 | $0.95 | 15d | 1 | 1.10mi |
| 1154 Lakewood Dr Montgomery, AL | 3.0 | 2.0 | 1066 | $1,350 | $1.27 | 45d | 1 | 1.11mi |
| 3136 Harrison Rd Montgomery, AL | 3.0 | 1.5 | 1355 | $1,025 | $0.76 | 45d | 1 | 1.19mi |
| 4365 Hillside Oaks Montgomery, AL | 2.0 | 2.0 | 1204 | $1,500 | $1.25 | 45d | 1 | 1.20mi |
| 4041A Beth Manor Dr Montgomery, AL | 1.0–3.0 | 1.0–2.0 | 925 | $1,000 | $1.08 | 23d | 20 | 1.21mi |
| 3318 Habersham Rd Montgomery, AL | 3.0 | 2.0 | 1134 | $1,250 | $1.10 | 15d | 1 | 1.23mi |
| 700 Coliseum Blvd Unit 700D Montgomery, AL | 2.0 | 1.0 | 911 | $895 | $0.98 | 45d | 1 | 1.23mi |
| 1216 Beechdale Rd Montgomery, AL | 4.0 | 2.0 | 1495 | $1,325 | $0.89 | 45d | 1 | 1.27mi |
Listing history 22 events
-
2026-06-21days on market $99,900 Active 137 DOM
-
2026-06-18days on market $99,900 Active 134 DOM
-
2026-06-17days on market $99,900 Active 133 DOM
-
2026-06-16days on market $99,900 Active 132 DOM
-
2026-06-15days on market $99,900 Active 131 DOM
-
2026-06-14days on market $99,900 Active 129 DOM
-
2026-06-13days on market $99,900 Active 128 DOM
-
2026-06-10days on market $99,900 Active 126 DOM
-
2026-06-09days on market $99,900 Active 125 DOM
-
2026-06-08days on market $99,900 Active 124 DOM
-
2026-06-07days on market $99,900 Active 123 DOM
-
2026-06-03days on market $99,900 Active 119 DOM
-
2026-06-02days on market $99,900 Active 118 DOM
-
2026-06-01days on market $99,900 Active 117 DOM
-
2026-05-31days on market $99,900 Active 116 DOM
-
2026-05-30days on market $99,900 Active 115 DOM
-
2026-04-14price $99,900 787-char remark
Show marketing remark (787 chars)
Welcome home to this inviting single-story ranch offering comfort, simplicity, and fresh updates throughout. This home features a bright, open living space with beautiful hardwood floors and abundant natural light from multiple windows. The kitchen showcases crisp white cabinetry, matching appliances, ample counter space, and a functional layout perfect for everyday living. The home offers well-proportioned rooms, neutral paint tones, and a seamless flow that makes the space feel open and welcoming. Step outside to enjoy a spacious yard surrounded by mature trees, providing privacy and plenty of room for outdoor activities or future landscaping. Conveniently laid out and move-in ready. Don’t miss the opportunity to make this charming home your own! Roof replaced in 2020.
-
2026-03-04price $104,900 787-char remark
Show marketing remark (787 chars)
Welcome home to this inviting single-story ranch offering comfort, simplicity, and fresh updates throughout. This home features a bright, open living space with beautiful hardwood floors and abundant natural light from multiple windows. The kitchen showcases crisp white cabinetry, matching appliances, ample counter space, and a functional layout perfect for everyday living. The home offers well-proportioned rooms, neutral paint tones, and a seamless flow that makes the space feel open and welcoming. Step outside to enjoy a spacious yard surrounded by mature trees, providing privacy and plenty of room for outdoor activities or future landscaping. Conveniently laid out and move-in ready. Don’t miss the opportunity to make this charming home your own! Roof replaced in 2020.
-
2026-02-04$109,900 Active 787-char remark
Show marketing remark (787 chars)
Welcome home to this inviting single-story ranch offering comfort, simplicity, and fresh updates throughout. This home features a bright, open living space with beautiful hardwood floors and abundant natural light from multiple windows. The kitchen showcases crisp white cabinetry, matching appliances, ample counter space, and a functional layout perfect for everyday living. The home offers well-proportioned rooms, neutral paint tones, and a seamless flow that makes the space feel open and welcoming. Step outside to enjoy a spacious yard surrounded by mature trees, providing privacy and plenty of room for outdoor activities or future landscaping. Conveniently laid out and move-in ready. Don’t miss the opportunity to make this charming home your own! Roof replaced in 2020.
-
2020-02-26soldstatus $67,000
-
2015-12-14soldstatus $20,154 265-char remark
Show marketing remark (265 chars)
REO PROPERTY-BANK OWNED. PROPERTY SOLD AS IS. The Listing Broker & Seller assume no responsibility & make no guarantees, warranties or representations as to accuracy of the property information or photographs. Buyer to turn on Utilities for INSPECTIONS.
-
2015-08-26$18,200 265-char remark
Show marketing remark (265 chars)
REO PROPERTY-BANK OWNED. PROPERTY SOLD AS IS. The Listing Broker & Seller assume no responsibility & make no guarantees, warranties or representations as to accuracy of the property information or photographs. Buyer to turn on Utilities for INSPECTIONS.
ⓘ Source: listings_history table (triggers on properties + properties_extension) + one-shot
backfill from property_details.listing_events for pre-trigger history.
Tax reassessment forecast AL · Resets to sale price
- Current annual tax
- $1,125 · $94/mo
- Projected year-2 tax
- $1,125 · $94/mo
- Expected delta
- $0/yr ($0/mo · 0.0%)
ⓘ Screening estimate from a state-policy table — verify with the county assessor before closing.
Climate risk First Street
- Flood 6/10 Major FEMA zone X (unshaded) · 71% chance over 30 yrs
- Wildfire 3/10 Moderate
- Heat 7/10 Severe 6 d/yr ≥107°F today · 17 d/yr by 30 yrs out
- Wind 8/10 Severe 80% chance of damaging wind over 30 yrs
- Air quality 3/10 Moderate 4 unhealthy d/yr today · 4 by 30 yrs out
Nearby sold comps map
Loading sold comps map…
Walkable amenities ~0.75 mi
Loading nearby amenities…
Taxation est. · year 1
- Rental income
- $15,807
- − Mortgage interest
- −$5,596
- − Property taxes
- −$1,125
- − Insurance
- −$500
- − Repairs & maintenance
- −$1,265
- − Management
- −$1,265
- − Depreciation
- −$2,906
- Taxable income
- $3,151
- Est. tax owed @ 24.0%
- −$756
- After-tax cash flow
- $3,820/yr
For passive investors: Depreciation is non-cash, so a rental often shows a tax loss while cash-flowing — sheltering income. Rental losses are passive: they offset passive income freely, and up to $25,000/yr can offset ordinary (W-2) income if you actively participate and your MAGI is under $100k (phasing out to $0 by $150k); unused losses carry forward. On sale, claimed depreciation is recaptured at up to 25%, and gains may owe capital-gains tax (a 1031 exchange can defer both). Figures are a year-1 estimate at your 24.0% rate — not tax advice; consult a CPA.
Schools (NCES district)
- District
- Montgomery County
- NCES district ID
- 0102430
- Math proficiency
- 9% ▼ -21.00%
- Reading proficiency
- 31% ▼ -1.00%
- Median HH income
- $43,902
- Composite
- 17.24/100
- National rank
- #9093
- State rank
- #106 of 129 in AL
Livability — Montgomery
- Score
- 65/100
- State rank
- #138
- US rank
- #13416
Category grades
Schools grade is shown separately in the Schools card above.
Census & demographics
- Census place
- Montgomery, AL
- County
- Montgomery County · 190,016 people
- City population
- 175,913
- Metro
- Montgomery, AL
- Population (ZIP)
- 23,581
- Household income
- $59,193
- Rent vs Own
- Severe rent burden
- 1039.0
Population outlook (Montgomery County) Hauer SSP2
- Today (2025)
- 224,008 people
- By 2030
- 221,460 · -1.1%
- By 2040
- 214,179 · -4.4%
- By 2050
- 204,912 · -8.5%
- By 2075
- 177,821 · -20.6%
- By 2100
- 145,134 · -35.2%
Race, ethnicity, and origin ACS 2023
- Neighborhood character
- Diverse neighborhood (Simpson 0.60)
- Race & ethnicity
- White 49% Black 39% Hispanic / Latino 8% Two or more races 4%
- Hispanic origin (detail)
- Mexican 4%
- Common ancestry
- Slovak 2% Lithuanian 1% Serbian 1%
- Foreign-born
- 4% · Canada, South Korea
- Languages at home
- 94% English-only · Spanish 5%
Political lean MEDSL · Montgomery
- 2024 margin
- Solid D (+30.7) · D 64.8% · R 34.1% · Other 1.1%
- 2008→2024 swing
- +11.5pp toward D · 2008: 19.2pp · 2024: 30.7pp
- All cycles
- 2024: D+30.7 2020: D+31.5 2016: D+26.2 2012: D+24.3 2008: D+19.2
Not yet ingested
- Civics
- —
Market trends
- HPI YoY
- ▼ -37.64%
- Current HPI
- 149.3867
- Rent YoY
- ▲ 2.65%
- Metro
- Montgomery, AL
- State GDP YoY
- ▲ 2.94%
- F500 in state
- 4
Industry mix (Fortune 500 HQ in AL)
| Industry | F500 HQs | Revenue |
|---|---|---|
| Financial Services | 1 | $8B |
|
||
| Healthcare | 1 | $5B |
|
||
Price history
+448.9% since first listed6 events — show timeline
- 2026-04-14 Price Changed $99,900 MAAR
- 2026-03-04 Price Changed $104,900 MAAR
- 2026-02-04 Listed $109,900 MAAR
- 2020-02-26 Sold (Public Records) $67,000 Public Records
- 2015-12-14 Sold (MLS) $20,154 MAAR
- 2015-08-26 Listed $18,200 MAAR
Property tax history
+14.5%/yrLatest (2025): $1,125 · +2.6% YoY. Source: county tax records.
Cash-flow waterfall
monthlySold comps — $/sqft
last 12 mo · ≤1 miLoading sold comps…