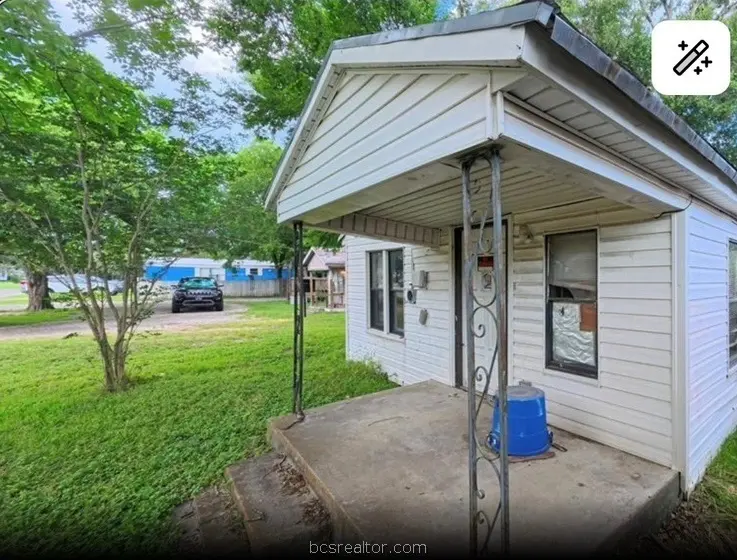
1203 Boulevard St · Bryan, TX
Flood risk 4/10 · Minor
- FEMA flood zone
- X (shaded)
- Chance of flooding over 30 yrs
- 0.2%
- Est. flood insurance / yr
- $507 – $1,088
Fire risk 3/10 · Minor
- Est. fire insurance / yr
- $1,222 – $2,270
Heat risk 8/10 · Major
- Hot days now (above 110°F)
- 7 days/yr
- Hot days in 30 yrs
- 24 days/yr
Wind risk 8/10 · Major
- Chance of severe wind over 30 yrs
- 80.0%
Air-quality risk 1/10 · Minimal
- Unhealthy air days now
- 0 days/yr
- Unhealthy air days in 30 yrs
- 0 days/yr
Risk factors via First Street. Map © Google.
Why this score? — see what drove the B- grade
The composite is a weighted blend of 9 inputs, each scored 0–100. Each bar is that input's sub-score; the figure is the points it added to the 100-point composite (weight × sub-score).
- Cash flow +30.0/30.0
- 1% rule +10.0/10.0
- DSCR +10.0/10.0
- ARV discount +7.5/15.0
- Livability +3.8/5.0
- Rent growth +2.9/5.0
- Schools +2.6/10.0
- Condition / age +2.5/5.0
- Appreciation +0.0/10.0
$49,999
🖨 Deal sheet (PDF) 📄 Offer letter ✓ Due diligence
Listing remarks MLS
Investor Opportunity!! This house needs work and can be rebuilt with a lot of love and care. Otherwise a tear down and new build
Key facts
- Modern updates
- 5,750 sq ft lot
- Built 1945
Tags
Property features AI
Exterior
- Parking: No on-site parking
- Utilities: Public water; Public sewer; Natural gas available; Phone service available; Sewer available; Water available
- Home design: Single family residence; One-story
- Construction: Pillar/Post/Pier foundation
- Exterior features: Lot in Bridgewater Meadows subdivision; Lot size approximately 0.132 acres
Interior
- Bathrooms: 1 full bathroom
- Heating & cooling: No heating system specified; No cooling system specified
- Interior features: Gas water heater
Neighborhood map
What this means for you Summary
Snapshot
- This is a 2-bed/1.0-bath single-family listed at $50k.
Deal economics
- At list price, monthly cash flow is $615 ($7k/yr) — positive.
- The deal already cash-flows at list — no discount required.
- Meets the 1% rule at list price ($1k rent vs $50k).
- Recommended offer: $47k (6.0% below list) — sets the bar for market timing.
- Cap rate 21.0% vs local median 4.0% in Bryan — top-decile yield for the area; either an underpriced asset or a hidden risk that comps aren't pricing in. Stress-test before assuming the spread holds.
Location & tenants
- Location reads 76/100 on livability (#99 in TX, #3,341 nationally) — a middle-class / working-renter tenant base. Strengths: cost of living A+, housing A+, health & safety A+; Watch: crime C-, amenities C-, employment D+.
- Bryan ISD (urban): math 30% / reading 32% proficiency, ranked #608 of 826 in TX (top 74%) — families likely to look elsewhere, expect single-tenant / working-renter base with shorter leases; 68% free/reduced lunch — lower-income household profile, screen leases tightly.
- Zoned schools: Kemp-Carver El (math 22% / reading 17%, grade F, #3,583 of 4,322 statewide, top 86%, 504 students, 92% FRL); Sam Rayburn (math 42% / reading 34%, grade F, #717 of 1,662 statewide, top 44%, 1,173 students, 74% FRL); James Earl Rudder H S (math 14% / reading 27%, grade F, #1,389 of 1,632 statewide, top 86%, 1,769 students, 76% FRL).
- Market conditions: Rents rising (+1.4%/yr); 288 active listings in the ZIP; 14 comparable units currently listed for rent nearby; rentals lingering (median 46d on market — plan ~5-8 weeks vacancy on turnover, expect pricing pressure); 57% of comp listings sitting > 30 days — soft ceiling on asking rent; 2,211 units permitted in Brazos County in 2024 (768 in 5+ unit buildings).
Forward outlook
- Local home prices are declining (-3.0%/yr); year-one equity from $345 of loan paydown is wiped out by about $2k of value loss. Plan a longer hold.
- Brazos County population projected at +55% by 2050 — long-run rental-demand tailwind backs the buy-and-hold thesis.
- At projected returns (-3.0% appreciation + 1.4% rent growth), your $14k cash investment doubles in ~3 years — after that, you're playing with house money.
Negotiation context
- It's been on market 61 days — a 6% lower offer ($47k) is reasonable based on typical stale-listing flexibility.
- 2 sale attempts; this cycle's ask has dropped $10k (17%) from the opening price — seller is motivated, your offer sets the floor, not the list.
Risks & watch-outs
- Watch-outs: built in 1945 — expect roof / HVAC / electrical / plumbing capex.
- Climate carrying-cost: severe wind risk, 80% chance of damaging wind over 30y; extreme-heat days projected 7→24/yr by 2055 (HVAC capex compounding) — expect insurance premiums to compound above CPI over the hold.
Questions for the listing agent
- It's been on market 61 days. Have you received any prior offers? Is the seller open to a 6% concession, seller financing, or rate buy-down credit?
- Built in 1945 — when were the roof, HVAC, electrical panel, plumbing, and water heater last replaced?
- Why hasn't it sold? Are there any deal-killer items the seller is aware of (foundation, flood, title, zoning, code violations)?
- Is there a deadline driving the sale (1031 exchange, divorce, estate, relocation)? That informs how much negotiation room exists.
- What's the average days-on-market for RENTAL listings here right now (not sales)? A rising rental-DOM trend means longer vacancies and softer asking-rent achievability than the comps imply.
- What's the recent tenant-quality profile in this submarket — average credit score on applications, eviction rate, late-payment / NSF rate, and stable-employment percentage? A property-management company in the area should have these aggregated.
- How much new for-sale + rental construction is in the pipeline within 1–3 miles? Heavy new supply typically softens prices + rents 12–24 months out; constrained supply supports both.
Investment metrics
- 1% rule
- 2.47% ✓
- Cap rate
- 21.04%
- Cash-on-cash
- 52.68%
- DSCR
- 3.34
- GRM
- 3.4
CMA / ARV
- ARV (median comp)
- $143,222
- List price
- $49,999
- Delta
- -65.09%
- Verdict
- UNDERPRICED
- Comps
- 9 within 1.0 mi
Show comp detail 2 sales within ~0.75 mi
| Address | Dist | Beds/Ba | Sqft | Sold | Price | $/sf | Match |
|---|---|---|---|---|---|---|---|
| 1113 Lowery St | 0.14mi | 3/2.0 (+1) | 940 (+9%) | 15mo | $185,000 | $197 | 57 |
| 1115 Lowery St | 0.13mi | 3/2.0 (+1) | 979 (+14%) | 14mo | $188,000 | $192 | 50 |
Match score weights: distance 35% · size 25% · config 20% · recency 20%. Top-matched comps best support the ARV.
Projected returns pro-forma
-3.0% appreciation · 1.43% rent growth · sell at horizon
- IRR
- 48.9%
- Equity multiple
- 3.08×
- Total profit
- $29,145
- Equity at exit
- $7,455
- IRR
- 53.8%
- Equity multiple
- 5.88×
- Total profit
- $68,249
- Equity at exit
- $4,323
Cash invested: $14,000 (down + closing). Projections, not guarantees.
Landlord ↔ Tenant lean methodology
- Overall (STATE)
- 87 Strongly Landlord-Friendly
- State Texas
- 87 Strongly Landlord-Friendly · R+5
- County
- — inherits STATE
- City
- — inherits STATE
ZIP-level market 77803
- Home prices YoY
- -30.1%
- Rents YoY
- 1.4%
- Active inventory
- 288
- Price-to-rent
- 3.4×
Monthly cashflow live
- Estimated rent
- $1,237 high interval (Pro) →
- Mortgage (P&I)
- −$262
- Tax from tax record
- −$80 /mo · $955/yr
- Insurance
- −$21
- HOA
- −$0
- Vacancy / Maint / Mgmt
- −$260
- Net cashflow
- $615
Break-even live
Sensitivity live
| Price | -10% $643 | -5% $629 | +0% $615 | +5% $600 | +10% $586 |
|---|---|---|---|---|---|
| Rent | -10% $517 | -5% $566 | +0% $615 | +5% $663 | +10% $712 |
| Rate | -1.0pp $640 | -0.5pp $627 | base $615 | +0.5pp $602 | +1.0pp $588 |
UW: 25.0% down · 7.5% · 30yr · 1.5% tax · 5.0% vac · 8.0% maint · 8.0% mgmt
Financing live
Cash to close
- Down payment
- $12,500
- Closing costs
- $1,500
- Reserves months
- —
- Total cash needed
- —
Loan-product check · same deal, 3 products live
Conventional
25% down · 7.5% · 30yr
- Down + closing
- —
- Monthly P&I
- —
- Monthly cashflow
- —
- DSCR
- —
- Eligible?
- —
Personal DTI + credit; lowest rate.
DSCR
20% down · 8.5% · 30yr
- Down + closing
- —
- Monthly P&I
- —
- Monthly cashflow
- —
- DSCR
- —
- Eligible?
- —
No personal income docs; deal must DSCR.
Hard money
10% down · 12.0% · 12mo
- Down + closing
- —
- Monthly P&I
- —
- Monthly cashflow
- —
- DSCR
- —
- Eligible?
- —
Short-term bridge; refi at stabilization.
Rent comps 14 comps
| Address | Beds | Baths | Sqft | Rent | $/sqft | DOM | Units | Dist |
|---|---|---|---|---|---|---|---|---|
| 306 W 23rd St Bryan, TX | 3.0 | 1.0 | 999 | $1,500 | $1.50 | 45d | 1 | 0.79mi |
| 501 N Main St Unit 407 Bryan, TX | 1.0 | 1.0 | 707 | $1,300 | $1.84 | 15d | 1 | 0.86mi |
| 501 N Main St Unit 409 Bryan, TX | 1.0 | 1.0 | 721 | $1,350 | $1.87 | 45d | 1 | 0.86mi |
| 501 N Main St Unit 203 Bryan, TX | 1.0 | 1.0 | 708 | $1,300 | $1.84 | 45d | 1 | 0.86mi |
| 401 N Main St Unit 306 Bryan, TX | 1.0 | 1.0 | 640 | $1,000 | $1.56 | 45d | 1 | 0.90mi |
| 206 N Main St Bryan, TX | 1.0 | 1.0 | 597 | $1,125 | $1.88 | 22d | 1 | 0.97mi |
| 207 N Preston Ave Bryan, TX | 2.0 | 2.0 | 1100 | $1,650 | $1.50 | 22d | 1 | 1.21mi |
| 603 S Sims Ave Unit 113 Bryan, TX | 1.0 | 1.0 | 650 | $1,250 | $1.92 | 45d | 1 | 1.29mi |
| 400 Robertson St Bryan, TX | 1.0 | 1.0 | 576 | $725 | $1.26 | 45d | 1 | 1.29mi |
| 700 S Sims Ave Bryan, TX | 2.0 | 1.0 | 918 | $1,150 | $1.25 | 22d | 1 | 1.35mi |
| 1014 E 23rd St Bryan, TX | 1.0 | 1.0 | 700 | $850 | $1.21 | 45d | 1 | 1.44mi |
| 101 W 33rd St Unit 103 Bryan, TX | 1.0 | 1.0 | 615 | $1,250 | $2.03 | 22d | 1 | 1.45mi |
| 514 E 30th St Unit B1 Bryan, TX | 2.0 | 1.5 | 879 | $875 | $1.00 | 46d | 1 | 1.48mi |
| 1300 Baker Ave Bryan, TX | 2.0 | 1.0 | 850 | $970 | $1.14 | 15d | 1 | 1.49mi |
Listing history 23 events
-
2026-06-21days on market $49,999 Active 61 DOM
-
2026-06-18days on market $49,999 Active 58 DOM
-
2026-06-17days on market $49,999 Active 57 DOM
-
2026-06-16days on market $49,999 Active 56 DOM
-
2026-06-15days on market $49,999 Active 55 DOM
-
2026-06-14days on market $49,999 Active 53 DOM
-
2026-06-13pricedays on market $49,999 Active 52 DOM
-
2026-06-10days on market $60,000 Active 50 DOM
-
2026-06-09days on market $60,000 Active 49 DOM
-
2026-06-08days on market $60,000 Active 48 DOM
-
2026-06-07days on market $60,000 Active 47 DOM
-
2026-06-03days on market $60,000 Active 43 DOM
-
2026-06-02days on market $60,000 Active 42 DOM
-
2026-06-01days on market $60,000 Active 41 DOM
-
2026-05-31days on market $60,000 Active 40 DOM
-
2026-05-30days on market $60,000 Active 39 DOM
-
2026-04-21$60,000 Active 547-char remark
-
2025-07-04soldstatus Closed 128-char remark
Show marketing remark (128 chars)
Investor Opportunity!! This house needs work and can be rebuilt with a lot of love and care. Otherwise a tear down and new build
-
2025-07-03soldstatus
-
2025-07-02soldstatus
-
2025-06-24status Pending 128-char remark
Show marketing remark (128 chars)
Investor Opportunity!! This house needs work and can be rebuilt with a lot of love and care. Otherwise a tear down and new build
-
2025-06-06$44,000 Active 128-char remark
Show marketing remark (128 chars)
Investor Opportunity!! This house needs work and can be rebuilt with a lot of love and care. Otherwise a tear down and new build
-
1998-12-15soldstatus
ⓘ Source: listings_history table (triggers on properties + properties_extension) + one-shot
backfill from property_details.listing_events for pre-trigger history.
Tax reassessment forecast TX · Resets to sale price
- Current annual tax
- $955 · $80/mo
- Projected year-2 tax
- $955 · $80/mo
- Expected delta
- $0/yr ($0/mo · 0.0%)
ⓘ Screening estimate from a state-policy table — verify with the county assessor before closing.
Climate risk First Street
- Flood 4/10 Moderate FEMA zone X (shaded) · 20% chance over 30 yrs
- Wildfire 3/10 Moderate
- Heat 8/10 Severe 7 d/yr ≥110°F today · 24 d/yr by 30 yrs out
- Wind 8/10 Severe 80% chance of damaging wind over 30 yrs
- Air quality 1/10 Low 0 unhealthy d/yr today · 0 by 30 yrs out
Nearby sold comps map
Loading sold comps map…
Walkable amenities ~0.75 mi
Loading nearby amenities…
Taxation est. · year 1
- Rental income
- $14,843
- − Mortgage interest
- −$2,801
- − Property taxes
- −$955
- − Insurance
- −$250
- − Repairs & maintenance
- −$1,187
- − Management
- −$1,187
- − Depreciation
- −$1,455
- Taxable income
- $7,008
- Est. tax owed @ 24.0%
- −$1,682
- After-tax cash flow
- $5,693/yr
For passive investors: Depreciation is non-cash, so a rental often shows a tax loss while cash-flowing — sheltering income. Rental losses are passive: they offset passive income freely, and up to $25,000/yr can offset ordinary (W-2) income if you actively participate and your MAGI is under $100k (phasing out to $0 by $150k); unused losses carry forward. On sale, claimed depreciation is recaptured at up to 25%, and gains may owe capital-gains tax (a 1031 exchange can defer both). Figures are a year-1 estimate at your 24.0% rate — not tax advice; consult a CPA.
Schools (NCES district)
- District
- Bryan ISD
- NCES district ID
- 4811790
- Math proficiency
- 30% ▼ -8.00%
- Reading proficiency
- 32% ▼ -3.00%
- Median HH income
- $41,895
- Composite
- 26.26/100
- National rank
- #7253
- State rank
- #608 of 826 in TX
Livability — Bryan
- Score
- 76/100
- State rank
- #99
- US rank
- #3341
Category grades
Schools grade is shown separately in the Schools card above.
Census & demographics
- Census place
- Bryan, TX
- County
- Brazos County · 233,400 people
- City population
- 101,772
- Metro
- College Station-Bryan, TX
- Population (ZIP)
- 31,525
- Household income
- $52,274
- Rent vs Own
- Severe rent burden
- 1094.0
Population outlook (Brazos County) Hauer SSP2
- Today (2025)
- 267,942 people
- By 2030
- 296,630 · +10.7%
- By 2040
- 354,560 · +32.3%
- By 2050
- 414,616 · +54.7%
- By 2075
- 562,158 · +109.8%
- By 2100
- 678,828 · +153.3%
Race, ethnicity, and origin ACS 2023
- Neighborhood character
- Diverse neighborhood (Simpson 0.56)
- Race & ethnicity
- Hispanic / Latino 61% Black 21% Two or more races 18% White 17%
- Hispanic origin (detail)
- Mexican 56%
- Common ancestry
- Lithuanian 1% Romanian 1% Slovak 1%
- Foreign-born
- 21% · Canada, Jamaica, Dominican Republic
- Languages at home
- 52% English-only · Spanish 47%
Political lean MEDSL · Brazos
- 2024 margin
- Strong R (+24.9) · D 36.9% · R 61.7% · Other 1.4%
- 2008→2024 swing
- +4.1pp toward D · 2008: -28.9pp · 2024: -24.9pp
- All cycles
- 2024: R+24.9 2020: R+14.3 2016: R+23.7 2012: R+35.3 2008: R+28.9
Not yet ingested
- Civics
- —
Market trends
- HPI YoY
- ▼ -110.84%
- Current HPI
- 257.2885
- Rent YoY
- ▲ 1.43%
- Metro
- College Station-Bryan, TX
- State GDP YoY
- ▲ 3.95%
- F500 in state
- 110
Industry mix (Fortune 500 HQ in TX)
| Industry | F500 HQs | Revenue |
|---|---|---|
| Energy | 16 | $1,198B |
|
||
| Technology | 5 | $198B |
|
||
| Engineering / Construction | 4 | $72B |
|
||
| Energy Services | 3 | $60B |
|
||
| Utilities | 3 | $41B |
|
||
| Healthcare | 2 | $330B |
|
||
Price history
+13.6% since first listed8 events — show timeline
- 2026-06-10 Price Changed $49,999 BCSRMLS
- 2026-04-21 Listed $60,000 BCSRMLS
- 2025-07-04 Sold (MLS) — HARMLS
- 2025-07-03 Sold (Public Records) — Public Records
- 2025-07-02 Sold (Public Records) — Public Records
- 2025-06-24 Pending — HARMLS
- 2025-06-06 Listed $44,000 HARMLS
- 1998-12-15 Sold (Public Records) — Public Records
Property tax history
+8.1%/yrLatest (2025): $955 · +10.0% YoY. Source: county tax records.
Cash-flow waterfall
monthlySold comps — $/sqft
last 12 mo · ≤1 miLoading sold comps…