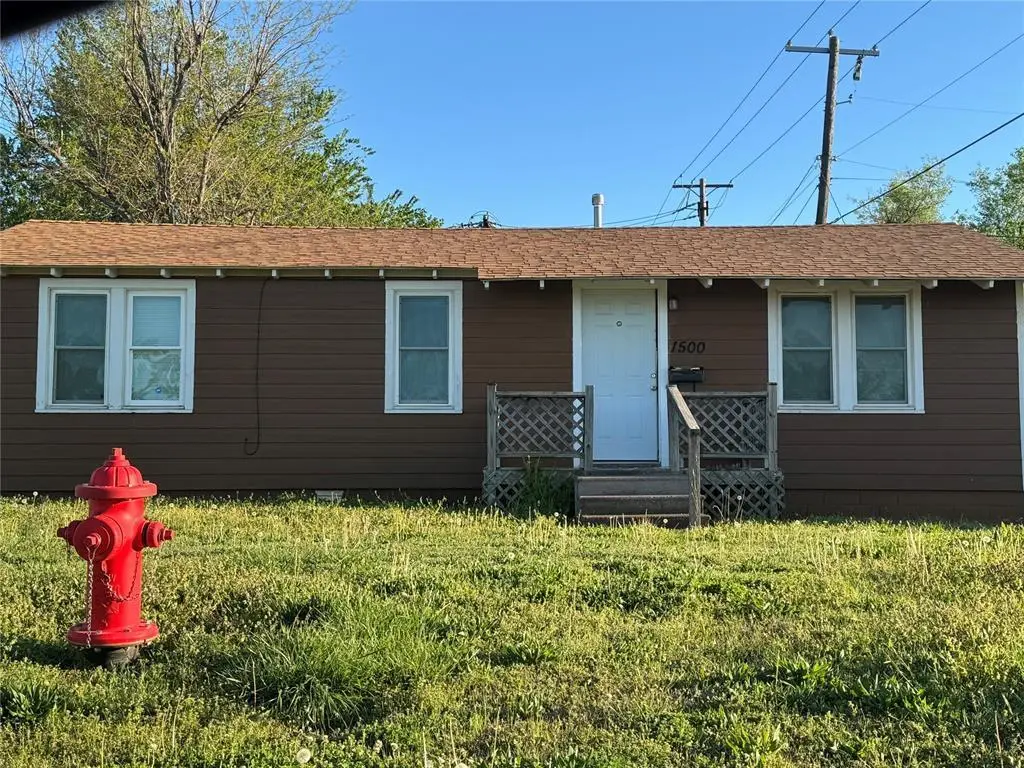
1500 NE 30th St · Oklahoma City, OK
Flood risk 1/10 · Minimal
- FEMA flood zone
- X (unshaded)
- Chance of flooding over 30 yrs
- 0.0%
- Est. flood insurance / yr
- $507 – $1,088
Fire risk 1/10 · Minimal
- Est. fire insurance / yr
- $2,463 – $4,575
Heat risk 6/10 · Moderate
- Hot days now (above 107°F)
- 7 days/yr
- Hot days in 30 yrs
- 19 days/yr
Wind risk 2/10 · Minimal
- Chance of severe wind over 30 yrs
- 3.0%
Air-quality risk 2/10 · Minimal
- Unhealthy air days now
- 1 days/yr
- Unhealthy air days in 30 yrs
- 2 days/yr
Risk factors via First Street. Map © Google.
Why this score? — see what drove the B+ grade
The composite is a weighted blend of 9 inputs, each scored 0–100. Each bar is that input's sub-score; the figure is the points it added to the 100-point composite (weight × sub-score).
- Cash flow +30.0/30.0
- ARV discount +15.0/15.0
- 1% rule +10.0/10.0
- DSCR +10.0/10.0
- Livability +4.0/5.0
- Rent growth +3.0/5.0
- Condition / age +2.5/5.0
- Schools +0.7/10.0
- Appreciation +0.0/10.0
$50,000
🖨 Deal sheet 📄 Offer letter ✓ Due diligence
Listing remarks
Charming home with great potential, perfect for investors or buyers looking to add their personal touch. This property is being sold as-is and will require repairs, making it an excellent opportunity for renovation or rental income. Featuring a convenient location just minutes from downtown and major highways, it offers easy access for commuting, shopping, and dining. With the right vision, this home can truly shine again. Buyer to verify all information. Owner is an Oklahoma real estate broker #161124.
Key facts
- 3,350 sq ft lot
- Built 1961
- Listed 56 days
Property features AI
Finance
- Other: Homestead not indicated; Listed as active; Living area reported as 800 (source: assessor); Directions: From NE 30th and Martin Luther King go west. Home sits on the corner
- Financial info: Not assumable
- HOA & community: No mandatory association dues
Exterior
- Home design: Single family residence; One story; Residential property; Located in Ethels Park Place addition; Existing property
- Construction: Frame construction; Shingle roof; Combination foundation; Built (existing structure)
- Exterior features: Corner lot; No additional exterior features listed
Interior
- Bedrooms: 3 bedrooms
- Bathrooms: 1 full bathroom
- Interior features: One living area; No fireplace
Neighborhood map
What this means for you Summary
Snapshot
- This is a 3-bed/1.0-bath single-family listed at $50k.
Deal economics
- At list price, monthly cash flow is $587 ($7k/yr) — positive.
- The deal already cash-flows at list — no discount required.
- Meets the 1% rule at list price ($1k rent vs $50k).
- Recommended offer: $48k (3.0% below list) — sets the bar for market timing.
- Cap rate 20.4% vs local median 3.7% in Oklahoma City — top-decile yield for the area; either an underpriced asset or a hidden risk that comps aren't pricing in. Stress-test before assuming the spread holds.
Location & tenants
- Location reads 80/100 on livability (#3 in OK, #1,635 nationally) — a professional / high-income tenant draw. Strengths: amenities A+, commute A+, cost of living A+; Watch: crime F.
- Oklahoma City (urban): math 7% / reading 10% proficiency, ranked #254 of 270 in OK (top 94%) — low school quality limits family demand, transient renter base, plan for 1-2y turnover; 82% free/reduced lunch — lower-income household profile, screen leases tightly.
- Zoned schools: Thelma R. Parks Es (math 2% / reading 2%, grade F, #802 of 845 statewide, top 100%, 472 students, 0% FRL); Douglass Hs (math 2% / reading 2%, grade F, #445 of 447 statewide, top 100%, 556 students, 0% FRL) — zoned schools average 0% FRL vs 82% district-wide (82 pts lower); this property's tenant base skews higher-income than the district average.
- Market conditions: Rents rising (+2.1%/yr); 81 active listings in the ZIP; 40 comparable units currently listed for rent nearby; rentals at typical pace (median 24d on market — plan ~3-4 weeks tenant-placement turnaround); 48% of comp listings sitting > 30 days — soft ceiling on asking rent; lower-income renter base — watch delinquency; 5,365 units permitted in Oklahoma County in 2024 (569 in 5+ unit buildings).
- This rent runs 34% of the median local income ($40k/yr) — at the standard rent-burdened threshold; future hikes will face affordability resistance.
Forward outlook
- Local home prices are declining (-3.0%/yr); year-one equity from $346 of loan paydown is wiped out by about $2k of value loss. Plan a longer hold.
- Oklahoma County population projected at +41% by 2050 — long-run rental-demand tailwind backs the buy-and-hold thesis.
- At projected returns (-3.0% appreciation + 2.1% rent growth), your $14k cash investment doubles in ~3 years — after that, you're playing with house money.
Negotiation context
- It's been on market 56 days — a 3% lower offer ($48k) is reasonable based on typical stale-listing flexibility.
- 4 sale attempts since 2y ago with the ask held roughly flat each time — persistent listings suggest the price (not the market) is what's stuck; bring a comps-based counter.
- Current owner paid $15k; list at $50k implies a 233% gain — meaningful room to come down on a strong offer.
Risks & watch-outs
- Climate carrying-cost: extreme-heat days projected 7→19/yr by 2055 (HVAC capex compounding) — expect insurance premiums to compound above CPI over the hold.
Questions for the listing agent
- It's been on market 56 days. Have you received any prior offers? Is the seller open to a 3% concession, seller financing, or rate buy-down credit?
- Built in 1961 — when were the roof, HVAC, electrical panel, plumbing, and water heater last replaced?
- Is there a deadline driving the sale (1031 exchange, divorce, estate, relocation)? That informs how much negotiation room exists.
- Schools are F-rated, which usually means shorter tenancies and higher turnover. Who's the typical renter profile here, and what's been the actual vacancy rate?
- Crime grade is F in this area — have there been break-ins, vandalism, or insurance claims at this property in the last 3 years? What carrier currently insures it and at what premium?
- What's the average days-on-market for RENTAL listings here right now (not sales)? A rising rental-DOM trend means longer vacancies and softer asking-rent achievability than the comps imply.
- What's the recent tenant-quality profile in this submarket — average credit score on applications, eviction rate, late-payment / NSF rate, and stable-employment percentage? A property-management company in the area should have these aggregated.
- How much new for-sale + rental construction is in the pipeline within 1–3 miles? Heavy new supply typically softens prices + rents 12–24 months out; constrained supply supports both.
Investment metrics
- 1% rule
- 2.31% ✓
- Cap rate
- 20.39%
- Cash-on-cash
- 50.34%
- DSCR
- 3.24
- GRM
- 3.6
CMA / ARV
- ARV (median comp)
- $95,832
- List price
- $50,000
- Delta
- -47.83%
- Verdict
- UNDERPRICED
- Comps
- 20 within 1.0 mi
Show comp detail 7 sales within ~0.75 mi
| Address | Dist | Beds/Ba | Sqft | Sold | Price | $/sf | Match |
|---|---|---|---|---|---|---|---|
| 1714 NE 34th St | 0.42mi | 2/1.0 (-1) | 836 (+4%) | 6mo | $40,000 | $48 | 63 |
| 1437 NE 34th St | 0.34mi | 2/1.0 (-1) | 749 (-6%) | 7mo | $94,500 | $126 | 62 |
| 1016 NE 27th St | 0.50mi | 2/1.0 (-1) | 760 (-5%) | 17mo | $36,500 | $48 | 49 |
| 2145 N Bath Ave | 0.62mi | 2/1.0 (-1) | 720 (-10%) | 3mo | $114,250 | $159 | 47 |
| 2140 N Lottie Ave | 0.68mi | 3/1.0 | 864 (+8%) | 13mo | $80,000 | $93 | 45 |
| 1414 NE 26th St | 0.27mi | 2/1.0 (-1) | 683 (-15%) | 17mo | $27,500 | $40 | 44 |
| 929 NE 32nd St | 0.60mi | 2/1.0 (-1) | 915 (+14%) | 2mo | $50,000 | $55 | 41 |
Match score weights: distance 35% · size 25% · config 20% · recency 20%. Top-matched comps best support the ARV.
Projected returns pro-forma
-3.0% appreciation · 2.13% rent growth · sell at horizon
- IRR
- 47.1%
- Equity multiple
- 3.02×
- Total profit
- $28,305
- Equity at exit
- $7,455
- IRR
- 52.4%
- Equity multiple
- 5.91×
- Total profit
- $68,792
- Equity at exit
- $4,323
Cash invested: $14,000 (down + closing). Projections, not guarantees.
Landlord ↔ Tenant lean methodology
- Overall (STATE)
- 83 Strongly Landlord-Friendly
- State Oklahoma
- 83 Strongly Landlord-Friendly · R+20
- County
- — inherits STATE
- City
- — inherits STATE
ZIP-level market 73111
- Home prices YoY
- -13.6%
- Rents YoY
- 2.1%
- Active inventory
- 81
- Price-to-rent
- 3.6×
Monthly cashflow live
- Estimated rent
- $1,153 high interval (Pro) →
- Mortgage (P&I)
- −$262
- Tax from tax record
- −$40 /mo · $485/yr
- Insurance
- −$21
- HOA
- −$0
- Vacancy / Maint / Mgmt
- −$242
- Net cashflow
- $587
Break-even live
UW: 25.0% down · 7.5% · 30yr · 1.5% tax · 5.0% vac · 8.0% maint · 8.0% mgmt
Financing live
Cash to close
- Down payment
- $12,500
- Closing costs
- $1,500
- Reserves months
- —
- Total cash needed
- —
Loan-product check · same deal, 3 products live
Conventional
25% down · 7.5% · 30yr
- Down + closing
- —
- Monthly P&I
- —
- Monthly cashflow
- —
- DSCR
- —
- Eligible?
- —
Personal DTI + credit; lowest rate.
DSCR
20% down · 8.5% · 30yr
- Down + closing
- —
- Monthly P&I
- —
- Monthly cashflow
- —
- DSCR
- —
- Eligible?
- —
No personal income docs; deal must DSCR.
Hard money
10% down · 12.0% · 12mo
- Down + closing
- —
- Monthly P&I
- —
- Monthly cashflow
- —
- DSCR
- —
- Eligible?
- —
Short-term bridge; refi at stabilization.
Rent comps 40 comps
| Address | Beds | Baths | Sqft | Rent | $/sqft | DOM | Units | Dist |
|---|---|---|---|---|---|---|---|---|
| 1438 NE 27th St Oklahoma City, OK | 3.0 | 1.0 | 736 | $1,000 | $1.36 | 43d | 1 | 0.19mi |
| 2709 N Fonshill Ave Oklahoma City, OK | 2.0 | 1.0 | 949 | $1,100 | $1.16 | 23d | 1 | 0.21mi |
| 1637 Bishop Bobby L Williams Dr Oklahoma City, OK | 2.0 | 1.0 | 820 | $1,150 | $1.40 | 43d | 1 | 0.21mi |
| 1712 NE 25th St Oklahoma City, OK | 4.0 | 1.0 | 1100 | $1,550 | $1.41 | 43d | 1 | 0.35mi |
| 1439 NE 24th St Oklahoma City, OK | 3.0 | 1.0 | 874 | $1,025 | $1.17 | 16d | 1 | 0.41mi |
| 1701 NE 34th St Oklahoma City, OK | 2.0 | 1.5 | 900 | $1,000 | $1.11 | 43d | 1 | 0.42mi |
| 1812 NE 24th St Oklahoma City, OK | 3.0 | 1.0 | 1071 | $1,175 | $1.10 | 2d | 1 | 0.44mi |
| 1904 NE 25th St Oklahoma City, OK | 2.0 | 1.0 | 939 | $950 | $1.01 | 4d | 1 | 0.47mi |
| 1921 NE 25th St Unit 3 Oklahoma City, OK | 2.0 | 1.0 | 900 | $875 | $0.97 | 20d | 1 | 0.48mi |
| 1931 NE 25th St Unit 10 Oklahoma City, OK | 2.0 | 1.0 | 900 | $875 | $0.97 | 23d | 1 | 0.51mi |
| 2020 NE 30th St Oklahoma City, OK | 3.0 | 1.0 | 1056 | $1,150 | $1.09 | 43d | 1 | 0.53mi |
| 1401 NE 22nd St Oklahoma City, OK | 2.0 | 1.0 | 728 | $1,100 | $1.51 | 23d | 1 | 0.54mi |
| 2312 N Everest Ave Oklahoma City, OK | 3.0 | 1.0 | 1100 | $1,299 | $1.18 | 43d | 1 | 0.59mi |
| 2225 Glen Ellyn St Oklahoma City, OK | 2.0 | 1.0 | 1095 | $925 | $0.84 | 43d | 1 | 0.66mi |
| 2148 N Stonewall Ave Oklahoma City, OK | 2.0 | 1.0 | 1055 | $875 | $0.83 | 4d | 1 | 0.74mi |
| 1722 NE 20th St Oklahoma City, OK | 2.0 | 1.0 | 800 | $1,070 | $1.34 | 43d | 1 | 0.76mi |
| 2128 N Stonewall Ave Unit 1 Oklahoma City, OK | 2.0 | 1.0 | 960 | $800 | $0.83 | 3d | 1 | 0.77mi |
| 846 Marilyn St Oklahoma City, OK | 3.0 | 1.0 | 1000 | $1,049 | $1.05 | 43d | 1 | 0.80mi |
| 2300 Granada Blvd Oklahoma City, OK | 3.0 | 1.0 | 999 | $1,000 | $1.00 | 11d | 1 | 0.80mi |
| 1727 NE 19th St Oklahoma City, OK | 3.0 | 1.0 | 892 | $995 | $1.12 | 43d | 1 | 0.80mi |
| 2112 NE 23rd St Oklahoma City, OK | 3.0 | 1.0 | 1117 | $1,070 | $0.96 | 17d | 1 | 0.81mi |
| 736 NE 26th St Oklahoma City, OK | 2.0 | 1.0 | 927 | $1,050 | $1.13 | 2d | 1 | 0.84mi |
| 1609 NE 18th St Oklahoma City, OK | 2.0 | 1.0 | 899 | $900 | $1.00 | 4d | 1 | 0.84mi |
| 714 NE 27th St Unit 4 Oklahoma City, OK | 2.0 | 1.0 | 950 | $845 | $0.89 | 23d | 1 | 0.86mi |
| 2107 Hardin Dr Oklahoma City, OK | 3.0 | 1.0 | 999 | $875 | $0.88 | 43d | 1 | 0.89mi |
| 704 NE 31st St Oklahoma City, OK | 3.0 | 1.0 | 952 | $1,300 | $1.37 | 43d | 1 | 0.89mi |
| 1801 N Jordan Ave Oklahoma City, OK | 2.0 | 1.0 | 1080 | $1,000 | $0.93 | 14d | 1 | 0.91mi |
| 1516 Park Cir Oklahoma City, OK | 3.0 | 1.0 | 1118 | $1,250 | $1.12 | 23d | 1 | 0.93mi |
| 1220 NE 17th St Oklahoma City, OK | 2.0 | 1.0 | 1100 | $1,195 | $1.09 | 43d | 1 | 0.96mi |
| 2200 Hardin Dr Oklahoma City, OK | 3.0 | 1.0 | 1091 | $1,025 | $0.94 | 43d | 1 | 0.97mi |
| 1200 NE 17th St Unit B Oklahoma City, OK | 2.0 | 1.0 | 1002 | $2,100 | $2.10 | 43d | 1 | 0.98mi |
| 2132 NE 19th St Oklahoma City, OK | 2.0 | 1.0 | 850 | $950 | $1.12 | 43d | 1 | 1.02mi |
| 1450 NE 16th Ter Oklahoma City, OK | 3.0 | 1.0 | 1096 | $1,295 | $1.18 | 43d | 1 | 1.02mi |
| 1216 NE 42nd St Oklahoma City, OK | 2.0 | 1.0 | 1009 | $1,125 | $1.11 | 43d | 1 | 1.07mi |
| 939 East Dr Oklahoma City, OK | 2.0 | 1.0 | 1039 | $1,100 | $1.06 | 23d | 1 | 1.09mi |
| 2132 Miramar Blvd Oklahoma City, OK | 2.0 | 1.0 | 768 | $800 | $1.04 | 2d | 1 | 1.11mi |
| 215 NE 28th St Oklahoma City, OK | 2.0 | 1.0–2.0 | 694 | $1,289 | $1.86 | 2d | 10 | 1.25mi |
| 2036 NE Grand Blvd Oklahoma City, OK | 2.0 | 1.0 | 1092 | $995 | $0.91 | 2d | 1 | 1.33mi |
| 1709 N Page Ave Oklahoma City, OK | 2.0 | 1.0 | 967 | $895 | $0.93 | 23d | 1 | 1.36mi |
| 2501 NE 16th St Oklahoma City, OK | 2.0 | 1.0 | 941 | $1,100 | $1.17 | 43d | 1 | 1.39mi |
Listing history 22 events
-
2026-06-18days on market $50,000 Active 56 DOM
-
2026-06-17days on market $50,000 Active 55 DOM
-
2026-06-16days on market $50,000 Active 54 DOM
-
2026-06-15days on market $50,000 Active 53 DOM
-
2026-06-13days on market $50,000 Active 51 DOM
-
2026-06-09days on market $50,000 Active 47 DOM
-
2026-06-08days on market $50,000 Active 46 DOM
-
2026-06-07days on market $50,000 Active 45 DOM
-
2026-06-05days on market $50,000 Active 42 DOM
-
2026-06-03days on market $50,000 Active 41 DOM
-
2026-06-02days on market $50,000 Active 40 DOM
-
2026-06-01days on market $50,000 Active 39 DOM
-
2026-05-31days on market $50,000 Active 38 DOM
-
2026-04-23$50,000 Active 508-char remark
-
2025-04-01status Active
-
2025-03-31historical
-
2025-01-30$75,000 Active
-
2024-06-01historical
-
2024-04-17price $85,000
-
2024-04-15price $50,000
-
2024-04-04$85,000 Active
-
1984-11-01soldstatus $15,000
ⓘ Source: listings_history table (triggers on properties + properties_extension) + one-shot
backfill from property_details.listing_events for pre-trigger history.
Tax reassessment forecast OK · Resets to sale price
- Current annual tax
- $485 · $40/mo
- Projected year-2 tax
- $485 · $40/mo
- Expected delta
- $0/yr ($0/mo · 0.0%)
ⓘ Screening estimate from a state-policy table — verify with the county assessor before closing.
Climate risk First Street
- Flood 1/10 Low FEMA zone X (unshaded) · 0% chance over 30 yrs
- Wildfire 1/10 Low
- Heat 6/10 Major 7 d/yr ≥107°F today · 19 d/yr by 30 yrs out
- Wind 2/10 Low 3% chance of damaging wind over 30 yrs
- Air quality 2/10 Low 1 unhealthy d/yr today · 2 by 30 yrs out
Nearby sold comps map
Loading sold comps map…
Walkable amenities ~0.75 mi
Loading nearby amenities…
Taxation est. · year 1
- Rental income
- $13,834
- − Mortgage interest
- −$2,801
- − Property taxes
- −$485
- − Insurance
- −$250
- − Repairs & maintenance
- −$1,107
- − Management
- −$1,107
- − Depreciation
- −$1,455
- Taxable income
- $6,630
- Est. tax owed @ 24.0%
- −$1,591
- After-tax cash flow
- $5,456/yr
For passive investors: Depreciation is non-cash, so a rental often shows a tax loss while cash-flowing — sheltering income. Rental losses are passive: they offset passive income freely, and up to $25,000/yr can offset ordinary (W-2) income if you actively participate and your MAGI is under $100k (phasing out to $0 by $150k); unused losses carry forward. On sale, claimed depreciation is recaptured at up to 25%, and gains may owe capital-gains tax (a 1031 exchange can defer both). Figures are a year-1 estimate at your 24.0% rate — not tax advice; consult a CPA.
Schools (NCES district)
- District
- Oklahoma City
- NCES district ID
- 4022770
- Math proficiency
- 7% ▼ -5.00%
- Reading proficiency
- 10% ▼ -6.00%
- Median HH income
- $35,606
- Composite
- 7.0/100
- National rank
- #9970
- State rank
- #254 of 270 in OK
Livability — Oklahoma City
- Score
- 80/100
- State rank
- #3
- US rank
- #1635
Category grades
Schools grade is shown separately in the Schools card above.
Census & demographics
- Census place
- Oklahoma City, OK
- County
- Oklahoma County · 771,644 people
- City population
- 498,656
- Metro
- Oklahoma City, OK
- Population (ZIP)
- 10,727
- Household income
- $40,340
- Rent vs Own
- Severe rent burden
- 804.0
Population outlook (Oklahoma County) Hauer SSP2
- Today (2025)
- 911,875 people
- By 2030
- 982,413 · +7.7%
- By 2040
- 1,130,468 · +24.0%
- By 2050
- 1,288,422 · +41.3%
- By 2075
- 1,711,482 · +87.7%
- By 2100
- 2,088,448 · +129.0%
Race, ethnicity, and origin ACS 2023
- Neighborhood character
- Predominantly Black (76%)
- Race & ethnicity
- Black 76% White 13% Two or more races 7% Hispanic / Latino 6% Native American 2%
- Hispanic origin (detail)
- Mexican 4%
- Foreign-born
- 2% · Canada
- Languages at home
- 94% English-only · Spanish 6%
Political lean MEDSL · Oklahoma
- 2024 margin
- Toss-up / Even · D 48.0% · R 49.7% · Other 2.3%
- 2008→2024 swing
- +15.1pp toward D · 2008: -16.8pp · 2024: -1.7pp
- All cycles
- 2024: R+1.7 2020: R+1.1 2016: R+10.5 2012: R+16.7 2008: R+16.8
Not yet ingested
- Civics
- —
Market trends
- HPI YoY
- ▼ -34.64%
- Current HPI
- 220.6395
- Rent YoY
- ▲ 2.13%
- Metro
- Oklahoma City, OK
- State GDP YoY
- ▲ 1.55%
- F500 in state
- 6
Industry mix (Fortune 500 HQ in OK)
| Industry | F500 HQs | Revenue |
|---|---|---|
| Energy | 3 | $48B |
|
||
Price history
+233.3% since first listed9 events — show timeline
- 2026-04-23 Listed $50,000 MLSOK
- 2025-04-01 Relisted — MLSOK
- 2025-03-31 Listing Removed — MLSOK
- 2025-01-30 Listed $75,000 MLSOK
- 2024-06-01 Listing Removed — MLSOK
- 2024-04-17 Price Changed $85,000 MLSOK
- 2024-04-15 Price Changed $50,000 MLSOK
- 2024-04-04 Listed $85,000 MLSOK
- 1984-11-01 Sold (Public Records) $15,000 Public Records
Property tax history
+12.3%/yrLatest (2025): $485 · +4.2% YoY. Source: county tax records.
Cash-flow waterfall
monthlySold comps — $/sqft
last 12 mo · ≤1 miLoading sold comps…