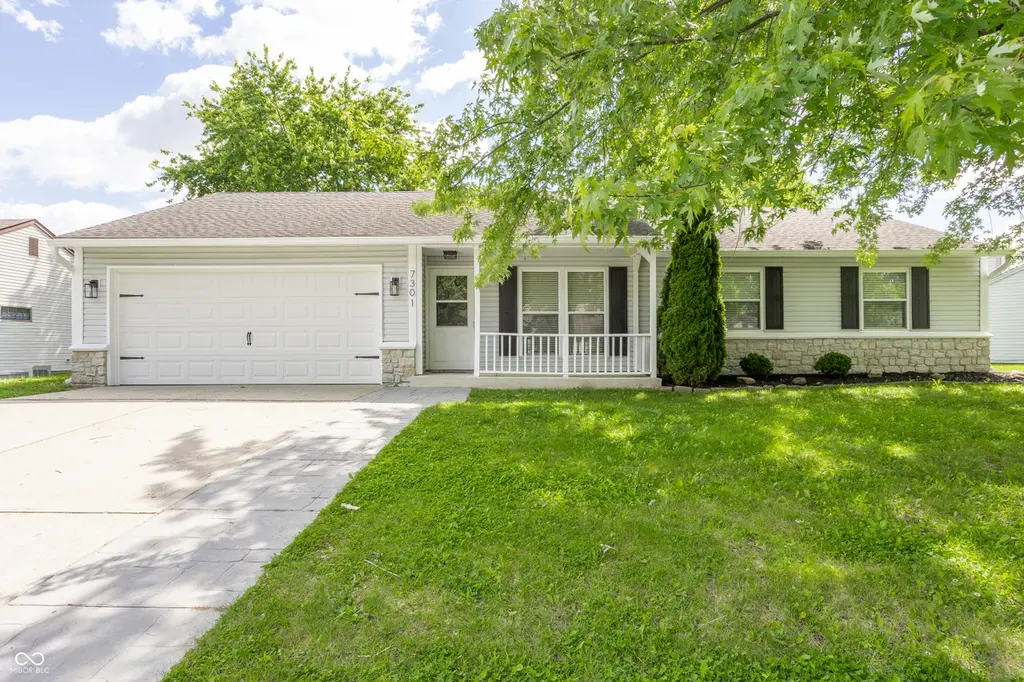
7301 Muirfield Pl · Indianapolis city (balance), IN
Flood risk 1/10 · Minimal
- FEMA flood zone
- X (unshaded)
- Chance of flooding over 30 yrs
- 0.0%
- Est. flood insurance / yr
- $507 – $1,088
Fire risk 1/10 · Minimal
- Est. fire insurance / yr
- $717 – $1,331
Heat risk 3/10 · Minor
- Hot days now (above 102°F)
- 7 days/yr
- Hot days in 30 yrs
- 19 days/yr
Wind risk 2/10 · Minimal
- Chance of severe wind over 30 yrs
- 1.0%
Air-quality risk 3/10 · Minor
- Unhealthy air days now
- 2 days/yr
- Unhealthy air days in 30 yrs
- 3 days/yr
Risk factors via First Street. Map © Google.
Why this score? — see what drove the D- grade
The composite is a weighted blend of 9 inputs, each scored 0–100. Each bar is that input's sub-score; the figure is the points it added to the 100-point composite (weight × sub-score).
- Cash flow +13.0/30.0
- Schools +4.0/10.0
- DSCR +3.9/10.0
- Rent growth +3.4/5.0
- 1% rule +2.9/10.0
- ARV discount +2.8/15.0
- Livability +2.5/5.0
- Condition / age +2.5/5.0
- Appreciation +0.0/10.0
$289,900
🖨 Deal sheet 📄 Offer letter ✓ Due diligence
Listing remarks MLS
Fantastic ranch home in Franklin township! Great curb appeal with nicely landscaped front yard and covered porch that welcomes you right in. Spacious open floor plan concept with 3 bedrooms, 2 full baths, large great room, wood burning fireplace and cathedral ceilings. Open concept kitchen & family room is great for entertaining. Enjoy the peaceful back yard with large stamped concrete patio & mini barn for additional storage. Attached 2 car garage with brand new garage door. Don’t miss this opportunity!
Key facts
- New tile flooring
- Remodeled kitchen
- Luxurious ensuite
Tags
Property features AI
Exterior
- Parking: Attached 2-car garage; Finished garage with garage door opener and service door; Concrete driveway
- Security: Smoke alarm(s); Smoke detector(s)
- Utilities: Public water; Municipal sewer connected; Electricity connected; Natural gas connected; Sewer connected; Water connected; Solid waste service available
- Home design: Single-family residence; One story; Updated/remodeled condition
- Construction: Stone and vinyl siding exterior; Slab foundation
- Exterior features: Covered patio; Patio; Storage shed; Cul-de-sac lot; Sidewalks; Mature trees; Less than 1/4 acre lot
Interior
- Kitchen: Dishwasher; Garbage disposal; Microwave; Gas oven; Refrigerator; Eat-in kitchen with pantry
- Bedrooms: 3 bedrooms on the main level; Primary bedroom with walk-in closet
- Bathrooms: 2 full bathrooms on the main level; Primary bath with full shower stall, double sinks, and suite layout
- Heating & cooling: Forced air heating (natural gas); Central air conditioning
- Interior features: Vaulted ceilings; Eat-in kitchen; Pantry; Attic access; Smart thermostat; Living room (formal); Utility room
- Laundry & utility: Washer and dryer included; Main-level laundry; Gas water heater; Utility room
Neighborhood map
What this means for you Summary
Snapshot
- This is a 3-bed/1.0-bath single-family listed at $290k.
Deal economics
- At list price, monthly cash flow is $-15 ($-185/yr) — negative.
- To cash-flow at today's rent, offer at most $287k (0.9% below list).
- To meet the 1% rule (rent ≥ 1% of price), the offer needs to be $230k (20.7% below list).
- Recommended offer: $230k (20.7% below list) — sets the bar for 1% rule.
- Cap rate 6.2% vs local median 4.4% in Indianapolis city (balance) — top-decile yield for the area; either an underpriced asset or a hidden risk that comps aren't pricing in. Stress-test before assuming the spread holds.
Location & tenants
- Location reads: area grade D — affects rentability + tenant quality, not the cash-flow math above.
- Franklin Township Community School Corporation (urban): math 42% / reading 47% proficiency, ranked #87 of 301 in IN (top 29%) — families likely to look elsewhere, expect single-tenant / working-renter base with shorter leases.
- Market conditions: Rents rising (+3.8%/yr); 261 active listings in the ZIP; 8 comparable units currently listed for rent nearby; rentals leasing fast (median 4d on market — plan ~1-2 weeks tenant-placement turnaround); solid renter incomes; 1,906 units permitted in Marion County in 2024 (621 in 5+ unit buildings).
- This rent runs 35% of the median local income ($79k/yr) — at the standard rent-burdened threshold; future hikes will face affordability resistance.
Forward outlook
- Local home prices are declining (-3.0%/yr); year-one equity from $2k of loan paydown is wiped out by about $9k of value loss. Plan a longer hold.
- Marion County population projected at +18% by 2050 — long-run rental-demand tailwind backs the buy-and-hold thesis.
Negotiation context
- Only 10 days on market — expect competitive offers; lowballing is unlikely to land.
- 2 sale attempts since 7y ago with the ask held roughly flat each time — persistent listings suggest the price (not the market) is what's stuck; bring a comps-based counter.
- Current owner paid $159k; list at $290k implies a 82% gain — meaningful room to come down on a strong offer.
Questions for the listing agent
- What do current leases actually rent for vs. the listed asking? Can we see a recent rent roll and the last 12 months of T-12 income?
- Is there a deadline driving the sale (1031 exchange, divorce, estate, relocation)? That informs how much negotiation room exists.
- The area grade is low — what's the realistic commute time and amenity access for the typical tenant pool here? Any planned neighborhood developments (good or bad) we should know about?
- What's the average days-on-market for RENTAL listings here right now (not sales)? A rising rental-DOM trend means longer vacancies and softer asking-rent achievability than the comps imply.
- What's the recent tenant-quality profile in this submarket — average credit score on applications, eviction rate, late-payment / NSF rate, and stable-employment percentage? A property-management company in the area should have these aggregated.
- How much new for-sale + rental construction is in the pipeline within 1–3 miles? Heavy new supply typically softens prices + rents 12–24 months out; constrained supply supports both.
Investment metrics
- 1% rule
- 0.79% ✗
- Cap rate
- 6.23%
- Cash-on-cash
- -0.23%
- DSCR
- 0.99
- GRM
- 10.5
CMA / ARV
- ARV (on-the-fly)
- $262,700
- Comps found
- 12
Show comp detail 12 sales within ~0.75 mi
| Address | Dist | Beds/Ba | Sqft | Sold | Price | $/sf | Match |
|---|---|---|---|---|---|---|---|
| 7301 Muirfield Pl | 0.00mi | 3/2.0 | 1,420 (0%) | 0mo | $280,500 | $198 | 96 |
| 7528 Gunyon Dr | 0.29mi | 3/2.0 | 1,408 (-1%) | 0mo | $265,000 | $188 | 81 |
| 6324 Muirfield Way | 0.39mi | 3/2.0 | 1,499 (+6%) | 2mo | $260,000 | $173 | 67 |
| 7518 Chris Anne Dr | 0.18mi | 3/2.0 | 1,244 (-12%) | 1mo | $257,550 | $207 | 66 |
| 5914 Edelle Dr | 0.54mi | 3/2.0 | 1,392 (-2%) | 2mo | $265,000 | $190 | 66 |
| 7509 Gunyon Ct | 0.33mi | 3/2.5 | 1,520 (+7%) | 4mo | $280,000 | $184 | 63 |
| 7640 Gordon Way | 0.72mi | 3/2.0 | 1,440 (+1%) | 4mo | $266,500 | $185 | 57 |
| 6032 Rockdell Dr | 0.69mi | 2/2.0 (-1) | 1,492 (+5%) | 1mo | $250,000 | $168 | 50 |
| 7050 Sycamore Run Dr | 0.71mi | 3/2.0 | 1,520 (+7%) | 4mo | $285,000 | $188 | 48 |
| 6820 Troon Way | 0.69mi | 3/2.0 | 1,297 (-9%) | 2mo | $235,000 | $181 | 47 |
| 7545 Turnberry Ct | 0.70mi | 3/2.0 | 1,584 (+12%) | 1mo | $285,000 | $180 | 43 |
| 7525 Turnberry Ct | 0.69mi | 3/2.5 | 1,614 (+14%) | 0mo | $247,000 | $153 | 39 |
Match score weights: distance 35% · size 25% · config 20% · recency 20%. Top-matched comps best support the ARV.
Projected returns pro-forma
-3.0% appreciation · 3.78% rent growth · sell at horizon
- IRR
- -15.9%
- Equity multiple
- 0.43×
- Total profit
- $-46,212
- Equity at exit
- $43,225
- IRR
- -6.4%
- Equity multiple
- 0.58×
- Total profit
- $-34,211
- Equity at exit
- $25,065
Cash invested: $81,172 (down + closing). Projections, not guarantees.
Landlord ↔ Tenant lean methodology
- Overall (STATE)
- 90 Strongly Landlord-Friendly
- State Indiana
- 90 Strongly Landlord-Friendly · R+11
- County
- — inherits STATE
- City
- — inherits STATE
ZIP-level market 46237
- Rents YoY
- 3.8%
- Active inventory
- 261
- Price-to-rent
- 10.5×
Monthly cashflow live
- Estimated rent
- $2,300 high interval (Pro) →
- Mortgage (P&I)
- −$1,520
- Tax from tax record
- −$191 /mo · $2,294/yr
- Insurance
- −$121
- HOA
- −$0
- Vacancy / Maint / Mgmt
- −$483
- Net cashflow
- $-15
Break-even live
UW: 25.0% down · 7.5% · 30yr · 1.5% tax · 5.0% vac · 8.0% maint · 8.0% mgmt
Financing live
Cash to close
- Down payment
- $72,475
- Closing costs
- $8,697
- Reserves months
- —
- Total cash needed
- —
Loan-product check · same deal, 3 products live
Conventional
25% down · 7.5% · 30yr
- Down + closing
- —
- Monthly P&I
- —
- Monthly cashflow
- —
- DSCR
- —
- Eligible?
- —
Personal DTI + credit; lowest rate.
DSCR
20% down · 8.5% · 30yr
- Down + closing
- —
- Monthly P&I
- —
- Monthly cashflow
- —
- DSCR
- —
- Eligible?
- —
No personal income docs; deal must DSCR.
Hard money
10% down · 12.0% · 12mo
- Down + closing
- —
- Monthly P&I
- —
- Monthly cashflow
- —
- DSCR
- —
- Eligible?
- —
Short-term bridge; refi at stabilization.
Rent comps 8 comps
| Address | Beds | Baths | Sqft | Rent | $/sqft | DOM | Units | Dist |
|---|---|---|---|---|---|---|---|---|
| 6210 Carrie Cir Indianapolis, IN | 3.0 | 2.0 | 1226 | $1,890 | $1.54 | 4d | 1 | 0.04mi |
| 7703 Janel Ct Indianapolis, IN | 4.0 | 2.5 | 1824 | $4,950 | $2.71 | 23d | 1 | 0.29mi |
| 7825 Jaclyn Dr Indianapolis, IN | 3.0 | 2.0 | 1244 | $1,875 | $1.51 | 4d | 1 | 0.48mi |
| 6404 Amarillo Way Indianapolis, IN | 3.0 | 2.0 | 1494 | $1,845 | $1.23 | 4d | 1 | 0.70mi |
| 7925 Carlington Rd Indianapolis, IN | 2.0 | 2.0 | 1455 | $2,079 | $1.43 | 1d | 17 | 0.80mi |
| 8107 Southern Trails Pl Indianapolis, IN | 4.0 | 2.0 | 1746 | $2,000 | $1.15 | 4d | 1 | 0.80mi |
| 7251 Windsor Lakes Dr Indianapolis, IN | 1.0–3.0 | 1.0–2.0 | 1103 | $1,800 | $1.63 | 1d | 36 | 0.84mi |
| 5945 Arlo Dr Indianapolis, IN | 1.0–3.0 | 1.0–2.0 | 1092 | $2,020 | $1.85 | 1d | 12 | 1.30mi |
Listing history 6 events
-
2026-05-24status Pending
-
2026-05-14$289,900 Active
-
2019-12-30soldstatus $159,000 Sold 523-char remark
Show marketing remark (523 chars)
Fantastic ranch home in Franklin township! Great curb appeal with nicely landscaped front yard and covered porch that welcomes you right in. Spacious open floor plan concept with 3 bedrooms, 2 full baths, large great room, wood burning fireplace and cathedral ceilings. Open concept kitchen & family room is great for entertaining. Enjoy the peaceful back yard with large stamped concrete patio & mini barn for additional storage. Attached 2 car garage with brand new garage door. Don’t miss this opportunity!
-
2019-11-27status Pending 523-char remark
Show marketing remark (523 chars)
Fantastic ranch home in Franklin township! Great curb appeal with nicely landscaped front yard and covered porch that welcomes you right in. Spacious open floor plan concept with 3 bedrooms, 2 full baths, large great room, wood burning fireplace and cathedral ceilings. Open concept kitchen & family room is great for entertaining. Enjoy the peaceful back yard with large stamped concrete patio & mini barn for additional storage. Attached 2 car garage with brand new garage door. Don’t miss this opportunity!
-
2019-11-24price $159,900 523-char remark
Show marketing remark (523 chars)
Fantastic ranch home in Franklin township! Great curb appeal with nicely landscaped front yard and covered porch that welcomes you right in. Spacious open floor plan concept with 3 bedrooms, 2 full baths, large great room, wood burning fireplace and cathedral ceilings. Open concept kitchen & family room is great for entertaining. Enjoy the peaceful back yard with large stamped concrete patio & mini barn for additional storage. Attached 2 car garage with brand new garage door. Don’t miss this opportunity!
-
2019-11-14$165,000 Active 523-char remark
Show marketing remark (523 chars)
Fantastic ranch home in Franklin township! Great curb appeal with nicely landscaped front yard and covered porch that welcomes you right in. Spacious open floor plan concept with 3 bedrooms, 2 full baths, large great room, wood burning fireplace and cathedral ceilings. Open concept kitchen & family room is great for entertaining. Enjoy the peaceful back yard with large stamped concrete patio & mini barn for additional storage. Attached 2 car garage with brand new garage door. Don’t miss this opportunity!
ⓘ Source: listings_history table (triggers on properties + properties_extension) + one-shot
backfill from property_details.listing_events for pre-trigger history.
Tax reassessment forecast IN · Partial reset (capped growth)
- Current annual tax
- $2,294 · $191/mo
- Projected year-2 tax
- $2,379 · $198/mo
- Expected delta
- +$85/yr (+$7/mo · 3.7%)
ⓘ Screening estimate from a state-policy table — verify with the county assessor before closing.
Climate risk First Street
- Flood 1/10 Low FEMA zone X (unshaded) · 0% chance over 30 yrs
- Wildfire 1/10 Low
- Heat 3/10 Moderate 7 d/yr ≥102°F today · 19 d/yr by 30 yrs out
- Wind 2/10 Low 100% chance of damaging wind over 30 yrs
- Air quality 3/10 Moderate 2 unhealthy d/yr today · 3 by 30 yrs out
Nearby sold comps map
Loading sold comps map…
Walkable amenities ~0.75 mi
Loading nearby amenities…
Taxation est. · year 1
- Rental income
- $27,596
- − Mortgage interest
- −$16,239
- − Property taxes
- −$2,294
- − Insurance
- −$1,450
- − Repairs & maintenance
- −$2,208
- − Management
- −$2,208
- − Depreciation
- −$8,433
- Taxable loss
- −$5,235
- Est. tax savings @ 24.0%
- +$1,256
- After-tax cash flow
- $1,071/yr
For passive investors: Depreciation is non-cash, so a rental often shows a tax loss while cash-flowing — sheltering income. Rental losses are passive: they offset passive income freely, and up to $25,000/yr can offset ordinary (W-2) income if you actively participate and your MAGI is under $100k (phasing out to $0 by $150k); unused losses carry forward. On sale, claimed depreciation is recaptured at up to 25%, and gains may owe capital-gains tax (a 1031 exchange can defer both). Figures are a year-1 estimate at your 24.0% rate — not tax advice; consult a CPA.
Schools (NCES district)
- District
- Franklin Township Community School Corporation
- NCES district ID
- 1803750
- Math proficiency
- 42% ▼ -12.00%
- Reading proficiency
- 47% ▼ -6.00%
- Median HH income
- $67,825
- Composite
- 39.91/100
- National rank
- #3852
- State rank
- #87 of 301 in IN
Livability — Indianapolis city (balance)
No livability data for this city. (Only ~50 U.S. cities are tracked.)
Census & demographics
- Census place
- Indianapolis city (balance), IN
- County
- Marion County · 998,460 people
- City population
- 881,119
- Metro
- Indianapolis-Carmel-Anderson, IN
- Population (ZIP)
- 43,473
- Household income
- $79,078
- Rent vs Own
- Severe rent burden
- 1245.0
Population outlook (Marion County) Hauer SSP2
- Today (2025)
- 1,025,572 people
- By 2030
- 1,065,727 · +3.9%
- By 2040
- 1,141,577 · +11.3%
- By 2050
- 1,208,920 · +17.9%
- By 2075
- 1,367,288 · +33.3%
- By 2100
- 1,438,201 · +40.2%
Race, ethnicity, and origin ACS 2023
- Neighborhood character
- Predominantly White (71%)
- Race & ethnicity
- White 71% Asian 13% Hispanic / Latino 7% Two or more races 6% Black 5%
- Hispanic origin (detail)
- Mexican 6%
- Common ancestry
- Italian 2% Lithuanian 2% Romanian 2%
- Foreign-born
- 12% · Canada, Philippines
- Languages at home
- 84% English-only · Other Asian/Pacific 5% Spanish 5% Other Indo-European 4%
Political lean MEDSL · Marion
- 2024 margin
- Strong D (+27.7) · D 63.0% · R 35.3% · Other 1.7%
- 2008→2024 swing
- -0.7pp no change · 2008: 28.4pp · 2024: 27.7pp
- All cycles
- 2024: D+27.7 2020: D+29.1 2016: D+22.8 2012: D+22.2 2008: D+28.4
Not yet ingested
- Civics
- —
Market trends
- HPI YoY
- ▼ -180.33%
- Current HPI
- 238.9661
- Rent YoY
- ▲ 3.78%
- Metro
- Indianapolis-Carmel-Anderson, IN
- State GDP YoY
- ▲ 2.90%
- F500 in state
- 18
Industry mix (Fortune 500 HQ in IN)
| Industry | F500 HQs | Revenue |
|---|---|---|
| Industrial Machinery | 2 | $37B |
|
||
| Healthcare | 1 | $177B |
|
||
| Pharmaceuticals | 1 | $45B |
|
||
| Metals / Steel | 1 | $18B |
|
||
| Agriculture | 1 | $17B |
|
||
| Packaging | 1 | $12B |
|
||
Price history
+75.7% since first listed6 events — show timeline
- 2026-05-24 Pending — MIBOR as Distributed by MLS Grid
- 2026-05-14 Listed $289,900 MIBOR as Distributed by MLS Grid
- 2019-12-30 Sold (MLS) $159,000 MIBOR as Distributed by MLS Grid
- 2019-11-27 Pending — MIBOR as Distributed by MLS Grid
- 2019-11-24 Price Changed $159,900 MIBOR as Distributed by MLS Grid
- 2019-11-14 Listed $165,000 MIBOR as Distributed by MLS Grid
Property tax history
+6.6%/yrLatest (2025): $2,294 · -5.0% YoY. Source: county tax records.
Cash-flow waterfall
monthlySold comps — $/sqft
last 12 mo · ≤1 miLoading sold comps…