12404 St Highway C · Norwood, MO
Flood risk No data
- FEMA flood zone
- —
- Chance of flooding over 30 yrs
- —
- Est. flood insurance / yr
- —
Fire risk No data
- Est. fire insurance / yr
- —
Heat risk No data
- Hot days now (above threshold)
- —
- Hot days in 30 yrs
- —
Wind risk No data
- Chance of severe wind over 30 yrs
- —
Air-quality risk No data
- Unhealthy air days now
- —
- Unhealthy air days in 30 yrs
- —
Risk factors via First Street. Map © Google.
Why this score? — see what drove the C+ grade
The composite is a weighted blend of 9 inputs, each scored 0–100. Each bar is that input's sub-score; the figure is the points it added to the 100-point composite (weight × sub-score).
- Cash flow +23.9/30.0
- DSCR +7.7/10.0
- ARV discount +7.5/15.0
- 1% rule +6.2/10.0
- Appreciation +6.0/10.0
- Schools +3.2/10.0
- Livability +2.8/5.0
- Rent growth +2.5/5.0
- Condition / age +1.0/5.0
$79,995
🖨 Deal sheet 📄 Offer letter ✓ Due diligence
Listing remarks
Investor Special with Endless Potential! Opportunity knocks at 12404 State Highway C in Norwood, MO. This fixer-upper is perfect for investors, flippers, or buyers ready to roll up their sleeves and bring their vision to life. Nestled in a peaceful setting, this property offers the chance to create a beautiful permanent residence or a profitable investment project. With solid potential and room for customization, the possibilities are endless for someone with the skills and imagination to transform this home into something truly special. Don't miss your chance to unlock the value and make it your own!
Key facts
- 0.69 acre lot
- Built 1975
- Listed 37 days
Property features AI
Finance
- Other: Property type: Residential
- Financial info: Financial details not provided
- HOA & community: HOA information not provided
Exterior
- Parking: Parking details not provided
- Security: Security details not provided
- Utilities: Private water; Private sewer (septic tank)
- Home design: Single-family residence; One story
- Construction: Block foundation
- Exterior features: Level lot; Asphalt road frontage; Frontage on a highway
Interior
- Kitchen: Cooktop; Refrigerator
- Bedrooms: Bedrooms information not provided
- Flooring: Carpet
- Bathrooms: 1 full bathroom
- Heating & cooling: Propane heating; Wood heating; Other heating; Window unit cooling
- Interior features: Cooktop; Electric water heater; Refrigerator
- Laundry & utility: Washer; Dryer
Neighborhood map
What this means for you Summary
Snapshot
- This is a 3-bed/1.0-bath single-family listed at $80k. Condition is rated poor.
Deal economics
- At list price, monthly cash flow is $155 ($2k/yr) — positive.
- The deal already cash-flows at list — no discount required.
- Meets the 1% rule at list price ($895 rent vs $80k).
- Recommended offer: $78k (3.0% below list) — sets the bar for market timing.
Location & tenants
- Location reads 56/100 on livability (#703 in MO) — a working-class tenant base; expect higher turnover. Strengths: cost of living A+, housing A-; Watch: schools D+, crime F, amenities F.
- Skyline R-II (rural): math 30% / reading 40% proficiency, ranked #401 of 535 in MO (top 75%) — families likely to look elsewhere, expect single-tenant / working-renter base with shorter leases; 63% free/reduced lunch — lower-income household profile, screen leases tightly.
- Market conditions: 25 active listings in the ZIP; 21 units permitted in Douglas County in 2024 (10 in 5+ unit buildings).
Forward outlook
- In year one you build about $2k of equity ($553 loan paydown + $2k appreciation (1.9% local appreciation)).
- Douglas County population projected at -29% by 2050 — secular population decline; favor cash flow + early exit over multi-decade hold.
- At projected returns (1.9% appreciation + 3.0% rent growth), your $22k cash investment doubles in ~5 years — after that, you're playing with house money.
Negotiation context
- It's been on market 38 days — a 3% lower offer ($78k) is reasonable based on typical stale-listing flexibility.
Questions for the listing agent
- It's been on market 38 days. Have you received any prior offers? Is the seller open to a 3% concession, seller financing, or rate buy-down credit?
- Have any recent inspections been done? Can we get a copy of the seller's disclosures and any deferred-maintenance estimates?
- Built in 1975 — when were the roof, HVAC, electrical panel, plumbing, and water heater last replaced?
- Is there a deadline driving the sale (1031 exchange, divorce, estate, relocation)? That informs how much negotiation room exists.
- Schools are D-rated, which usually means shorter tenancies and higher turnover. Who's the typical renter profile here, and what's been the actual vacancy rate?
- Crime grade is F in this area — have there been break-ins, vandalism, or insurance claims at this property in the last 3 years? What carrier currently insures it and at what premium?
- What's the average days-on-market for RENTAL listings here right now (not sales)? A rising rental-DOM trend means longer vacancies and softer asking-rent achievability than the comps imply.
- What's the recent tenant-quality profile in this submarket — average credit score on applications, eviction rate, late-payment / NSF rate, and stable-employment percentage? A property-management company in the area should have these aggregated.
- How much new for-sale + rental construction is in the pipeline within 1–3 miles? Heavy new supply typically softens prices + rents 12–24 months out; constrained supply supports both.
Investment metrics
- 1% rule
- 1.12% ✓
- Cap rate
- 8.61%
- Cash-on-cash
- 8.28%
- DSCR
- 1.37
- GRM
- 7.4
CMA / ARV
No comps found within radius.
Projected returns pro-forma
1.92% appreciation · 3.0% rent growth · sell at horizon
- IRR
- 12.5%
- Equity multiple
- 1.67×
- Total profit
- $15,010
- Equity at exit
- $31,197
- IRR
- 15.3%
- Equity multiple
- 3.03×
- Total profit
- $45,503
- Equity at exit
- $44,652
Cash invested: $22,399 (down + closing). Projections, not guarantees.
Landlord ↔ Tenant lean methodology
- Overall (STATE)
- 81 Strongly Landlord-Friendly
- State Missouri
- 81 Strongly Landlord-Friendly · R+10
- County
- — inherits STATE
- City
- — inherits STATE
ZIP-level market 65717
- Home prices YoY
- 1.4%
- Active inventory
- 25
- Price-to-rent
- 7.4×
Monthly cashflow live
- Estimated rent
- $895 medium interval (Pro) →
- Mortgage (P&I)
- −$420
- Tax est. 1.5%
- −$100 /mo · $1,200/yr
- Insurance
- −$33
- HOA
- −$0
- Vacancy / Maint / Mgmt
- −$188
- Net cashflow
- $155
Break-even live
UW: 25.0% down · 7.5% · 30yr · 1.5% tax · 5.0% vac · 8.0% maint · 8.0% mgmt
Financing live
Cash to close
- Down payment
- $19,999
- Closing costs
- $2,400
- Reserves months
- —
- Total cash needed
- —
Loan-product check · same deal, 3 products live
Conventional
25% down · 7.5% · 30yr
- Down + closing
- —
- Monthly P&I
- —
- Monthly cashflow
- —
- DSCR
- —
- Eligible?
- —
Personal DTI + credit; lowest rate.
DSCR
20% down · 8.5% · 30yr
- Down + closing
- —
- Monthly P&I
- —
- Monthly cashflow
- —
- DSCR
- —
- Eligible?
- —
No personal income docs; deal must DSCR.
Hard money
10% down · 12.0% · 12mo
- Down + closing
- —
- Monthly P&I
- —
- Monthly cashflow
- —
- DSCR
- —
- Eligible?
- —
Short-term bridge; refi at stabilization.
Listing history 15 events
-
2026-06-18days on market $79,995 Active 38 DOM
-
2026-06-17days on market $79,995 Active 37 DOM
-
2026-06-16days on market $79,995 Active 36 DOM
-
2026-06-15days on market $79,995 Active 35 DOM
-
2026-06-13days on market $79,995 Active 33 DOM
-
2026-06-12days on market $79,995 Active 32 DOM
-
2026-06-09days on market $79,995 Active 29 DOM
-
2026-06-08days on market $79,995 Active 28 DOM
-
2026-06-07days on market $79,995 Active 27 DOM
-
2026-06-05days on market $79,995 Active 25 DOM
-
2026-06-04days on market $79,995 Active 23 DOM
-
2026-06-02days on market $79,995 Active 22 DOM
-
2026-06-01days on market $79,995 Active 21 DOM
-
2026-05-31days on market $79,995 Active 20 DOM
-
2026-05-11$79,995 Active
ⓘ Source: listings_history table (triggers on properties + properties_extension) + one-shot
backfill from property_details.listing_events for pre-trigger history.
Nearby sold comps map
Loading sold comps map…
Walkable amenities ~0.75 mi
Loading nearby amenities…
Taxation est. · year 1
- Rental income
- $10,746
- − Mortgage interest
- −$4,481
- − Property taxes
- −$1,200
- − Insurance
- −$400
- − Repairs & maintenance
- −$860
- − Management
- −$860
- − Depreciation
- −$2,327
- Taxable income
- $618
- Est. tax owed @ 24.0%
- −$148
- After-tax cash flow
- $1,707/yr
For passive investors: Depreciation is non-cash, so a rental often shows a tax loss while cash-flowing — sheltering income. Rental losses are passive: they offset passive income freely, and up to $25,000/yr can offset ordinary (W-2) income if you actively participate and your MAGI is under $100k (phasing out to $0 by $150k); unused losses carry forward. On sale, claimed depreciation is recaptured at up to 25%, and gains may owe capital-gains tax (a 1031 exchange can defer both). Figures are a year-1 estimate at your 24.0% rate — not tax advice; consult a CPA.
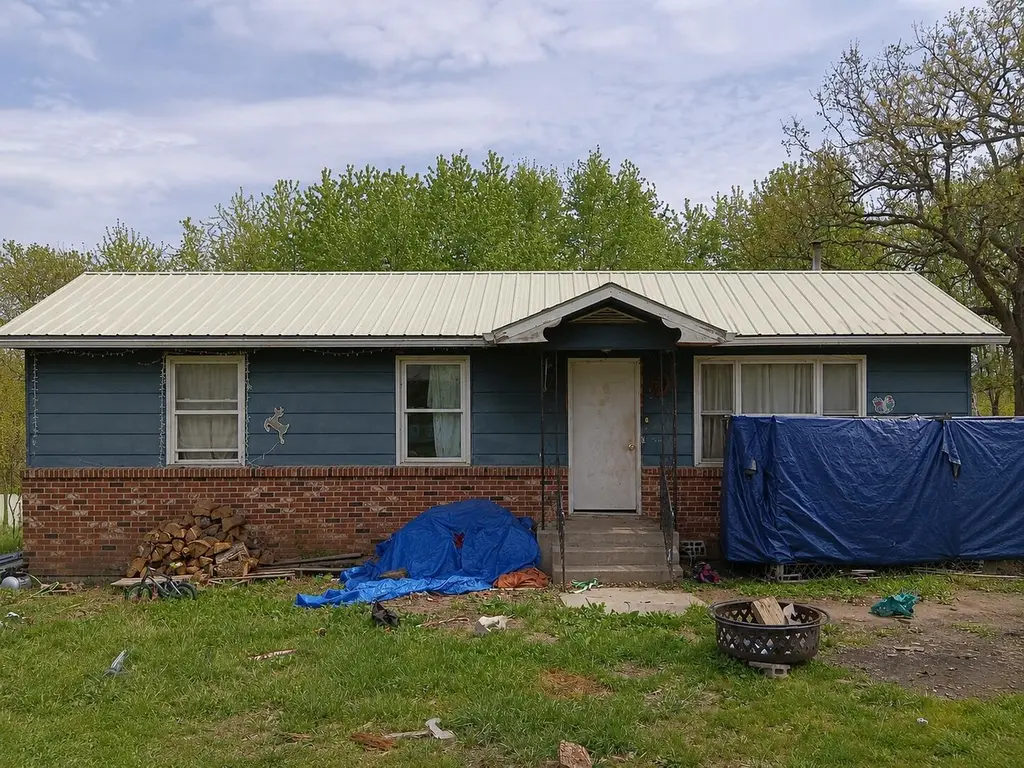
Condition & rehab AI · 4 photos
This fixer-upper requires extensive repairs and updates to its roof, exterior, and landscaping. Significant investment is needed to bring it up to a livable condition.
Repairs flagged
- Major roof — Significant rust and wear
- Major exterior siding — Severe peeling and damage
- Major exterior paint — Faded and peeling
Value-add opportunities
- Both landscaping and curb appeal — Improving the landscaping can enhance both resale and rental value
- Both exterior repairs and painting — Repairing the roof and repainting the exterior can significantly increase the home's value
- Both interior repairs and updates — Updating the interior can attract more buyers and renters
Renovation cost estimate screening
| Repair item | Severity | Est. cost |
|---|---|---|
| roof · Significant rust and wear | Major | $15,000–50,000 |
| exterior siding · Severe peeling and damage | Major | $15,000–50,000 |
| exterior paint · Faded and peeling | Major | $15,000–50,000 |
| Total estimated repair cost · 3 items | $45,000–150,000 |
Value-add ROI direction
- Both landscaping and curb appeal — Improving the landscaping can enhance both resale and rental value ↑
- Both exterior repairs and painting — Repairing the roof and repainting the exterior can significantly increase the home's value ↑
- Both interior repairs and updates — Updating the interior can attract more buyers and renters ↑
ⓘ Cost ranges are severity-bucket heuristics (US national rule-of-thumb). Get contractor quotes + a written scope before underwriting a rehab budget.
Schools (NCES district)
- District
- Skyline R-II
- NCES district ID
- 2911010
- Math proficiency
- 30% ▲ 10.00%
- Reading proficiency
- 40% ▲ 10.00%
- Median HH income
- $35,905
- Composite
- 31.62/100
- National rank
- #11133
- State rank
- #401 of 535 in MO
Livability — Norwood
- Score
- 56/100
- State rank
- #703
- US rank
- #22808
Category grades
Schools grade is shown separately in the Schools card above.
Census & demographics
- Population (ZIP)
- 2,777
Population outlook (Douglas County) Hauer SSP2
- Today (2025)
- 12,395 people
- By 2030
- 11,690 · -5.7%
- By 2040
- 10,185 · -17.8%
- By 2050
- 8,805 · -29.0%
- By 2075
- 6,716 · -45.8%
- By 2100
- 5,493 · -55.7%
Race, ethnicity, and origin ACS 2023
- Neighborhood character
- Predominantly White (93%)
- Race & ethnicity
- White 93% Two or more races 5%
- Common ancestry
- Serbian 1% Romanian 1% Lithuanian 1%
- Foreign-born
- 1% · Canada
- Languages at home
- 93% English-only · German/W. Germanic 6% Spanish 1%
Political lean MEDSL · Douglas
- 2024 margin
- Solid R (+72.0) · D 13.7% · R 85.6%
- 2008→2024 swing
- -38.2pp toward R · 2008: -33.8pp · 2024: -72.0pp
- All cycles
- 2024: R+72.0 2020: R+69.8 2016: R+67.5 2012: R+44.8 2008: R+33.8
Not yet ingested
- Civics
- —
Market trends
- HPI YoY
- ▲ 1.92%
- Current HPI
- 137.5893
- Rent YoY
- —
- Metro
- —
- State GDP YoY
- ▲ 1.84%
- F500 in state
- 20
Industry mix (Fortune 500 HQ in MO)
| Industry | F500 HQs | Revenue |
|---|---|---|
| Healthcare | 1 | $163B |
|
||
| Insurance | 1 | $21B |
|
||
| Industrial Technology | 1 | $17B |
|
||
| Retail | 1 | $16B |
|
||
| Industrial Distribution | 1 | $10B |
|
||
| Utilities | 1 | $9B |
|
||
Price history
1 event — show timeline
- 2026-05-11 Listed $79,995 SOMO
Cash-flow waterfall
monthlySold comps — $/sqft
last 12 mo · ≤1 miLoading sold comps…