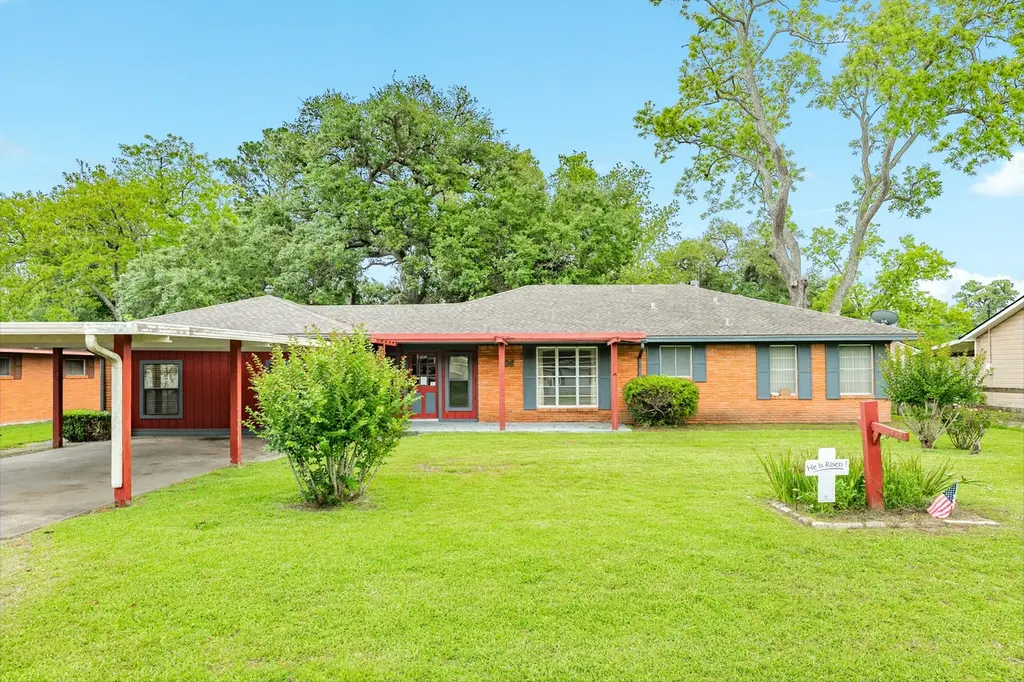
706 Brockman St · Sweeny, TX
Flood risk 4/10 · Minor
- FEMA flood zone
- X (unshaded)
- Chance of flooding over 30 yrs
- 0.22%
- Est. flood insurance / yr
- $507 – $1,088
Fire risk 4/10 · Minor
- Est. fire insurance / yr
- $1,222 – $2,270
Heat risk 10/10 · Severe
- Hot days now (above 110°F)
- 7 days/yr
- Hot days in 30 yrs
- 25 days/yr
Wind risk 9/10 · Severe
- Chance of severe wind over 30 yrs
- 99.0%
Air-quality risk 2/10 · Minimal
- Unhealthy air days now
- 1 days/yr
- Unhealthy air days in 30 yrs
- 2 days/yr
Risk factors via First Street. Map © Google.
Why this score? — see what drove the D grade
The composite is a weighted blend of 9 inputs, each scored 0–100. Each bar is that input's sub-score; the figure is the points it added to the 100-point composite (weight × sub-score).
- Cash flow +10.5/30.0
- Appreciation +10.0/10.0
- 1% rule +4.4/10.0
- ARV discount +4.4/15.0
- Livability +3.6/5.0
- Schools +3.1/10.0
- DSCR +3.0/10.0
- Rent growth +2.5/5.0
- Condition / age +2.5/5.0
$209,900
🖨 Deal sheet (PDF) 📄 Offer letter ✓ Due diligence
Listing remarks
In the heart of Sweeny, this charming 3 bed, 2 bath brick home is located in a very well established neighborhood. Enjoy two living areas , a large dining space, an efficient kitchen, and a dedicated laundry room. Step outside to an expansive screened patio—your spot for cookouts and easy outdoor living—overlooking a beautifully shaded backyard anchored by a massive live oak. A 240 sq. ft. shop with a garage-style door lets you drive the mower right in and still have room for tools or a workspace. A 2-car carport adds sheltered parking. Centrally located near SISD schools, parks, shopping, and the hospital, with quick access to Hwy 35 for commutes to Phillips 66, Bay City, Angle
Key facts
- Large dining space
- Two living areas
- Efficient kitchen
Tags
Property features AI
Exterior
- Parking: Attached carport; 2-car carport
- Utilities: Public water; Public sewer
- Home design: Residential property; Slab foundation; Built in 1958
- Construction: Brick construction; Composition roof
- Exterior features: Enclosed porch; Screened porch; Fence in back yard; Storage shed(s)
Interior
- Kitchen: Dishwasher; Gas cooktop; Gas oven
- Flooring: Concrete floors; Vinyl floors
- Bathrooms: 2 full bathrooms
- Heating & cooling: Central heating (electric); Central air conditioning (electric)
- Interior features: Tub with shower; Ceiling fans; Combined living and dining area; Total of 5 rooms
- Laundry & utility: Washer hookup; Electric dryer hookup; Gas dryer hookup
Neighborhood map
What this means for you Summary
Snapshot
- This is a 3-bed/2.0-bath single-family listed at $210k.
Deal economics
- At list price, monthly cash flow is $-107 ($-1k/yr) — negative.
- To cash-flow at today's rent, offer at most $191k (9.0% below list).
- To meet the 1% rule (rent ≥ 1% of price), the offer needs to be $197k (6.2% below list).
- Recommended offer: $191k (9.0% below list) — sets the bar for cash-flow.
- Cap rate 5.7% vs local median 3.4% in Sweeny — top-decile yield for the area; either an underpriced asset or a hidden risk that comps aren't pricing in. Stress-test before assuming the spread holds.
Location & tenants
- Location reads 71/100 on livability (#306 in TX) — a middle-class / working-renter tenant base. Strengths: cost of living A+, housing A+, crime A; Watch: amenities F, commute F.
- Sweeny ISD (town): math 32% / reading 40% proficiency, ranked #480 of 826 in TX (top 58%) — families likely to look elsewhere, expect single-tenant / working-renter base with shorter leases.
- Zoned schools: Sweeny El (math 34% / reading 41%, grade F, #1,744 of 4,322 statewide, top 41%, 864 students, 67% FRL); Sweeny J H (math 29% / reading 36%, grade F, #947 of 1,662 statewide, top 58%, 445 students, 57% FRL); Sweeny H S (math 37% / reading 47%, grade F, #730 of 1,632 statewide, top 47%, 589 students, 51% FRL).
- Market conditions: 113 active listings in the ZIP; 3 comparable units currently listed for rent nearby; rentals lingering (median 46d on market — plan ~5-8 weeks vacancy on turnover, expect pricing pressure); 67% of comp listings sitting > 30 days — soft ceiling on asking rent; 3,960 units permitted in Brazoria County in 2024 (593 in 5+ unit buildings).
Forward outlook
- In year one you build about $22k of equity ($1k loan paydown + $21k appreciation (10.0% local appreciation)).
- Brazoria County population projected at +44% by 2050 — long-run rental-demand tailwind backs the buy-and-hold thesis.
- By year 2, paydown + projected appreciation supports a ~$36k cash-out refi (75% LTV) — recoverable capital for the next deal without selling this one.
Negotiation context
- It's been on market 47 days — a 3% lower offer ($204k) is reasonable based on typical stale-listing flexibility.
- 3 sale attempts since 4y ago; this cycle's ask has dropped $15k (7%) from the opening price — seller is motivated, your offer sets the floor, not the list.
Risks & watch-outs
- Watch-outs: property tax is 2.7% of price; built in 1958 — expect roof / HVAC / electrical / plumbing capex.
- Climate carrying-cost: severe wind risk, 99% chance of damaging wind over 30y; extreme-heat days projected 7→25/yr by 2055 (HVAC capex compounding) — expect insurance premiums to compound above CPI over the hold.
Questions for the listing agent
- What do current leases actually rent for vs. the listed asking? Can we see a recent rent roll and the last 12 months of T-12 income?
- It's been on market 47 days. Have you received any prior offers? Is the seller open to a 9% concession, seller financing, or rate buy-down credit?
- Built in 1958 — when were the roof, HVAC, electrical panel, plumbing, and water heater last replaced?
- Property tax is high relative to price — has the assessment been appealed recently, and will the sale trigger a re-assessment?
- Is there a deadline driving the sale (1031 exchange, divorce, estate, relocation)? That informs how much negotiation room exists.
- The area grade is low — what's the realistic commute time and amenity access for the typical tenant pool here? Any planned neighborhood developments (good or bad) we should know about?
- What's the average days-on-market for RENTAL listings here right now (not sales)? A rising rental-DOM trend means longer vacancies and softer asking-rent achievability than the comps imply.
- What's the recent tenant-quality profile in this submarket — average credit score on applications, eviction rate, late-payment / NSF rate, and stable-employment percentage? A property-management company in the area should have these aggregated.
- How much new for-sale + rental construction is in the pipeline within 1–3 miles? Heavy new supply typically softens prices + rents 12–24 months out; constrained supply supports both.
Investment metrics
- 1% rule
- 0.94% ✗
- Cap rate
- 5.68%
- Cash-on-cash
- -2.18%
- DSCR
- 0.90
- GRM
- 8.9
CMA / ARV
- ARV (median comp)
- $196,276
- List price
- $209,900
- Delta
- 6.94%
- Verdict
- FAIR
- Comps
- 20 within 1.0 mi
Show comp detail 12 sales within ~0.75 mi
| Address | Dist | Beds/Ba | Sqft | Sold | Price | $/sf | Match |
|---|---|---|---|---|---|---|---|
| 707 Maple St | 0.30mi | 3/2.0 | 2,090 (+1%) | 10mo | $265,000 | $127 | 77 |
| 206 N Orange St | 0.16mi | 4/2.0 (+1) | 1,900 (-9%) | 4mo | $229,000 | $121 | 70 |
| 801 Alice St | 0.11mi | 3/2.0 | 1,850 (-11%) | 14mo | $199,500 | $108 | 65 |
| 1008 Brockman St | 0.23mi | 3/1.5 | 1,858 (-11%) | 6mo | $125,000 | $67 | 64 |
| 1010 Avenue A | 0.35mi | 4/3.0 (+1) | 2,042 (-2%) | 12mo | $274,900 | $135 | 62 |
| 501 Avenue B | 0.31mi | 3/2.0 | 1,854 (-11%) | 7mo | $240,000 | $129 | 62 |
| 309 E 3rd St | 0.24mi | 4/2.5 (+1) | 1,989 (-4%) | 16mo | $209,900 | $106 | 61 |
| 312 N Orange St | 0.15mi | 4/2.5 (+1) | 1,770 (-15%) | 3mo | $199,900 | $113 | 58 |
| 111 N Holly St | 0.26mi | 4/2.0 (+1) | 1,790 (-14%) | 3mo | $79,900 | $45 | 57 |
| 903 Happy Holw | 0.47mi | 3/2.0 | 1,816 (-13%) | 8mo | $200,000 | $110 | 51 |
| 604 Pine | 0.19mi | 3/3.0 | 1,808 (-13%) | 20mo | $190,000 | $105 | 48 |
| 603 Rural Ln | 0.53mi | 4/2.0 (+1) | 1,929 (-7%) | 22mo | $239,000 | $124 | 40 |
Match score weights: distance 35% · size 25% · config 20% · recency 20%. Top-matched comps best support the ARV.
Projected returns pro-forma
10.0% appreciation · 3.0% rent growth · sell at horizon
- IRR
- 22.8%
- Equity multiple
- 2.83×
- Total profit
- $107,669
- Equity at exit
- $189,095
- IRR
- 20.4%
- Equity multiple
- 6.49×
- Total profit
- $322,739
- Equity at exit
- $407,790
Cash invested: $58,772 (down + closing). Projections, not guarantees.
Landlord ↔ Tenant lean methodology
- Overall (STATE)
- 87 Strongly Landlord-Friendly
- State Texas
- 87 Strongly Landlord-Friendly · R+5
- County
- — inherits STATE
- City
- — inherits STATE
ZIP-level market 77480
- Home prices YoY
- 12.0%
- Active inventory
- 113
- Price-to-rent
- 8.9×
Monthly cashflow live
- Estimated rent
- $1,968 medium interval (Pro) →
- Mortgage (P&I)
- −$1,101
- Tax from tax record
- −$474 /mo · $5,686/yr
- Insurance
- −$87
- HOA
- −$0
- Vacancy / Maint / Mgmt
- −$413
- Net cashflow
- $-107
Break-even live
Sensitivity live
| Price | -10% $12 | -5% $-47 | +0% $-107 | +5% $-166 | +10% $-226 |
|---|---|---|---|---|---|
| Rent | -10% $-262 | -5% $-185 | +0% $-107 | +5% $-29 | +10% $49 |
| Rate | -1.0pp $-1 | -0.5pp $-53 | base $-107 | +0.5pp $-161 | +1.0pp $-217 |
UW: 25.0% down · 7.5% · 30yr · 1.5% tax · 5.0% vac · 8.0% maint · 8.0% mgmt
Financing live
Cash to close
- Down payment
- $52,475
- Closing costs
- $6,297
- Reserves months
- —
- Total cash needed
- —
Loan-product check · same deal, 3 products live
Conventional
25% down · 7.5% · 30yr
- Down + closing
- —
- Monthly P&I
- —
- Monthly cashflow
- —
- DSCR
- —
- Eligible?
- —
Personal DTI + credit; lowest rate.
DSCR
20% down · 8.5% · 30yr
- Down + closing
- —
- Monthly P&I
- —
- Monthly cashflow
- —
- DSCR
- —
- Eligible?
- —
No personal income docs; deal must DSCR.
Hard money
10% down · 12.0% · 12mo
- Down + closing
- —
- Monthly P&I
- —
- Monthly cashflow
- —
- DSCR
- —
- Eligible?
- —
Short-term bridge; refi at stabilization.
Rent comps 3 comps
| Address | Beds | Baths | Sqft | Rent | $/sqft | DOM | Units | Dist |
|---|---|---|---|---|---|---|---|---|
| 1102 Avenue C Unit C Sweeny, TX | 3.0 | 2.0 | 1691 | $1,700 | $1.01 | 4d | 1 | 0.43mi |
| 303 Yaupon St Sweeny, TX | 3.0 | 2.0 | 1642 | $1,850 | $1.13 | 45d | 1 | 0.46mi |
| 208 Silver Leaf St Sweeny, TX | 3.0 | 2.0 | 1984 | $2,400 | $1.21 | 45d | 1 | 0.58mi |
Listing history 26 events
-
2026-06-22days on market $209,900 Active 47 DOM
-
2026-06-21days on market $209,900 Active 46 DOM
-
2026-06-19days on market $209,900 Active 44 DOM
-
2026-06-18days on market $209,900 Active 43 DOM
-
2026-06-17days on market $209,900 Active 42 DOM
-
2026-06-16days on market $209,900 Active 41 DOM
-
2026-06-15days on market $209,900 Active 40 DOM
-
2026-06-14days on market $209,900 Active 38 DOM
-
2026-06-12days on market $209,900 Active 37 DOM
-
2026-06-09days on market $209,900 Active 34 DOM
-
2026-06-08days on market $209,900 Active 33 DOM
-
2026-06-07days on market $209,900 Active 32 DOM
-
2026-06-07days on market $209,900 Active 31 DOM
-
2026-06-03days on market $209,900 Active 28 DOM
-
2026-06-02days on market $209,900 Active 27 DOM
-
2026-06-01days on market $209,900 Active 26 DOM
-
2026-05-31days on market $209,900 Active 25 DOM
-
2026-05-30days on market $209,900 Active 24 DOM
-
2026-05-06$225,000 Active 866-char remark
-
2022-11-02historical
-
2022-10-14price $249,000
-
2022-09-26$255,000 Active
-
2022-09-23historical
-
2022-08-30price $265,000
-
2022-07-10price $275,000
-
2022-06-29$295,000 Active
ⓘ Source: listings_history table (triggers on properties + properties_extension) + one-shot
backfill from property_details.listing_events for pre-trigger history.
Tax reassessment forecast TX · Resets to sale price
- Current annual tax
- $5,686 · $474/mo
- Projected year-2 tax
- $5,686 · $474/mo
- Expected delta
- $0/yr ($0/mo · 0.0%)
ⓘ Screening estimate from a state-policy table — verify with the county assessor before closing.
Climate risk First Street
- Flood 4/10 Moderate FEMA zone X (unshaded) · 22% chance over 30 yrs
- Wildfire 4/10 Moderate
- Heat 10/10 Extreme 7 d/yr ≥110°F today · 25 d/yr by 30 yrs out
- Wind 9/10 Extreme 99% chance of damaging wind over 30 yrs
- Air quality 2/10 Low 1 unhealthy d/yr today · 2 by 30 yrs out
Nearby sold comps map
Loading sold comps map…
Walkable amenities ~0.75 mi
Loading nearby amenities…
Taxation est. · year 1
- Rental income
- $23,622
- − Mortgage interest
- −$11,758
- − Property taxes
- −$5,686
- − Insurance
- −$1,050
- − Repairs & maintenance
- −$1,890
- − Management
- −$1,890
- − Depreciation
- −$6,106
- Taxable loss
- −$4,757
- Est. tax savings @ 24.0%
- +$1,142
- After-tax cash flow
- $-141/yr
For passive investors: Depreciation is non-cash, so a rental often shows a tax loss while cash-flowing — sheltering income. Rental losses are passive: they offset passive income freely, and up to $25,000/yr can offset ordinary (W-2) income if you actively participate and your MAGI is under $100k (phasing out to $0 by $150k); unused losses carry forward. On sale, claimed depreciation is recaptured at up to 25%, and gains may owe capital-gains tax (a 1031 exchange can defer both). Figures are a year-1 estimate at your 24.0% rate — not tax advice; consult a CPA.
Schools (NCES district)
- District
- Sweeny ISD
- NCES district ID
- 4841970
- Math proficiency
- 32% ▼ -12.00%
- Reading proficiency
- 40% ▼ -1.00%
- Median HH income
- $53,607
- Composite
- 31.49/100
- National rank
- #5975
- State rank
- #480 of 826 in TX
Livability — Sweeny
- Score
- 71/100
- State rank
- #306
- US rank
- #6914
Category grades
Schools grade is shown separately in the Schools card above.
Census & demographics
- Census place
- Sweeny, TX
- Population (ZIP)
- 8,252
Population outlook (Brazoria County) Hauer SSP2
- Today (2025)
- 420,414 people
- By 2030
- 457,585 · +8.8%
- By 2040
- 532,232 · +26.6%
- By 2050
- 605,399 · +44.0%
- By 2075
- 779,358 · +85.4%
- By 2100
- 883,759 · +110.2%
Race, ethnicity, and origin ACS 2023
- Neighborhood character
- Predominantly White (71%)
- Race & ethnicity
- White 71% Hispanic / Latino 17% Black 8% Two or more races 7% Asian 1%
- Hispanic origin (detail)
- Mexican 16%
- Common ancestry
- Italian 3% Slovak 3% Iranian 1%
- Foreign-born
- 4% · Canada, China
- Languages at home
- 90% English-only · Spanish 9% Tagalog/Filipino 1%
Political lean MEDSL · Brazoria
- 2024 margin
- R (+19.7) · D 39.5% · R 59.2% · Other 1.3%
- 2008→2024 swing
- +9.9pp toward D · 2008: -29.6pp · 2024: -19.7pp
- All cycles
- 2024: R+19.7 2020: R+18.2 2016: R+24.6 2012: R+34.2 2008: R+29.6
Not yet ingested
- Civics
- —
Market trends
- HPI YoY
- ▲ 35.27%
- Current HPI
- 328.8657
- Rent YoY
- —
- Metro
- —
- State GDP YoY
- ▲ 3.95%
- F500 in state
- 110
Industry mix (Fortune 500 HQ in TX)
| Industry | F500 HQs | Revenue |
|---|---|---|
| Energy | 16 | $1,198B |
|
||
| Technology | 5 | $198B |
|
||
| Engineering / Construction | 4 | $72B |
|
||
| Energy Services | 3 | $60B |
|
||
| Utilities | 3 | $41B |
|
||
| Healthcare | 2 | $330B |
|
||
Price history
-28.8% since first listed9 events — show timeline
- 2026-05-22 Price Changed $209,900 HARMLS
- 2026-05-06 Listed $225,000 HARMLS
- 2022-11-02 Listing Removed — HARMLS
- 2022-10-14 Price Changed $249,000 HARMLS
- 2022-09-26 Listed $255,000 HARMLS
- 2022-09-23 Listing Removed — HARMLS
- 2022-08-30 Price Changed $265,000 HARMLS
- 2022-07-10 Price Changed $275,000 HARMLS
- 2022-06-29 Listed $295,000 HARMLS
Property tax history
+4.0%/yrLatest (2025): $5,686 · +13.4% YoY. Source: county tax records.
Cash-flow waterfall
monthlySold comps — $/sqft
last 12 mo · ≤1 miLoading sold comps…