 🏷️ Likely Rental
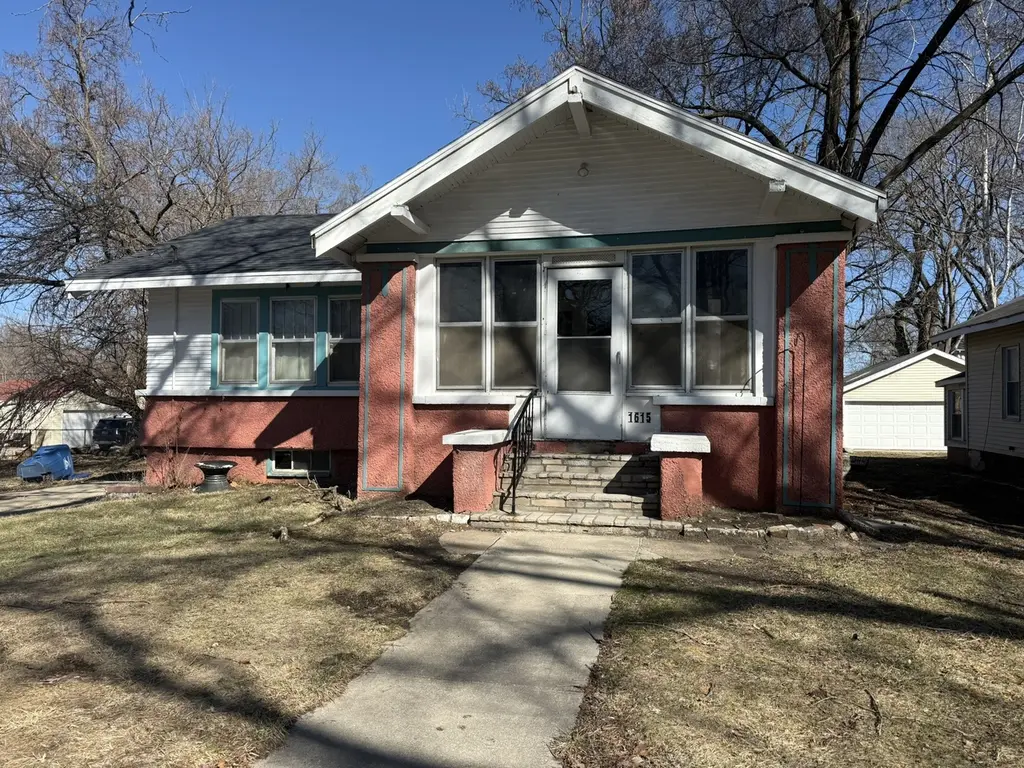
1615 Jefferson Ave · Des Moines, IA
Flood risk 1/10 · Minimal
- FEMA flood zone
- X (unshaded)
- Chance of flooding over 30 yrs
- 0.0%
- Est. flood insurance / yr
- $473 – $860
Fire risk 1/10 · Minimal
- Est. fire insurance / yr
- $902 – $1,676
Heat risk 3/10 · Minor
- Hot days now (above 103°F)
- 7 days/yr
- Hot days in 30 yrs
- 15 days/yr
Wind risk 2/10 · Minimal
- Chance of severe wind over 30 yrs
- —
Air-quality risk 2/10 · Minimal
- Unhealthy air days now
- 1 days/yr
- Unhealthy air days in 30 yrs
- 2 days/yr
Risk factors via First Street. Map © Google.
Why this score? — see what drove the C grade
The composite is a weighted blend of 9 inputs, each scored 0–100. Each bar is that input's sub-score; the figure is the points it added to the 100-point composite (weight × sub-score).
- ARV discount +15.0/15.0
- Cash flow +12.4/30.0
- Appreciation +10.0/10.0
- Rent growth +4.5/5.0
- Livability +4.0/5.0
- Schools +3.8/10.0
- DSCR +3.7/10.0
- 1% rule +3.3/10.0
- Condition / age +2.5/5.0
$135,000
🖨 Deal sheet 📄 Offer letter ✓ Due diligence
Listing remarks MLS
Fantastic value on this charming ranch featuring original woodwork throughout. The home has been used exclusively as a rental property and offers flexibility as an investment opportunity or a wonderful first home. Step into a spacious living room where hardwood floors flow seamlessly throughout the main level, leading to three bedrooms and a fully updated bathroom. Just off the living room is a versatile formal dining space that could also serve as a home office or playroom, filled with natural light from multiple windows. The kitchen offers tall cabinetry and ample storage, the perfect canvas to make it your own. Additional features include a small mudroom near the basement stairs, a basement ideal for storage, and a large enclosed front porch—perfect for relaxing or entertaining. Newer Roof, Dry Basement, Original Woodwork throughout- this home is ready for your vision! * * Reliable income producer—most recent rental rate was $995/month * *
Key facts
- Natural light
- Original woodwork
- Hardwood floors
Tags
Neighborhood map
What this means for you Summary
Snapshot
- This is a 3-bed/1.0-bath single-family listed at $135k.
Deal economics
- At list price, monthly cash flow is $-22 ($-266/yr) — negative.
- To cash-flow at today's rent, offer at most $131k (2.9% below list).
- To meet the 1% rule (rent ≥ 1% of price), the offer needs to be $112k (17.1% below list).
- Recommended offer: $112k (17.1% below list) — sets the bar for 1% rule.
- Cap rate 6.1% vs local median 3.1% in Des Moines — top-decile yield for the area; either an underpriced asset or a hidden risk that comps aren't pricing in. Stress-test before assuming the spread holds.
Location & tenants
- Location reads 81/100 on livability (#63 in IA, #1,432 nationally) — a professional / high-income tenant draw. Strengths: commute A+, cost of living A+, housing A+; Watch: employment C-, schools D+, crime F.
- Des Moines Independent Community School District (urban): math 43% / reading 46% proficiency, ranked #289 of 289 in IA (top 100%) — families likely to look elsewhere, expect single-tenant / working-renter base with shorter leases; 63% free/reduced lunch — lower-income household profile, screen leases tightly.
- Market conditions: Rents rising fast (+8.2%/yr); 64 active listings in the ZIP; 40 comparable units currently listed for rent nearby; rentals at typical pace (median 24d on market — plan ~3-4 weeks tenant-placement turnaround); 42% of comp listings sitting > 30 days — soft ceiling on asking rent; lower-income renter base — watch delinquency; 2,953 units permitted in Polk County in 2024 (540 in 5+ unit buildings).
- This rent runs 34% of the median local income ($40k/yr) — at the standard rent-burdened threshold; future hikes will face affordability resistance.
Forward outlook
- In year one you build about $14k of equity ($933 loan paydown + $14k appreciation (10.0% local appreciation)).
- Polk County population projected at +37% by 2050 — long-run rental-demand tailwind backs the buy-and-hold thesis.
- At projected returns (10.0% appreciation + 8.0% rent growth), your $38k cash investment doubles in ~3 years — after that, you're playing with house money.
- By year 3, paydown + projected appreciation supports a ~$37k cash-out refi (75% LTV) — recoverable capital for the next deal without selling this one.
Negotiation context
- It's been on market 182 days — a 12% lower offer ($119k) is reasonable based on typical stale-listing flexibility.
Risks & watch-outs
- Watch-outs: built in 1915 — expect roof / HVAC / electrical / plumbing capex.
Questions for the listing agent
- What do current leases actually rent for vs. the listed asking? Can we see a recent rent roll and the last 12 months of T-12 income?
- It's been on market 182 days. Have you received any prior offers? Is the seller open to a 17% concession, seller financing, or rate buy-down credit?
- Built in 1915 — when were the roof, HVAC, electrical panel, plumbing, and water heater last replaced?
- Why hasn't it sold? Are there any deal-killer items the seller is aware of (foundation, flood, title, zoning, code violations)?
- Is there a deadline driving the sale (1031 exchange, divorce, estate, relocation)? That informs how much negotiation room exists.
- Schools are D-rated, which usually means shorter tenancies and higher turnover. Who's the typical renter profile here, and what's been the actual vacancy rate?
- Crime grade is F in this area — have there been break-ins, vandalism, or insurance claims at this property in the last 3 years? What carrier currently insures it and at what premium?
- What's the average days-on-market for RENTAL listings here right now (not sales)? A rising rental-DOM trend means longer vacancies and softer asking-rent achievability than the comps imply.
- What's the recent tenant-quality profile in this submarket — average credit score on applications, eviction rate, late-payment / NSF rate, and stable-employment percentage? A property-management company in the area should have these aggregated.
- How much new for-sale + rental construction is in the pipeline within 1–3 miles? Heavy new supply typically softens prices + rents 12–24 months out; constrained supply supports both.
Investment metrics
- 1% rule
- 0.83% ✗
- Cap rate
- 6.10%
- Cash-on-cash
- -0.70%
- DSCR
- 0.97
- GRM
- 10.1
CMA / ARV
- ARV (median comp)
- $172,130
- List price
- $135,000
- Delta
- -21.57%
- Verdict
- UNDERPRICED
- Comps
- 20 within 1.0 mi
Show comp detail 12 sales within ~0.75 mi
| Address | Dist | Beds/Ba | Sqft | Sold | Price | $/sf | Match |
|---|---|---|---|---|---|---|---|
| 1527 Martin Luther King Jr Pkwy | 0.32mi | 2/1.0 (-1) | 1,086 (-1%) | 2mo | $60,000 | $55 | 76 |
| 1503 13th St | 0.44mi | 3/1.0 | 1,070 (-3%) | 1mo | $87,000 | $81 | 75 |
| 1821 12th St | 0.36mi | 3/3.0 | 1,097 (-0%) | 2mo | $199,000 | $181 | 73 |
| 1412 Chautauqua Pkwy | 0.15mi | 2/2.0 (-1) | 1,038 (-6%) | 2mo | $255,000 | $246 | 73 |
| 1821 Washington Ave | 0.14mi | 3/2.0 | 977 (-11%) | 1mo | $165,500 | $169 | 70 |
| 2200 Clark St | 0.51mi | 2/1.0 (-1) | 1,030 (-6%) | 0mo | $176,900 | $172 | 61 |
| 1534 12th St | 0.42mi | 3/1.5 | 1,220 (+11%) | 1mo | $201,000 | $165 | 59 |
| 1559 23rd St | 0.47mi | 3/1.0 | 1,223 (+11%) | 1mo | $167,500 | $137 | 58 |
| 2001 10th St | 0.51mi | 2/1.0 (-1) | 1,180 (+8%) | 1mo | $194,500 | $165 | 58 |
| 2021 22nd St | 0.39mi | 2/1.0 (-1) | 952 (-13%) | 3mo | $150,000 | $158 | 52 |
| 1820 23rd St | 0.45mi | 2/2.0 (-1) | 992 (-10%) | 3mo | $190,000 | $192 | 52 |
| 1327 23rd St | 0.70mi | 2/2.0 (-1) | 1,042 (-5%) | 1mo | $140,000 | $134 | 49 |
Match score weights: distance 35% · size 25% · config 20% · recency 20%. Top-matched comps best support the ARV.
Projected returns pro-forma
10.0% appreciation · 8.0% rent growth · sell at horizon
- IRR
- 25.4%
- Equity multiple
- 3.06×
- Total profit
- $78,026
- Equity at exit
- $121,619
- IRR
- 23.7%
- Equity multiple
- 7.50×
- Total profit
- $245,537
- Equity at exit
- $262,275
Cash invested: $37,800 (down + closing). Projections, not guarantees.
Landlord ↔ Tenant lean methodology
- Overall (STATE)
- 83 Strongly Landlord-Friendly
- State Iowa
- 83 Strongly Landlord-Friendly · R+6
- County
- — inherits STATE
- City
- — inherits STATE
ZIP-level market 50314
- Home prices YoY
- 9.8%
- Rents YoY
- 8.2%
- Active inventory
- 64
- Price-to-rent
- 10.1×
Monthly cashflow live
- Estimated rent
- $1,119 high interval (Pro) →
- Mortgage (P&I)
- −$708
- Tax from tax record
- −$142 /mo · $1,704/yr
- Insurance
- −$56
- HOA
- −$0
- Vacancy / Maint / Mgmt
- −$235
- Net cashflow
- $-22
Break-even live
UW: 25.0% down · 7.5% · 30yr · 1.5% tax · 5.0% vac · 8.0% maint · 8.0% mgmt
Financing live
Cash to close
- Down payment
- $33,750
- Closing costs
- $4,050
- Reserves months
- —
- Total cash needed
- —
Loan-product check · same deal, 3 products live
Conventional
25% down · 7.5% · 30yr
- Down + closing
- —
- Monthly P&I
- —
- Monthly cashflow
- —
- DSCR
- —
- Eligible?
- —
Personal DTI + credit; lowest rate.
DSCR
20% down · 8.5% · 30yr
- Down + closing
- —
- Monthly P&I
- —
- Monthly cashflow
- —
- DSCR
- —
- Eligible?
- —
No personal income docs; deal must DSCR.
Hard money
10% down · 12.0% · 12mo
- Down + closing
- —
- Monthly P&I
- —
- Monthly cashflow
- —
- DSCR
- —
- Eligible?
- —
Short-term bridge; refi at stabilization.
Rent comps 40 comps
| Address | Beds | Baths | Sqft | Rent | $/sqft | DOM | Units | Dist |
|---|---|---|---|---|---|---|---|---|
| 1714 College Ave Des Moines, IA | 3.0 | 1.0 | 1015 | $1,050 | $1.03 | 43d | 1 | 0.24mi |
| 1718 22nd St Des Moines, IA | 2.0 | 1.0 | 840 | $995 | $1.18 | 14d | 1 | 0.38mi |
| 1914 10th St Des Moines, IA | 2.0 | 1.0 | 740 | $1,050 | $1.42 | 43d | 1 | 0.48mi |
| 1914 10th St Des Moines, IA | 2.0 | 1.0 | 740 | $1,050 | $1.42 | 23d | 1 | 0.48mi |
| 1314 Harrison Ave Des Moines, IA | 3.0 | 1.0 | 1150 | $1,195 | $1.04 | 23d | 1 | 0.50mi |
| 2501 24th St Unit 121 Des Moines, IA | 3.0 | 2.0 | 950 | $995 | $1.05 | 23d | 1 | 0.61mi |
| 2501 24th St Unit 111 Des Moines, IA | 2.0 | 1.0 | 750 | $760 | $1.01 | 23d | 1 | 0.62mi |
| 2501 24th St Des Moines, IA | 2.0 | 1.0 | 910 | $795 | $0.87 | 23d | 1 | 0.62mi |
| 2501 24th St Unit 113 Des Moines, IA | 2.0 | 1.0 | 750 | $945 | $1.26 | 43d | 1 | 0.62mi |
| 2501 24th St Unit 101 Des Moines, IA | 2.0 | 1.0 | 750 | $725 | $0.97 | 23d | 1 | 0.62mi |
| 2501 24th St Apt 107 Des Moines, IA | 3.0 | 2.0 | 950 | $1,045 | $1.10 | 14d | 1 | 0.62mi |
| 2501 24th St Apt 106 Des Moines, IA | 4.0 | 2.0 | 1175 | $1,245 | $1.06 | 43d | 1 | 0.62mi |
| 1438 9th St Des Moines, IA | 2.0 | 1.0 | 700 | $745 | $1.06 | 21d | 1 | 0.66mi |
| 1312 22nd St Des Moines, IA | 2.0 | 1.0 | 841 | $825 | $0.98 | 43d | 1 | 0.70mi |
| 1312 22nd St Unit 2 Des Moines, IA | 2.0 | 1.0 | 841 | $825 | $0.98 | 23d | 1 | 0.70mi |
| 1312 22nd St Unit 2 Des Moines, IA | 2.0 | 1.0 | 841 | $850 | $1.01 | 43d | 1 | 0.70mi |
| 2717 Meek Ave Des Moines, IA | 2.0 | 2.0 | 1128 | $1,550 | $1.37 | 14d | 1 | 0.78mi |
| 1171 21st St Unit 2 Des Moines, IA | 4.0 | 1.0 | 1210 | $1,300 | $1.07 | 43d | 1 | 0.80mi |
| 1171 21st St Unit 1 Des Moines, IA | 2.0 | 1.0 | 1028 | $1,150 | $1.12 | 43d | 1 | 0.80mi |
| 1217 24th St Des Moines, IA | 2.0 | 1.0–2.0 | 618 | $1,400 | $2.26 | 14d | 4 | 0.84mi |
| 2530 University Ave Des Moines, IA | 2.0 | 1.0 | 647 | $1,750 | $2.70 | 14d | 36 | 0.97mi |
| 1123 24th St Unit 1 Des Moines, IA | 3.0 | 1.0 | 850 | $1,185 | $1.39 | 43d | 1 | 0.97mi |
| 1100 24th St Unit DT 22 Des Moines, IA | 2.0 | 1.0 | 737 | $1,095 | $1.49 | 43d | 1 | 1.01mi |
| 1100 24th St Des Moines, IA | 2.0 | 1.0 | 748 | $1,050 | $1.40 | 14d | 1 | 1.01mi |
| 1101 25th St Unit DP 11 Des Moines, IA | 2.0 | 2.0 | 850 | $1,315 | $1.55 | 43d | 1 | 1.03mi |
| 2411 Welbeck Rd #11 Des Moines, IA | 2.0 | 1.0 | 750 | $745 | $0.99 | 43d | 1 | 1.03mi |
| 2411 Welbeck Rd #7 Des Moines, IA | 2.0 | 1.0 | 750 | $845 | $1.13 | 43d | 1 | 1.03mi |
| 913 Day St Des Moines, IA | 2.0 | 1.0 | 800 | $900 | $1.12 | 23d | 1 | 1.12mi |
| 1717 Olive Ave Unit B6 Des Moines, IA | 2.0 | 2.0 | 1092 | $1,700 | $1.56 | 43d | 1 | 1.12mi |
| 3103 Forest Ave Des Moines, IA | 1.0–2.0 | 1.0–1.5 | 900 | $1,550 | $1.72 | 14d | 1 | 1.14mi |
| 2813 Cottage Grove Ave Unit 2 Des Moines, IA | 3.0 | 1.0 | 900 | $1,200 | $1.33 | 43d | 1 | 1.18mi |
| 1020 25th St Unit 3 Des Moines, IA | 2.0 | 1.0 | 845 | $1,150 | $1.36 | 19d | 1 | 1.19mi |
| 3201 Forest Ave Des Moines, IA | 3.0 | 1.0–2.0 | 717 | $1,600 | $2.23 | 14d | 16 | 1.19mi |
| 2901 Boston Ave Des Moines, IA | 1.0–2.0 | 1.0–1.5 | 707 | $1,300 | $1.84 | 14d | 7 | 1.23mi |
| 2002 34th St Des Moines, IA | 2.0 | 1.0 | 897 | $1,350 | $1.51 | 21d | 1 | 1.24mi |
| 2940 Brattleboro Ave Unit 2 Des Moines, IA | 3.0 | 2.0 | 1250 | $1,300 | $1.04 | 14d | 1 | 1.27mi |
| 3410 5th Ave Des Moines, IA | 4.0 | 2.0 | 1474 | $1,550 | $1.05 | 43d | 1 | 1.35mi |
| 1219 34th St Unit 205 Des Moines, IA | 2.0 | 1.0 | 767 | $1,325 | $1.73 | 23d | 1 | 1.36mi |
| 2403 36th St Des Moines, IA | 3.0 | 2.0 | 1324 | $1,600 | $1.21 | 23d | 1 | 1.36mi |
| 3700 Martin Luther King Junior Pkwy Unit 18 Des Moines, IA | 2.0 | 1.0 | 730 | $750 | $1.03 | 43d | 1 | 1.39mi |
Listing history 14 events
-
2026-06-15days on market $135,000 Active 182 DOM
-
2026-06-14days on market $135,000 Active 180 DOM
-
2026-06-13days on market $135,000 Active 179 DOM
-
2026-06-10days on market $135,000 Active 177 DOM
-
2026-06-09days on market $135,000 Active 176 DOM
-
2026-06-08days on market $135,000 Active 175 DOM
-
2026-06-07days on market $135,000 Active 174 DOM
-
2026-06-05days on market $135,000 Active 171 DOM
-
2026-06-03days on market $135,000 Active 170 DOM
-
2026-06-02days on market $135,000 Active 169 DOM
-
2026-06-01days on market $135,000 Active 168 DOM
-
2026-05-31days on market $135,000 Active 167 DOM
-
2026-05-31days on market $135,000 Active 166 DOM
-
2025-12-15$135,000 Active 971-char remark
Show marketing remark (971 chars)
Fantastic value on this charming ranch featuring original woodwork throughout. The home has been used exclusively as a rental property and offers flexibility as an investment opportunity or a wonderful first home. Step into a spacious living room where hardwood floors flow seamlessly throughout the main level, leading to three bedrooms and a fully updated bathroom. Just off the living room is a versatile formal dining space that could also serve as a home office or playroom, filled with natural light from multiple windows. The kitchen offers tall cabinetry and ample storage, the perfect canvas to make it your own. Additional features include a small mudroom near the basement stairs, a basement ideal for storage, and a large enclosed front porch—perfect for relaxing or entertaining. Newer Roof, Dry Basement, Original Woodwork throughout- this home is ready for your vision! * * Reliable income producer—most recent rental rate was $995/month * *
ⓘ Source: listings_history table (triggers on properties + properties_extension) + one-shot
backfill from property_details.listing_events for pre-trigger history.
Tax reassessment forecast IA · Partial reset (capped growth)
- Current annual tax
- $1,704 · $142/mo
- Projected year-2 tax
- $1,912 · $159/mo
- Expected delta
- +$208/yr (+$17/mo · 12.2%)
ⓘ Screening estimate from a state-policy table — verify with the county assessor before closing.
Climate risk First Street
- Flood 1/10 Low FEMA zone X (unshaded) · 0% chance over 30 yrs
- Wildfire 1/10 Low
- Heat 3/10 Moderate 7 d/yr ≥103°F today · 15 d/yr by 30 yrs out
- Wind 2/10 Low
- Air quality 2/10 Low 1 unhealthy d/yr today · 2 by 30 yrs out
Nearby sold comps map
Loading sold comps map…
Walkable amenities ~0.75 mi
Loading nearby amenities…
Taxation est. · year 1
- Rental income
- $13,428
- − Mortgage interest
- −$7,562
- − Property taxes
- −$1,704
- − Insurance
- −$675
- − Repairs & maintenance
- −$1,074
- − Management
- −$1,074
- − Depreciation
- −$3,927
- Taxable loss
- −$2,589
- Est. tax savings @ 24.0%
- +$621
- After-tax cash flow
- $355/yr
For passive investors: Depreciation is non-cash, so a rental often shows a tax loss while cash-flowing — sheltering income. Rental losses are passive: they offset passive income freely, and up to $25,000/yr can offset ordinary (W-2) income if you actively participate and your MAGI is under $100k (phasing out to $0 by $150k); unused losses carry forward. On sale, claimed depreciation is recaptured at up to 25%, and gains may owe capital-gains tax (a 1031 exchange can defer both). Figures are a year-1 estimate at your 24.0% rate — not tax advice; consult a CPA.
Schools (NCES district)
- District
- Des Moines Independent Community School District
- NCES district ID
- 1908970
- Math proficiency
- 43% ▼ -6.00%
- Reading proficiency
- 46% ▼ -1.00%
- Median HH income
- $45,905
- Composite
- 37.83/100
- National rank
- #4331
- State rank
- #289 of 289 in IA
Livability — Des Moines
- Score
- 81/100
- State rank
- #63
- US rank
- #1432
Category grades
Schools grade is shown separately in the Schools card above.
Census & demographics
- Census place
- Des Moines, IA
- County
- Polk County · 453,298 people
- City population
- 203,612
- Metro
- Des Moines-West Des Moines, IA
- Population (ZIP)
- 10,438
- Household income
- $39,950
- Rent vs Own
- Severe rent burden
- 903.0
Population outlook (Polk County) Hauer SSP2
- Today (2025)
- 548,042 people
- By 2030
- 588,557 · +7.4%
- By 2040
- 670,629 · +22.4%
- By 2050
- 752,830 · +37.4%
- By 2075
- 955,069 · +74.3%
- By 2100
- 1,115,436 · +103.5%
Race, ethnicity, and origin ACS 2023
- Neighborhood character
- Highly diverse neighborhood (Simpson 0.73)
- Race & ethnicity
- Black 37% White 29% Hispanic / Latino 20% Asian 12% Two or more races 10%
- Hispanic origin (detail)
- Mexican 13%
- Common ancestry
- Ukrainian 6% Iranian 2% Swiss 1%
- Foreign-born
- 26% · Canada, Vietnam, Philippines
- Languages at home
- 60% English-only · Spanish 16% Vietnamese 6% Other Asian/Pacific 4%
Political lean MEDSL · Polk
- 2024 margin
- D (+10.9) · D 54.8% · R 43.9% · Other 1.3%
- 2008→2024 swing
- -3.7pp toward R · 2008: 14.6pp · 2024: 10.9pp
- All cycles
- 2024: D+10.9 2020: D+15.2 2016: D+11.5 2012: D+14.2 2008: D+14.6
Not yet ingested
- Civics
- —
Market trends
- HPI YoY
- ▲ 30.18%
- Current HPI
- 338.8301
- Rent YoY
- ▲ 8.17%
- Metro
- Des Moines-West Des Moines, IA
- State GDP YoY
- ▲ 2.48%
- F500 in state
- 4
Industry mix (Fortune 500 HQ in IA)
| Industry | F500 HQs | Revenue |
|---|---|---|
| Financial Services | 1 | $16B |
|
||
| Retail / Convenience | 1 | $15B |
|
||
Price history
1 event — show timeline
- 2025-12-15 Listed $135,000 DMMLS
Property tax history
+0.9%/yrLatest (2025): $1,704 · +2.0% YoY. Source: county tax records.
Cash-flow waterfall
monthlySold comps — $/sqft
last 12 mo · ≤1 miLoading sold comps…