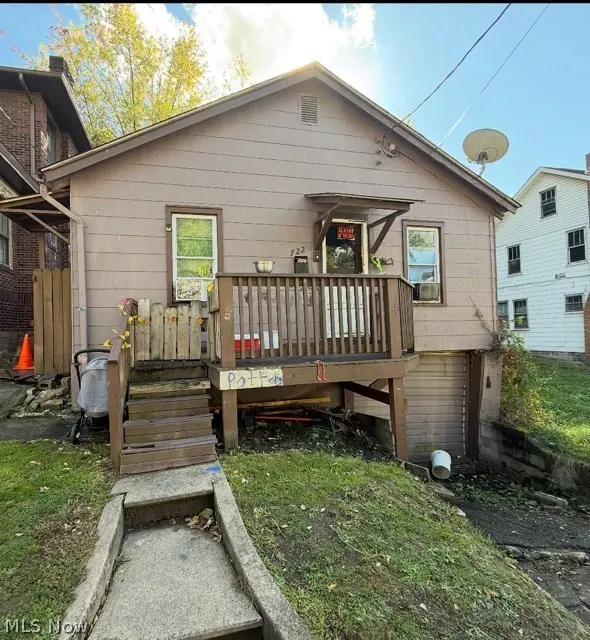
722 Bradshaw Ave · East Liverpool, OH
Flood risk 8/10 · Major
- FEMA flood zone
- X (unshaded)
- Chance of flooding over 30 yrs
- 0.78%
- Est. flood insurance / yr
- $473 – $860
Fire risk 1/10 · Minimal
- Est. fire insurance / yr
- $713 – $1,323
Heat risk 4/10 · Minor
- Hot days now (above 97°F)
- 7 days/yr
- Hot days in 30 yrs
- 19 days/yr
Wind risk 1/10 · Minimal
- Chance of severe wind over 30 yrs
- —
Air-quality risk 2/10 · Minimal
- Unhealthy air days now
- 1 days/yr
- Unhealthy air days in 30 yrs
- 2 days/yr
Risk factors via First Street. Map © Google.
Why this score? — see what drove the B+ grade
The composite is a weighted blend of 9 inputs, each scored 0–100. Each bar is that input's sub-score; the figure is the points it added to the 100-point composite (weight × sub-score).
- Cash flow +30.0/30.0
- ARV discount +15.0/15.0
- 1% rule +10.0/10.0
- DSCR +10.0/10.0
- Livability +3.4/5.0
- Schools +2.7/10.0
- Rent growth +2.5/5.0
- Condition / age +2.5/5.0
- Appreciation +0.0/10.0
$23,900
🖨 Deal sheet (PDF) 📄 Offer letter ✓ Due diligence
Listing remarks MLS
Tlhis is a 3 bedroom home that needs TLC. Has a lot of potential with hardwood floor in BEdrooms and Living room , with gas heat and central air. Plaster walls and a cement back porch. Call me for more info.
Key facts
- 3,001 sq ft lot
- Garage
- Built 1943
Property features AI
Exterior
- Parking: Attached garage (1 car); On-street parking
- Utilities: Public water; Public sewer
- Home design: Single-story; Fixer condition
- Construction: Aluminum siding; Block foundation; Asphalt/fiberglass shingle roof; Built per public records
- Exterior features: Small lot (approx. 0.0689 acres)
Interior
- Bedrooms: Three main-level bedrooms
- Bathrooms: One full bathroom; One half bathroom; One main-level bathroom
- Heating & cooling: Forced air heating; Gas heating
- Interior features: Basement
Neighborhood map
What this means for you Summary
Snapshot
- This is a 3-bed/1.5-bath single-family listed at $24k.
Deal economics
- At list price, monthly cash flow is $342 ($4k/yr) — positive.
- The deal already cash-flows at list — no discount required.
- Meets the 1% rule at list price ($712 rent vs $24k).
- Recommended offer: $23k (3.0% below list) — sets the bar for market timing.
- Cap rate 26.3% vs local median 9.4% in East Liverpool — top-decile yield for the area; either an underpriced asset or a hidden risk that comps aren't pricing in. Stress-test before assuming the spread holds.
Location & tenants
- Location reads 67/100 on livability (#613 in OH) — a middle-class / working-renter tenant base. Strengths: cost of living A+, housing A+, health & safety A+; Watch: amenities F, commute F, employment F.
- East Liverpool City (town): math 28% / reading 37% proficiency, ranked #571 of 656 in OH (top 87%) — families likely to look elsewhere, expect single-tenant / working-renter base with shorter leases; 78% free/reduced lunch — lower-income household profile, screen leases tightly.
- Zoned schools: North Elementary School (math 42% / reading 37%, grade F, #1,055 of 1,584 statewide, top 68%, 407 students, 0% FRL); East Liverpool Junior High (math 28% / reading 32%, grade F, #571 of 654 statewide, top 87%, 290 students, 0% FRL); East Liverpool High School (math 22% / reading 42%, grade F, #607 of 781 statewide, top 78%, 536 students, 0% FRL) — zoned schools average 0% FRL vs 78% district-wide (78 pts lower); this property's tenant base skews higher-income than the district average.
- Market conditions: 115 active listings in the ZIP; 2 comparable units currently listed for rent nearby; 49 units permitted in Columbiana County in 2024 (0 in 5+ unit buildings).
Forward outlook
- Local home prices are declining (-3.0%/yr); year-one equity from $165 of loan paydown is wiped out by about $717 of value loss. Plan a longer hold.
- Columbiana County population projected at -23% by 2050 — secular population decline; favor cash flow + early exit over multi-decade hold.
- At projected returns (-3.0% appreciation + 3.0% rent growth), your $7k cash investment doubles in ~2 years — after that, you're playing with house money.
Negotiation context
- It's been on market 45 days — a 3% lower offer ($23k) is reasonable based on typical stale-listing flexibility.
- 3 sale attempts since 23y ago with the ask held roughly flat each time — persistent listings suggest the price (not the market) is what's stuck; bring a comps-based counter.
- Current owner paid $4k; list at $24k implies a 431% gain — meaningful room to come down on a strong offer.
Risks & watch-outs
- Watch-outs: flood insurance adds $56/mo; built in 1943 — expect roof / HVAC / electrical / plumbing capex.
- Climate carrying-cost: severe flood risk — expect insurance premiums to compound above CPI over the hold.
Questions for the listing agent
- It's been on market 45 days. Have you received any prior offers? Is the seller open to a 3% concession, seller financing, or rate buy-down credit?
- Built in 1943 — when were the roof, HVAC, electrical panel, plumbing, and water heater last replaced?
- What's the actual annual flood-insurance premium (NFIP or private), and is the property in a SFHA with mandatory coverage?
- Is there a deadline driving the sale (1031 exchange, divorce, estate, relocation)? That informs how much negotiation room exists.
- What's the average days-on-market for RENTAL listings here right now (not sales)? A rising rental-DOM trend means longer vacancies and softer asking-rent achievability than the comps imply.
- What's the recent tenant-quality profile in this submarket — average credit score on applications, eviction rate, late-payment / NSF rate, and stable-employment percentage? A property-management company in the area should have these aggregated.
- How much new for-sale + rental construction is in the pipeline within 1–3 miles? Heavy new supply typically softens prices + rents 12–24 months out; constrained supply supports both.
Investment metrics
- 1% rule
- 2.98% ✓
- Cap rate
- 26.27%
- Cash-on-cash
- 71.34%
- DSCR
- 4.17
- GRM
- 2.8
CMA / ARV
- ARV (median comp)
- $44,482
- List price
- $23,900
- Delta
- -46.27%
- Verdict
- UNDERPRICED
- Comps
- 20 within 1.0 mi
Show comp detail 8 sales within ~0.75 mi
| Address | Dist | Beds/Ba | Sqft | Sold | Price | $/sf | Match |
|---|---|---|---|---|---|---|---|
| 812 Chester St | 0.22mi | 2/1.0 (-1) | 960 (+3%) | 14mo | $56,000 | $58 | 67 |
| 1615 Montrose Ave | 0.59mi | 3/1.0 | 1,012 (+8%) | 2mo | $135,000 | $133 | 55 |
| 823 Saint Clair Ave | 0.33mi | 2/1.0 (-1) | 888 (-5%) | 23mo | $25,200 | $28 | 50 |
| 901 Mckinnon Ave | 0.69mi | 3/2.0 | 988 (+6%) | 8mo | $138,000 | $140 | 50 |
| 1187 Dodge St | 0.72mi | 3/1.0 | 960 (+3%) | 18mo | $75,500 | $79 | 45 |
| 484 Louella Ave | 0.60mi | 2/1.0 (-1) | 864 (-8%) | 11mo | $143,500 | $166 | 43 |
| 418 Phyllis | 0.58mi | 2/1.0 (-1) | 832 (-11%) | 8mo | $135,000 | $162 | 41 |
| 1216 Riverview St | 0.58mi | 2/1.0 (-1) | 858 (-8%) | 16mo | $71,000 | $83 | 39 |
Match score weights: distance 35% · size 25% · config 20% · recency 20%. Top-matched comps best support the ARV.
Projected returns pro-forma
-3.0% appreciation · 3.0% rent growth · sell at horizon
- IRR
- 60.3%
- Equity multiple
- 3.69×
- Total profit
- $17,973
- Equity at exit
- $3,564
- IRR
- 65.0%
- Equity multiple
- 7.56×
- Total profit
- $43,906
- Equity at exit
- $2,066
Cash invested: $6,692 (down + closing). Projections, not guarantees.
Landlord ↔ Tenant lean methodology
- Overall (STATE)
- 73 Landlord-Friendly
- State Ohio
- 73 Landlord-Friendly · R+6
- County
- — inherits STATE
- City
- — inherits STATE
ZIP-level market 43920
- Home prices YoY
- -29.3%
- Active inventory
- 115
- Price-to-rent
- 2.8×
Monthly cashflow live
- Estimated rent
- $712 medium interval (Pro) →
- Mortgage (P&I)
- −$125
- Tax from tax record
- −$30 /mo · $357/yr
- Insurance
- −$10
- Flood insurance flood zone
- −$56 /mo · $666/yr
- HOA
- −$0
- Vacancy / Maint / Mgmt
- −$150
- Net cashflow
- $342
Break-even live
Sensitivity live
| Price | -10% $356 | -5% $349 | +0% $342 | +5% $336 | +10% $329 |
|---|---|---|---|---|---|
| Rent | -10% $286 | -5% $314 | +0% $342 | +5% $370 | +10% $399 |
| Rate | -1.0pp $354 | -0.5pp $348 | base $342 | +0.5pp $336 | +1.0pp $330 |
UW: 25.0% down · 7.5% · 30yr · 1.5% tax · 5.0% vac · 8.0% maint · 8.0% mgmt
Financing live
Cash to close
- Down payment
- $5,975
- Closing costs
- $717
- Reserves months
- —
- Total cash needed
- —
Loan-product check · same deal, 3 products live
Conventional
25% down · 7.5% · 30yr
- Down + closing
- —
- Monthly P&I
- —
- Monthly cashflow
- —
- DSCR
- —
- Eligible?
- —
Personal DTI + credit; lowest rate.
DSCR
20% down · 8.5% · 30yr
- Down + closing
- —
- Monthly P&I
- —
- Monthly cashflow
- —
- DSCR
- —
- Eligible?
- —
No personal income docs; deal must DSCR.
Hard money
10% down · 12.0% · 12mo
- Down + closing
- —
- Monthly P&I
- —
- Monthly cashflow
- —
- DSCR
- —
- Eligible?
- —
Short-term bridge; refi at stabilization.
Rent comps 2 comps
| Address | Beds | Baths | Sqft | Rent | $/sqft | DOM | Units | Dist |
|---|---|---|---|---|---|---|---|---|
| 707 Saint Clair Ave Unit 06 East Liverpool, OH | 2.0 | 1.0 | 900 | $725 | $0.81 | 45d | 1 | 0.24mi |
| 707 Saint Clair Ave Unit 03 East Liverpool, OH | 2.0 | 1.0 | 900 | $700 | $0.78 | 45d | 1 | 0.24mi |
Listing history 18 events
-
2026-06-21days on market $23,900 Active 45 DOM
-
2026-06-18days on market $23,900 Active 42 DOM
-
2026-06-17days on market $23,900 Active 41 DOM
-
2026-06-16days on market $23,900 Active 40 DOM
-
2026-06-15days on market $23,900 Active 39 DOM
-
2026-06-13days on market $23,900 Active 37 DOM
-
2026-06-09days on market $23,900 Active 33 DOM
-
2026-06-08days on market $23,900 Active 32 DOM
-
2026-06-07days on market $23,900 Active 31 DOM
-
2026-06-03days on market $23,900 Active 27 DOM
-
2026-06-02days on market $23,900 Active 26 DOM
-
2026-06-01days on market $23,900 Active 25 DOM
-
2026-05-31days on market $23,900 Active 24 DOM
-
2026-05-06$23,900 Active 46-char remark
-
2012-01-25soldstatus $4,500 207-char remark
Show marketing remark (207 chars)
Tlhis is a 3 bedroom home that needs TLC. Has a lot of potential with hardwood floor in BEdrooms and Living room , with gas heat and central air. Plaster walls and a cement back porch. Call me for more info.
-
2008-11-08$7,000 207-char remark
Show marketing remark (207 chars)
Tlhis is a 3 bedroom home that needs TLC. Has a lot of potential with hardwood floor in BEdrooms and Living room , with gas heat and central air. Plaster walls and a cement back porch. Call me for more info.
-
2004-05-17soldstatus $30,000
Show marketing remark (187 chars)
Nice large rooms all newly painted. Back covered patio. Off street parking. 1 car integral garage. Separate entrance to master BR. Hardwood floors. Close to shopping and all on one floor.
-
2003-05-09$32,900
Show marketing remark (187 chars)
Nice large rooms all newly painted. Back covered patio. Off street parking. 1 car integral garage. Separate entrance to master BR. Hardwood floors. Close to shopping and all on one floor.
ⓘ Source: listings_history table (triggers on properties + properties_extension) + one-shot
backfill from property_details.listing_events for pre-trigger history.
Tax reassessment forecast OH · Partial reset (capped growth)
- Current annual tax
- $357 · $30/mo
- Projected year-2 tax
- $365 · $30/mo
- Expected delta
- +$8/yr (+$1/mo · 2.2%)
ⓘ Screening estimate from a state-policy table — verify with the county assessor before closing.
Climate risk First Street
- Flood 8/10 Severe FEMA zone X (unshaded) · 78% chance over 30 yrs
- Wildfire 1/10 Low
- Heat 4/10 Moderate 7 d/yr ≥97°F today · 19 d/yr by 30 yrs out
- Wind 1/10 Low
- Air quality 2/10 Low 1 unhealthy d/yr today · 2 by 30 yrs out
Nearby sold comps map
Loading sold comps map…
Walkable amenities ~0.75 mi
Loading nearby amenities…
Taxation est. · year 1
- Rental income
- $8,550
- − Mortgage interest
- −$1,339
- − Property taxes
- −$357
- − Insurance
- −$786
- − Repairs & maintenance
- −$684
- − Management
- −$684
- − Depreciation
- −$695
- Taxable income
- $4,005
- Est. tax owed @ 24.0%
- −$961
- After-tax cash flow
- $3,146/yr
For passive investors: Depreciation is non-cash, so a rental often shows a tax loss while cash-flowing — sheltering income. Rental losses are passive: they offset passive income freely, and up to $25,000/yr can offset ordinary (W-2) income if you actively participate and your MAGI is under $100k (phasing out to $0 by $150k); unused losses carry forward. On sale, claimed depreciation is recaptured at up to 25%, and gains may owe capital-gains tax (a 1031 exchange can defer both). Figures are a year-1 estimate at your 24.0% rate — not tax advice; consult a CPA.
Schools (NCES district)
- District
- East Liverpool City
- NCES district ID
- 3904391
- Math proficiency
- 28% ▼ -16.00%
- Reading proficiency
- 37% ▼ -10.00%
- Median HH income
- $34,021
- Composite
- 26.72/100
- National rank
- #7148
- State rank
- #571 of 656 in OH
Livability — East Liverpool
- Score
- 67/100
- State rank
- #613
- US rank
- #10580
Category grades
Schools grade is shown separately in the Schools card above.
Census & demographics
- Census place
- East Liverpool, OH
- County
- Columbiana · 99,532 people
- Population (ZIP)
- 21,124
- Household income
- $50,820
- Rent vs Own
- Severe rent burden
- 12.6
Population outlook (Columbiana County) Hauer SSP2
- Today (2025)
- 98,353 people
- By 2030
- 94,225 · -4.2%
- By 2040
- 85,169 · -13.4%
- By 2050
- 76,157 · -22.6%
- By 2075
- 58,451 · -40.6%
- By 2100
- 42,805 · -56.5%
Race, ethnicity, and origin ACS 2023
- Neighborhood character
- Predominantly White (90%)
- Race & ethnicity
- White 90% Two or more races 6% Black 3% Hispanic / Latino 1%
- Common ancestry
- Romanian 2% Slovak 2% Serbian 2%
- Foreign-born
- 0%
Political lean MEDSL · Columbiana
- 2024 margin
- Solid R (+49.0) · D 25.1% · R 74.1%
- 2008→2024 swing
- -41.4pp toward R · 2008: -7.6pp · 2024: -49.0pp
- All cycles
- 2024: R+49.0 2020: R+44.9 2016: R+41.6 2012: R+12.0 2008: R+7.6
Not yet ingested
- Civics
- —
Market trends
- HPI YoY
- ▼ -81.53%
- Current HPI
- 196.3908
- Rent YoY
- —
- Metro
- —
- State GDP YoY
- ▲ 1.98%
- F500 in state
- 48
Industry mix (Fortune 500 HQ in OH)
| Industry | F500 HQs | Revenue |
|---|---|---|
| Insurance | 3 | $145B |
|
||
| Industrial Machinery | 3 | $49B |
|
||
| Financial Services | 3 | $24B |
|
||
| Consumer Goods | 2 | $93B |
|
||
| Aerospace / Defense | 2 | $47B |
|
||
| Utilities | 2 | $33B |
|
||
Price history
-27.4% since first listed5 events — show timeline
- 2026-05-06 Listed $23,900 MLSNOW
- 2012-01-25 Sold (MLS) $4,500 MLSNOW
- 2008-11-08 Listed $7,000 MLSNOW
- 2004-05-17 Sold (MLS) $30,000 MLSNOW
- 2003-05-09 Listed $32,900 MLSNOW
Property tax history
+2.4%/yrLatest (2025): $357 · +8.9% YoY. Source: county tax records.
Cash-flow waterfall
monthlySold comps — $/sqft
last 12 mo · ≤1 miLoading sold comps…