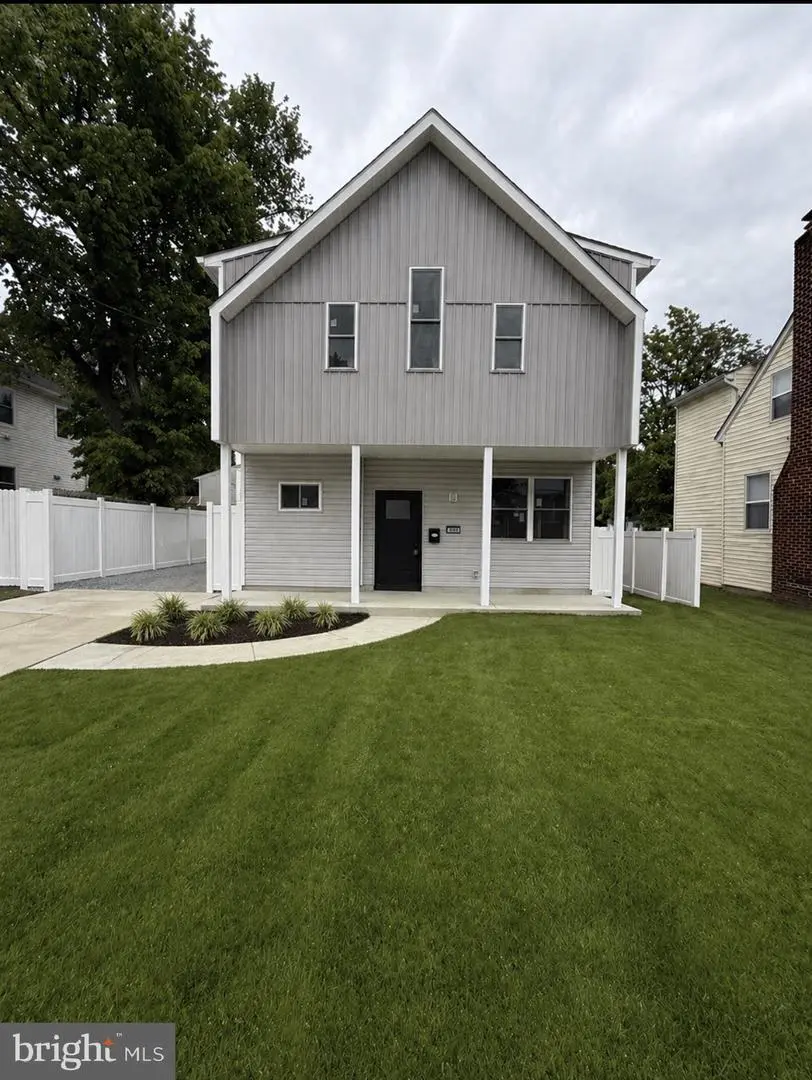
6224 Foote St · Seat Pleasant, MD
Flood risk 1/10 · Minimal
- FEMA flood zone
- X (unshaded)
- Chance of flooding over 30 yrs
- 0.0%
- Est. flood insurance / yr
- $507 – $1,088
Fire risk 1/10 · Minimal
- Est. fire insurance / yr
- $755 – $1,403
Heat risk 8/10 · Major
- Hot days now (above 103°F)
- 7 days/yr
- Hot days in 30 yrs
- 15 days/yr
Wind risk 4/10 · Minor
- Chance of severe wind over 30 yrs
- 20.0%
Air-quality risk 4/10 · Minor
- Unhealthy air days now
- 4 days/yr
- Unhealthy air days in 30 yrs
- 5 days/yr
Risk factors via First Street. Map © Google.
Why this score? — see what drove the D- grade
The composite is a weighted blend of 9 inputs, each scored 0–100. Each bar is that input's sub-score; the figure is the points it added to the 100-point composite (weight × sub-score).
- ARV discount +11.6/15.0
- Cash flow +9.6/30.0
- Rent growth +4.0/5.0
- Livability +3.2/5.0
- 1% rule +2.9/10.0
- DSCR +2.7/10.0
- Condition / age +2.5/5.0
- Schools +1.7/10.0
- Appreciation +0.0/10.0
$390,000
🖨 Deal sheet 📄 Offer letter ✓ Due diligence
Listing remarks
Welcome to this beautiful move-in-ready home perfectly positioned for convenience and comfort. Thoughtfully priced to provide exceptional value, this home presents a rare opportunity for buyers seeking quality, space, and modern updates without compromising affordability. Boasting three generously sized bedrooms, an office, huge den, and three full baths, every detail has been thoughtfully updated. The heart of the home features a spacious kitchen with an oversized island ideal for hosting, cooking, and everyday living. Step outside to a huge backyard and extended driveway, offering plenty of space for entertaining and relaxation just in time for summer fun. Ideally located, this home offer
Key facts
- 6,250 sq ft lot
- 3 parking spots
- Built 2026
Property features AI
Finance
- Other: Irrigation water rights; Above-grade finished area approximately 2,350 sq. ft. (estimated)
Exterior
- Parking: Driveway parking (3 spaces); Total of 3 garage/parking spaces
- Utilities: Public water; Public sewer; Electric service available
- Home design: Detached property; Construction completed; Excellent condition; Fee simple ownership
- Construction: Vinyl siding; Asphalt roof; Slab foundation; Building winterized; Pets allowed with no pet restrictions
- Exterior features: Extensive hardscape; Vinyl fencing; Not in a federal flood zone
Interior
- Kitchen: Dishwasher; Disposal; Microwave; Refrigerator; Range/oven (electric); Range hood; Stainless steel appliances; Exhaust fan
- Bedrooms: Three bedrooms on the upper level
- Bathrooms: Three full bathrooms total (two full baths on the upper level, one full bath on the main level)
- Heating & cooling: Forced air heating (electric); Central air conditioning (electric)
- Interior features: 9'+ and vaulted ceilings; Drywall walls and ceilings; Estimated living area; Family room; Den; No basement
- Laundry & utility: Washer/dryer hookups; Electric water heater
Neighborhood map
What this means for you Summary
Snapshot
- This is a 3-bed/3.0-bath single-family listed at $390k.
Deal economics
- At list price, monthly cash flow is $-264 ($-3k/yr) — negative.
- To cash-flow at today's rent, offer at most $352k (9.8% below list).
- To meet the 1% rule (rent ≥ 1% of price), the offer needs to be $308k (21.1% below list).
- Recommended offer: $308k (21.1% below list) — sets the bar for 1% rule.
Location & tenants
- Location reads 63/100 on livability (#301 in MD) — a middle-class / working-renter tenant base. Strengths: commute A+, housing A+, health & safety B+; Watch: schools F, crime F, amenities F.
- Prince George'S County Public Schools (suburban): math 8% / reading 24% proficiency, ranked #21 of 24 in MD (top 88%) — low school quality limits family demand, transient renter base, plan for 1-2y turnover.
- Market conditions: Rents rising fast (+5.9%/yr); 217 active listings in the ZIP; 16 comparable units currently listed for rent nearby; rentals at typical pace (median 24d on market — plan ~3-4 weeks tenant-placement turnaround); solid renter incomes; 1,481 units permitted in Prince George's County in 2024 (0 in 5+ unit buildings).
- At $3,078/mo this rent would consume 48% of the median local household income ($76k/yr) (locally 1418% of renters already pay >50% of income on rent) — very limited rent-growth headroom before tenants either downsize or default.
Forward outlook
- Local home prices are declining (-3.0%/yr); year-one equity from $3k of loan paydown is wiped out by about $12k of value loss. Plan a longer hold.
- Prince George's County population projected at +18% by 2050 — long-run rental-demand tailwind backs the buy-and-hold thesis.
Negotiation context
- Only 1 days on market — expect competitive offers; lowballing is unlikely to land.
- 9 sale attempts since 27y ago with the ask held roughly flat each time — persistent listings suggest the price (not the market) is what's stuck; bring a comps-based counter.
- Current owner paid $260k; list at $390k implies a 50% gain — meaningful room to come down on a strong offer.
Risks & watch-outs
- Climate carrying-cost: extreme-heat days projected 7→15/yr by 2055 (HVAC capex compounding) — expect insurance premiums to compound above CPI over the hold.
Questions for the listing agent
- What do current leases actually rent for vs. the listed asking? Can we see a recent rent roll and the last 12 months of T-12 income?
- Is there a deadline driving the sale (1031 exchange, divorce, estate, relocation)? That informs how much negotiation room exists.
- Schools are F-rated, which usually means shorter tenancies and higher turnover. Who's the typical renter profile here, and what's been the actual vacancy rate?
- Crime grade is F in this area — have there been break-ins, vandalism, or insurance claims at this property in the last 3 years? What carrier currently insures it and at what premium?
- The area grade is low — what's the realistic commute time and amenity access for the typical tenant pool here? Any planned neighborhood developments (good or bad) we should know about?
- What's the average days-on-market for RENTAL listings here right now (not sales)? A rising rental-DOM trend means longer vacancies and softer asking-rent achievability than the comps imply.
- What's the recent tenant-quality profile in this submarket — average credit score on applications, eviction rate, late-payment / NSF rate, and stable-employment percentage? A property-management company in the area should have these aggregated.
- How much new for-sale + rental construction is in the pipeline within 1–3 miles? Heavy new supply typically softens prices + rents 12–24 months out; constrained supply supports both.
Investment metrics
- 1% rule
- 0.79% ✗
- Cap rate
- 5.48%
- Cash-on-cash
- -2.90%
- DSCR
- 0.87
- GRM
- 10.6
CMA / ARV
- ARV (median comp)
- $429,163
- List price
- $390,000
- Delta
- -9.13%
- Verdict
- FAIR
- Comps
- 20 within 1.0 mi
Show comp detail 12 sales within ~0.75 mi
| Address | Dist | Beds/Ba | Sqft | Sold | Price | $/sf | Match |
|---|---|---|---|---|---|---|---|
| 217 Maryland Park Dr | 0.32mi | 3/2.0 | 2,292 (-2%) | 5mo | $256,000 | $112 | 73 |
| 6109 J St | 0.36mi | 3/3.5 | 2,442 (+4%) | 9mo | $439,000 | $180 | 67 |
| 505 62nd Ave | 0.10mi | 4/3.0 (+1) | 2,055 (-13%) | 10mo | $420,000 | $204 | 62 |
| 6213 Foote St | 0.05mi | 3/2.0 | 2,018 (-14%) | 21mo | $415,000 | $206 | 53 |
| 1007 59th Ave | 0.50mi | 4/3.0 (+1) | 2,236 (-5%) | 17mo | $465,000 | $208 | 49 |
| 401 56th St NE | 0.53mi | 4/2.5 (+1) | 2,268 (-4%) | 20mo | $590,000 | $260 | 46 |
| 516 67th Pl | 0.19mi | 4/3.0 (+1) | 2,000 (-15%) | 21mo | $490,000 | $245 | 44 |
| 5823 Field Pl NE | 0.33mi | 4/3.5 (+1) | 2,700 (+15%) | 11mo | $519,000 | $192 | 43 |
| 5617 Coolidge St | 0.57mi | 4/3.0 (+1) | 2,016 (-14%) | 6mo | $400,000 | $198 | 40 |
| 809 55th St NE | 0.62mi | 3/3.0 | 2,038 (-13%) | 14mo | $430,000 | $211 | 37 |
| 6109 Addison Rd | 0.61mi | 4/3.5 (+1) | 2,081 (-11%) | 17mo | $415,000 | $199 | 32 |
| 831 Eastern Ave | 0.60mi | 3/2.5 | 2,000 (-15%) | 21mo | $368,500 | $184 | 28 |
Match score weights: distance 35% · size 25% · config 20% · recency 20%. Top-matched comps best support the ARV.
Projected returns pro-forma
-3.0% appreciation · 5.9% rent growth · sell at horizon
- IRR
- -17.9%
- Equity multiple
- 0.35×
- Total profit
- $-70,698
- Equity at exit
- $58,150
- IRR
- -5.3%
- Equity multiple
- 0.61×
- Total profit
- $-42,742
- Equity at exit
- $33,720
Cash invested: $109,200 (down + closing). Projections, not guarantees.
Landlord ↔ Tenant lean methodology
- Overall (STATE)
- 27 Tenant-Leaning
- State Maryland
- 27 Tenant-Leaning · D+14
- County
- — inherits STATE
- City
- — inherits STATE
ZIP-level market 20743
- Rents YoY
- 5.9%
- Active inventory
- 217
- Price-to-rent
- 10.6×
Monthly cashflow live
- Estimated rent
- $3,078 high interval (Pro) →
- Mortgage (P&I)
- −$2,045
- Tax est. 1.5%
- −$488 /mo · $5,850/yr
- Insurance
- −$162
- HOA
- −$0
- Vacancy / Maint / Mgmt
- −$646
- Net cashflow
- $-264
Break-even live
UW: 25.0% down · 7.5% · 30yr · 1.5% tax · 5.0% vac · 8.0% maint · 8.0% mgmt
Financing live
Cash to close
- Down payment
- $97,500
- Closing costs
- $11,700
- Reserves months
- —
- Total cash needed
- —
Loan-product check · same deal, 3 products live
Conventional
25% down · 7.5% · 30yr
- Down + closing
- —
- Monthly P&I
- —
- Monthly cashflow
- —
- DSCR
- —
- Eligible?
- —
Personal DTI + credit; lowest rate.
DSCR
20% down · 8.5% · 30yr
- Down + closing
- —
- Monthly P&I
- —
- Monthly cashflow
- —
- DSCR
- —
- Eligible?
- —
No personal income docs; deal must DSCR.
Hard money
10% down · 12.0% · 12mo
- Down + closing
- —
- Monthly P&I
- —
- Monthly cashflow
- —
- DSCR
- —
- Eligible?
- —
Short-term bridge; refi at stabilization.
Rent comps 16 comps
| Address | Beds | Baths | Sqft | Rent | $/sqft | DOM | Units | Dist |
|---|---|---|---|---|---|---|---|---|
| 6313 Field St Capitol Heights, MD | 3.0 | 2.0 | 1700 | $2,250 | $1.32 | 18d | 1 | 0.11mi |
| 431 61st St NE Washington, DC | 3.0 | 2.5 | 2151 | $4,500 | $2.09 | 24d | 1 | 0.13mi |
| 522 70th St Capitol Heights, MD | 4.0 | 1.5 | 1840 | $3,000 | $1.63 | 2d | 1 | 0.38mi |
| 522 70th St Capitol Heights, MD | 4.0 | 1.5 | 1820 | $3,000 | $1.65 | 43d | 1 | 0.38mi |
| 5501 Jay St NE Washington, DC | 4.0 | 3.0 | 1848 | $3,300 | $1.79 | 24d | 1 | 0.61mi |
| 113 56th St SE Washington, DC | 3.0 | 2.0 | 1764 | $3,000 | $1.70 | 11d | 1 | 0.82mi |
| 5032 E Capitol St NE Washington, DC | 2.0 | 3.5 | 1775 | $2,950 | $1.66 | 12d | 1 | 1.03mi |
| 4802 Leroy Gorham Dr Capitol Heights, MD | 4.0 | 3.5 | 2000 | $3,250 | $1.62 | 18d | 1 | 1.05mi |
| 6137 Hanlon St Capitol Heights, MD | 3.0 | 2.5 | 2280 | $3,162 | $1.39 | 5d | 1 | 1.09mi |
| 5020 Astor Pl SE Apt 3 Washington, DC | 2.0 | 1.0 | 1600 | $2,250 | $1.41 | 24d | 1 | 1.16mi |
| 5115 Bass Pl SE Washington, DC | 3.0 | 2.5 | 2832 | $2,900 | $1.02 | 24d | 1 | 1.16mi |
| 5115 Bass Pl SE Washington, DC | 3.0 | 2.5 | 2000 | $2,950 | $1.48 | 19d | 1 | 1.16mi |
| 5126 Call Pl SE Washington, DC | 2.0 | 1.5 | 1741 | $3,050 | $1.75 | 24d | 1 | 1.20mi |
| 6308 Santo Pl Capitol Heights, MD | 3.0 | 2.5 | 2000 | $2,900 | $1.45 | 5d | 1 | 1.32mi |
| 6308 Santo Pl Capitol Heights, MD | 3.0 | 2.5 | 2000 | $2,900 | $1.45 | 43d | 1 | 1.32mi |
| 5404 Vergo Rd Capitol Heights, MD | 4.0 | 2.5 | 1680 | $3,500 | $2.08 | 43d | 1 | 1.44mi |
Listing history 33 events
-
2026-05-07status Pending 1172-char remark
-
2026-05-06$390,000 Active 1172-char remark
-
2026-04-30historical $390,000 1172-char remark
-
2014-02-28historical Expired
-
2014-02-28historical
-
2013-05-21price
-
2013-04-24status Contract
-
2013-03-21historical Contingent (Kick Out)
-
2012-09-20status Contract
-
2012-08-30status Active
-
2012-08-29status Contract
-
2012-08-27status Active
-
2012-06-22status Contract
-
2012-04-23price
-
2012-03-19Active
-
2012-03-19$63,000
-
2007-06-20soldstatus $260,000
-
2007-06-17soldstatus $260,000
-
2007-04-28historical
-
2007-04-21$260,000
-
2002-04-10soldstatus $125,000
-
2001-01-17soldstatus $31,000
-
2001-01-05soldstatus $31,000
-
2000-12-24historical
-
2000-10-30historical
-
2000-10-13$53,000
-
2000-09-08
-
1999-09-30soldstatus $47,500
-
1999-09-30soldstatus $95,000
-
1999-08-13soldstatus $47,500
-
1999-07-25historical
-
1999-03-26$50,000
-
1965-01-04soldstatus $9,000
ⓘ Source: listings_history table (triggers on properties + properties_extension) + one-shot
backfill from property_details.listing_events for pre-trigger history.
Climate risk First Street
- Flood 1/10 Low FEMA zone X (unshaded) · 0% chance over 30 yrs
- Wildfire 1/10 Low
- Heat 8/10 Severe 7 d/yr ≥103°F today · 15 d/yr by 30 yrs out
- Wind 4/10 Moderate 20% chance of damaging wind over 30 yrs
- Air quality 4/10 Moderate 4 unhealthy d/yr today · 5 by 30 yrs out
Nearby sold comps map
Loading sold comps map…
Walkable amenities ~0.75 mi
Loading nearby amenities…
Taxation est. · year 1
- Rental income
- $36,936
- − Mortgage interest
- −$21,846
- − Property taxes
- −$5,850
- − Insurance
- −$1,950
- − Repairs & maintenance
- −$2,955
- − Management
- −$2,955
- − Depreciation
- −$11,345
- Taxable loss
- −$9,965
- Est. tax savings @ 24.0%
- +$2,392
- After-tax cash flow
- $-771/yr
For passive investors: Depreciation is non-cash, so a rental often shows a tax loss while cash-flowing — sheltering income. Rental losses are passive: they offset passive income freely, and up to $25,000/yr can offset ordinary (W-2) income if you actively participate and your MAGI is under $100k (phasing out to $0 by $150k); unused losses carry forward. On sale, claimed depreciation is recaptured at up to 25%, and gains may owe capital-gains tax (a 1031 exchange can defer both). Figures are a year-1 estimate at your 24.0% rate — not tax advice; consult a CPA.
Schools (NCES district)
- District
- Prince George'S County Public Schools
- NCES district ID
- 2400510
- Math proficiency
- 8% ▼ -11.00%
- Reading proficiency
- 24% ▼ -9.00%
- Median HH income
- $73,967
- Composite
- 16.82/100
- National rank
- #9151
- State rank
- #21 of 24 in MD
Livability — Seat Pleasant
- Score
- 63/100
- State rank
- #301
- US rank
- #15765
Category grades
Schools grade is shown separately in the Schools card above.
Census & demographics
- Census place
- Seat Pleasant, MD
- County
- Prince Georges County · 919,866 people
- Metro
- Washington-Arlington-Alexandria, DC-VA-MD-WV
- Population (ZIP)
- 41,093
- Household income
- $76,466
- Rent vs Own
- Severe rent burden
- 1418.0
Population outlook (Prince George's County) Hauer SSP2
- Today (2025)
- 1,005,426 people
- By 2030
- 1,048,416 · +4.3%
- By 2040
- 1,123,425 · +11.7%
- By 2050
- 1,183,220 · +17.7%
- By 2075
- 1,306,202 · +29.9%
- By 2100
- 1,408,179 · +40.1%
Race, ethnicity, and origin ACS 2023
- Neighborhood character
- Predominantly Black (78%)
- Race & ethnicity
- Black 78% Hispanic / Latino 16% Two or more races 4% White 3% Asian 1%
- Hispanic origin (detail)
- Mexican 2% Puerto Rican 2%
- Foreign-born
- 16% · Canada
- Languages at home
- 81% English-only · Spanish 13% French/Haitian/Cajun 1%
Political lean MEDSL · Prince George's
- 2024 margin
- Solid D (+75.2) · D 86.3% · R 11.2% · Other 2.5%
- 2008→2024 swing
- -3.3pp toward R · 2008: 78.5pp · 2024: 75.2pp
- All cycles
- 2024: D+75.2 2020: D+80.5 2016: D+81.0 2012: D+80.9 2008: D+78.5
Not yet ingested
- Civics
- —
Market trends
- HPI YoY
- ▼ -311.97%
- Current HPI
- 335.5152
- Rent YoY
- ▲ 5.90%
- Metro
- Washington-Arlington-Alexandria, DC-VA-MD-WV
- State GDP YoY
- ▲ 2.97%
- F500 in state
- 12
Industry mix (Fortune 500 HQ in MD)
| Industry | F500 HQs | Revenue |
|---|---|---|
| Aerospace / Defense | 1 | $71B |
|
||
| Utilities | 1 | $25B |
|
||
| Hotels | 1 | $24B |
|
||
| Consumer Goods | 1 | $7B |
|
||
| Real Estate | 1 | $6B |
|
||
| Chemicals | 1 | $2B |
|
||
Price history
+4233.3% since first listed33 events — show timeline
- 2026-05-07 Pending — BRIGHT MLS
- 2026-05-06 Listed $390,000 BRIGHT MLS
- 2026-04-30 Coming Soon $390,000 BRIGHT MLS
- 2014-02-28 Delisted — MRIS
- 2014-02-28 Listing Removed — BRIGHT MLS
- 2013-05-21 Price Changed — MRIS
- 2013-04-24 Pending — MRIS
- 2013-03-21 Contingent — MRIS
- 2012-09-20 Pending — MRIS
- 2012-08-30 Relisted — MRIS
- 2012-08-29 Pending — MRIS
- 2012-08-27 Relisted — MRIS
- 2012-06-22 Pending — MRIS
- 2012-04-23 Price Changed — MRIS
- 2012-03-19 Listed — MRIS
- 2012-03-19 Listed $63,000 BRIGHT MLS
- 2007-06-20 Sold (Public Records) $260,000 Public Records
- 2007-06-17 Sold (MLS) $260,000 MRIS
- 2007-04-28 Delisted — MRIS
- 2007-04-21 Listed $260,000 MRIS
- 2002-04-10 Sold (Public Records) $125,000 Public Records
- 2001-01-17 Sold (Public Records) $31,000 Public Records
- 2001-01-05 Sold (MLS) $31,000 MRIS
- 2000-12-24 Delisted — MRIS
- 2000-10-30 Delisted — MRIS
- 2000-10-13 Listed $53,000 MRIS
- 2000-09-08 Listed — MRIS
- 1999-09-30 Sold (Public Records) $95,000 Public Records
- 1999-09-30 Sold (Public Records) $47,500 Public Records
- 1999-08-13 Sold (MLS) $47,500 MRIS
- 1999-07-25 Delisted — MRIS
- 1999-03-26 Listed $50,000 MRIS
- 1965-01-04 Sold (Public Records) $9,000 Public Records
Property tax history
-33.9%/yrLatest (2019): $34 · -1.2% YoY. Source: county tax records.
Cash-flow waterfall
monthlySold comps — $/sqft
last 12 mo · ≤1 miLoading sold comps…