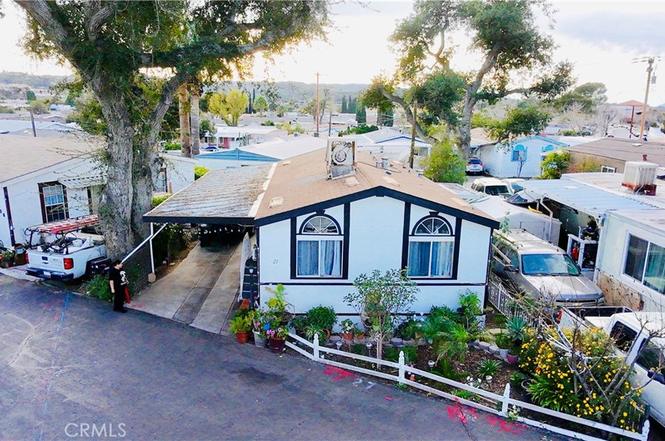
18540 Soledad Canyon Rd #27 · Santa Clarita, CA
Flood risk 4/10 · Minor
- FEMA flood zone
- X (shaded)
- Chance of flooding over 30 yrs
- 0.33%
- Est. flood insurance / yr
- $507 – $1,088
Fire risk 8/10 · Major
- Est. fire insurance / yr
- $659 – $1,223
Heat risk 7/10 · Major
- Hot days now (above 98°F)
- 7 days/yr
- Hot days in 30 yrs
- 20 days/yr
Wind risk 1/10 · Minimal
- Chance of severe wind over 30 yrs
- —
Air-quality risk 6/10 · Moderate
- Unhealthy air days now
- 9 days/yr
- Unhealthy air days in 30 yrs
- 13 days/yr
Risk factors via First Street. Map © Google.
Why this score? — see what drove the B grade
The composite is a weighted blend of 9 inputs, each scored 0–100. Each bar is that input's sub-score; the figure is the points it added to the 100-point composite (weight × sub-score).
- Cash flow +30.0/30.0
- 1% rule +10.0/10.0
- DSCR +10.0/10.0
- ARV discount +9.3/15.0
- Schools +5.9/10.0
- Livability +3.5/5.0
- Rent growth +2.9/5.0
- Condition / age +2.5/5.0
- Appreciation +0.0/10.0
$137,499
🖨 Deal sheet 📄 Offer letter ✓ Due diligence
Listing remarks
Welcome to this charming 2 bedroom, 2 bath mobile home located in the desirable Granada Villa Mobile Home Park Estates in Canyon Country.
Key facts
- 2 garage spots
- Community pool
- Built 1999
Property features AI
Finance
- Other: Located in Granada Villa Mobile Home Park
- Financial info: Monthly land lease amount: $1,685; Manager approval required for residency
- HOA & community: Land lease in place
Exterior
- Parking: 2 parking spaces; 2-car garage
- Utilities: Private water; Private sewer
- Home design: Mobile home (model 8522L); Double body type; 1 story; Mobile home remains on site; Mobile dimensions approximately 10 ft by 40 ft
- Construction: Year built per public records
- Exterior features: Community pool; Dog park and neighborhood park
Interior
- Bathrooms: 2 full bathrooms
- Interior features: Front entry; Single-level home
- Laundry & utility: Laundry inside the home
Neighborhood map
What this means for you Summary
Snapshot
- This is a 2-bed/2.0-bath manufactured listed at $137k.
Deal economics
- At list price, monthly cash flow is $1k ($16k/yr) — positive.
- The deal already cash-flows at list — no discount required.
- Meets the 1% rule at list price ($3k rent vs $137k).
- Recommended offer: $121k (12.0% below list) — sets the bar for market timing.
- Cap rate 18.0% vs local median 2.8% in Santa Clarita — top-decile yield for the area; either an underpriced asset or a hidden risk that comps aren't pricing in. Stress-test before assuming the spread holds.
Location & tenants
- Location reads 70/100 on livability (#229 in CA) — a middle-class / working-renter tenant base. Strengths: employment A+, housing A, crime A-; Watch: amenities D+, cost of living F, health & safety F.
- William S. Hart Union High (suburban): math 52% / reading 72% proficiency, ranked #155 of 1,400 in CA (top 11%) — acceptable for families but not a draw, mixed tenant base, ~2y average lease; only 18% free/reduced lunch — higher-income household profile.
- Market conditions: Rents rising (+1.7%/yr); 106 active listings in the ZIP; 28 comparable units currently listed for rent nearby; rentals leasing fast (median 1d on market — plan ~1-2 weeks tenant-placement turnaround); high-income renter base; 19,697 units permitted in Los Angeles County in 2024 (9,426 in 5+ unit buildings).
Forward outlook
- Local home prices are declining (-3.0%/yr); year-one equity from $950 of loan paydown is wiped out by about $4k of value loss. Plan a longer hold.
- Los Angeles County population projected at +9% by 2050 — modest demand growth; plan on rents tracking national, not racing it.
- At projected returns (-3.0% appreciation + 1.7% rent growth), your $38k cash investment doubles in ~3 years — after that, you're playing with house money.
Negotiation context
- It's been on market 144 days — a 12% lower offer ($121k) is reasonable based on typical stale-listing flexibility.
- 2 sale attempts since 12y ago; this cycle's ask has dropped $33k (19%) from the opening price — seller is motivated, your offer sets the floor, not the list.
Risks & watch-outs
- Climate carrying-cost: severe wildfire risk; extreme-heat days projected 7→20/yr by 2055 (HVAC capex compounding) — expect insurance premiums to compound above CPI over the hold.
Questions for the listing agent
- It's been on market 144 days. Have you received any prior offers? Is the seller open to a 12% concession, seller financing, or rate buy-down credit?
- Why hasn't it sold? Are there any deal-killer items the seller is aware of (foundation, flood, title, zoning, code violations)?
- Is there a deadline driving the sale (1031 exchange, divorce, estate, relocation)? That informs how much negotiation room exists.
- Schools are B-rated — typically a magnet for longer-tenancy family renters. What's the average tenant stay here, and is there a school-zone premium baked into asking?
- What's the average days-on-market for RENTAL listings here right now (not sales)? A rising rental-DOM trend means longer vacancies and softer asking-rent achievability than the comps imply.
- What's the recent tenant-quality profile in this submarket — average credit score on applications, eviction rate, late-payment / NSF rate, and stable-employment percentage? A property-management company in the area should have these aggregated.
- How much new for-sale + rental construction is in the pipeline within 1–3 miles? Heavy new supply typically softens prices + rents 12–24 months out; constrained supply supports both.
Investment metrics
- 1% rule
- 1.98% ✓
- Cap rate
- 18.02%
- Cash-on-cash
- 41.88%
- DSCR
- 2.86
- GRM
- 4.2
CMA / ARV
- ARV (on-the-fly)
- $143,200
- Comps found
- 9
Show comp detail 9 sales within ~0.75 mi
| Address | Dist | Beds/Ba | Sqft | Sold | Price | $/sf | Match |
|---|---|---|---|---|---|---|---|
| 18323 Soledad Canyon Rd #36 | 0.38mi | 2/2.0 | 800 (0%) | 13mo | $150,000 | $188 | 71 |
| 18540 Soledad Canyon Rd Spc 17 | 0.08mi | 3/1.0 (+1) | 720 (-10%) | 11mo | $84,990 | $118 | 62 |
| 18145 Soledad Canyon Rd #12 | 0.54mi | 2/1.0 | 850 (+6%) | 6mo | $180,000 | $212 | 55 |
| 18035 Soledad Canyon Rd #8 | 0.63mi | 2/2.0 | 800 (0%) | 24mo | $180,000 | $225 | 51 |
| 18145 SOLEDAD CANYON Rd #54 | 0.56mi | 2/2.0 | 881 (+10%) | 11mo | $100,000 | $114 | 47 |
| 18035 Soledad Canyon Rd #45 | 0.63mi | 3/1.0 (+1) | 878 (+10%) | 4mo | $134,500 | $153 | 42 |
| 18204 Soledad Canyon Rd #53 | 0.47mi | 2/1.0 | 720 (-10%) | 22mo | $128,900 | $179 | 40 |
| 18035 Soledad Canyon Rd #49 | 0.63mi | 3/2.0 (+1) | 720 (-10%) | 12mo | $113,000 | $157 | 39 |
| 18035 Soledad Canyon Rd #81 | 0.63mi | 2/2.0 | 900 (+12%) | 13mo | $203,900 | $227 | 39 |
Match score weights: distance 35% · size 25% · config 20% · recency 20%. Top-matched comps best support the ARV.
Projected returns pro-forma
-3.0% appreciation · 1.7% rent growth · sell at horizon
- IRR
- 37.1%
- Equity multiple
- 2.55×
- Total profit
- $59,731
- Equity at exit
- $20,502
- IRR
- 43.1%
- Equity multiple
- 4.84×
- Total profit
- $147,968
- Equity at exit
- $11,888
Cash invested: $38,500 (down + closing). Projections, not guarantees.
Landlord ↔ Tenant lean methodology
- Overall (STATE)
- 18 Strongly Tenant-Friendly
- State California
- 18 Strongly Tenant-Friendly · D+13
- County
- — inherits STATE
- City
- — inherits STATE
ZIP-level market 91351
- Rents YoY
- 1.7%
- Active inventory
- 106
- Price-to-rent
- 4.2×
Monthly cashflow live
- Estimated rent
- $2,719 high interval (Pro) →
- Mortgage (P&I)
- −$721
- Tax from tax record
- −$26 /mo · $312/yr
- Insurance
- −$57
- HOA
- −$0
- Vacancy / Maint / Mgmt
- −$571
- Net cashflow
- $1,344
Break-even live
UW: 25.0% down · 7.5% · 30yr · 1.5% tax · 5.0% vac · 8.0% maint · 8.0% mgmt
Financing live
Cash to close
- Down payment
- $34,375
- Closing costs
- $4,125
- Reserves months
- —
- Total cash needed
- —
Loan-product check · same deal, 3 products live
Conventional
25% down · 7.5% · 30yr
- Down + closing
- —
- Monthly P&I
- —
- Monthly cashflow
- —
- DSCR
- —
- Eligible?
- —
Personal DTI + credit; lowest rate.
DSCR
20% down · 8.5% · 30yr
- Down + closing
- —
- Monthly P&I
- —
- Monthly cashflow
- —
- DSCR
- —
- Eligible?
- —
No personal income docs; deal must DSCR.
Hard money
10% down · 12.0% · 12mo
- Down + closing
- —
- Monthly P&I
- —
- Monthly cashflow
- —
- DSCR
- —
- Eligible?
- —
Short-term bridge; refi at stabilization.
Rent comps 28 comps
| Address | Beds | Baths | Sqft | Rent | $/sqft | DOM | Units | Dist |
|---|---|---|---|---|---|---|---|---|
| 27520 Sierra Hwy Canyon Country, CA | 1.0–3.0 | 1.0–2.0 | 965 | $2,502 | $2.59 | 1d | 1 | 0.15mi |
| 18804 Mandan St #807 Canyon Country, CA | 2.0 | 2.0 | 860 | $2,600 | $3.02 | 1d | 1 | 0.32mi |
| 27240 Luther Dr #509 Canyon Country, CA | 1.0 | 1.0 | 652 | $1,995 | $3.06 | 1d | 1 | 0.36mi |
| Jakes Way Santa Clarita, CA | 1.0–2.0 | 1.0–2.0 | 830 | $2,640 | $3.18 | 1d | 20 | 0.41mi |
| 18005 Annes Cir Canyon Country, CA | 1.0–3.0 | 1.0–2.5 | 979 | $2,954 | $3.02 | 1d | 10 | 0.45mi |
| 18209 Sierra Hwy #17 Canyon Country, CA | 2.0 | 2.0 | 795 | $2,500 | $3.14 | 10d | 1 | 0.48mi |
| 18209 Sierra Hwy #40 Canyon Country, CA | 2.0 | 2.0 | 795 | $2,350 | $2.96 | 1d | 1 | 0.48mi |
| 27940 Solamint Rd Canyon Country, CA | 1.0–2.0 | 1.0–2.0 | 859 | $3,974 | $4.62 | 1d | 5 | 0.49mi |
| 27070 Hidaway Ave #4 Canyon Country, CA | 2.0 | 1.5 | 1078 | $3,200 | $2.97 | 2d | 1 | 0.57mi |
| 18008 Saratoga Way #513 Canyon Country, CA | 1.0 | 1.0 | 934 | $1,050 | $1.12 | 1d | 1 | 0.59mi |
| 27303 Sara St Canyon Country, CA | 1.0–3.0 | 1.0–2.0 | 838 | $2,402 | $2.86 | 1d | 6 | 0.60mi |
| 18028 Saratoga Way #557 Canyon Country, CA | 2.0 | 2.0 | 843 | $2,900 | $3.44 | 1d | 1 | 0.60mi |
| 18211 Flynn Dr #144 Canyon Country, CA | 2.0 | 2.0 | 1085 | $2,700 | $2.49 | 1d | 1 | 0.63mi |
| 27105 Silver Oak Ln Canyon Country, CA | 1.0–3.0 | 1.0–2.0 | 1021 | $3,070 | $3.01 | 1d | 25 | 0.64mi |
| 18046 Beneda Ln Unit B203 Santa Clarita, CA | 1.0 | 1.0 | 756 | $1,900 | $2.51 | 10d | 1 | 0.65mi |
| 27944 Tyler Ln #448 Canyon Country, CA | 2.0 | 2.0 | 848 | $2,295 | $2.71 | 1d | 1 | 0.65mi |
| 27077 Hidaway Ave Canyon Country, CA | 2.0 | 1.0 | 960 | $2,400 | $2.50 | 1d | 1 | 0.68mi |
| 28015 Sarabande Ln Santa Clarita, CA | 2.0 | 2.0 | 885 | $2,850 | $3.22 | 1d | 1 | 0.72mi |
| 19028 Drycliff St Unit C Canyon Country, CA | 3.0 | 1.5 | 982 | $3,600 | $3.67 | 2d | 1 | 0.74mi |
| 17621 Pauline Ct Canyon Country, CA | 2.0–3.0 | 2.5 | 1200 | $2,539 | $2.12 | 1d | 8 | 0.86mi |
| 17947 Lost Canyon Rd Canyon Country, CA | 2.0 | 2.0 | 1022 | $2,795 | $2.73 | 17d | 1 | 0.89mi |
| 27301 Whites Canyon Rd Canyon Country, CA | 2.0 | 2.0 | 900 | $1,995 | $2.22 | 17d | 2 | 0.89mi |
| 17740 Scherzinger Ln Canyon Country, CA | 2.0 | 2.0 | 825 | $2,150 | $2.61 | 1d | 2 | 1.07mi |
| 17350 Humphreys Pkwy Canyon Country, CA | 1.0–3.0 | 1.0–2.0 | 1009 | $3,248 | $3.22 | 1d | 65 | 1.09mi |
| 26752 Winsome Cir Newhall, CA | 2.0 | 2.0 | 1120 | $2,950 | $2.63 | 1d | 1 | 1.11mi |
| 28085 Whites Canyon Rd Canyon Country, CA | 1.0–2.0 | 1.0–2.0 | 714 | $2,100 | $2.94 | 1d | 7 | 1.26mi |
| 17581 Scherzinger Ln Canyon Country, CA | 2.0 | 1.0 | 800 | $2,380 | $2.98 | 3d | 1 | 1.37mi |
| 19300 Maybrook LN Santa Clarita, CA | 1.0–3.0 | 1.0–2.0 | 1017 | $3,222 | $3.17 | 1d | 61 | 1.46mi |
Listing history 26 events
-
2026-06-18days on market $137,499 Active 144 DOM
-
2026-06-17days on market $137,499 Active 143 DOM
-
2026-06-16days on market $137,499 Active 142 DOM
-
2026-06-15days on market $137,499 Active 141 DOM
-
2026-06-13days on market $137,499 Active 139 DOM
-
2026-06-13days on market $137,499 Active 138 DOM
-
2026-06-09days on market $137,499 Active 135 DOM
-
2026-06-08days on market $137,499 Active 134 DOM
-
2026-06-07days on market $137,499 Active 133 DOM
-
2026-06-04days on market $137,499 Active 130 DOM
-
2026-06-03days on market $137,499 Active 129 DOM
-
2026-06-02days on market $137,499 Active 128 DOM
-
2026-06-01days on market $137,499 Active 127 DOM
-
2026-05-31days on market $137,499 Active 126 DOM
-
2026-05-20price $137,499
-
2026-04-21price $139,999
-
2026-04-02price $170,000
-
2026-03-02price $164,990
-
2026-02-18price $169,990
-
2026-01-25$170,000 Active
-
2015-03-23historical
-
2015-03-13price $26,992
-
2015-02-17price $29,992
-
2014-10-07price $25,000
-
2014-10-07price $32,000
-
2014-09-22$35,000 Active
ⓘ Source: listings_history table (triggers on properties + properties_extension) + one-shot
backfill from property_details.listing_events for pre-trigger history.
Tax reassessment forecast CA · Resets to sale price
- Current annual tax
- $312 · $26/mo
- Projected year-2 tax
- $1,045 · $87/mo
- Expected delta
- +$733/yr (+$61/mo · 234.5%)
ⓘ Screening estimate from a state-policy table — verify with the county assessor before closing.
Climate risk First Street
- Flood 4/10 Moderate FEMA zone X (shaded) · 33% chance over 30 yrs
- Wildfire 8/10 Severe
- Heat 7/10 Severe 7 d/yr ≥98°F today · 20 d/yr by 30 yrs out
- Wind 1/10 Low
- Air quality 6/10 Major 9 unhealthy d/yr today · 13 by 30 yrs out
Nearby sold comps map
Loading sold comps map…
Walkable amenities ~0.75 mi
Loading nearby amenities…
Taxation est. · year 1
- Rental income
- $32,627
- − Mortgage interest
- −$7,702
- − Property taxes
- −$312
- − Insurance
- −$687
- − Repairs & maintenance
- −$2,610
- − Management
- −$2,610
- − Depreciation
- −$4,000
- Taxable income
- $14,705
- Est. tax owed @ 24.0%
- −$3,529
- After-tax cash flow
- $12,594/yr
For passive investors: Depreciation is non-cash, so a rental often shows a tax loss while cash-flowing — sheltering income. Rental losses are passive: they offset passive income freely, and up to $25,000/yr can offset ordinary (W-2) income if you actively participate and your MAGI is under $100k (phasing out to $0 by $150k); unused losses carry forward. On sale, claimed depreciation is recaptured at up to 25%, and gains may owe capital-gains tax (a 1031 exchange can defer both). Figures are a year-1 estimate at your 24.0% rate — not tax advice; consult a CPA.
Schools (NCES district)
- District
- William S. Hart Union High
- NCES district ID
- 0642510
- Math proficiency
- 52% ▬ 0.00%
- Reading proficiency
- 72% ▲ 1.00%
- Median HH income
- $95,844
- Composite
- 58.6/100
- National rank
- #2030
- State rank
- #155 of 1400 in CA
Livability — Santa Clarita
- Score
- 70/100
- State rank
- #229
- US rank
- #7378
Category grades
Schools grade is shown separately in the Schools card above.
Census & demographics
- Census place
- Santa Clarita, CA
- County
- Los Angeles County · 9,444,647 people
- City population
- 219,066
- Metro
- Los Angeles-Long Beach-Anaheim, CA
- Population (ZIP)
- 33,155
- Household income
- $115,364
- Rent vs Own
- Severe rent burden
- 784.0
Population outlook (Los Angeles County) Hauer SSP2
- Today (2025)
- 10,940,515 people
- By 2030
- 11,256,481 · +2.9%
- By 2040
- 11,729,929 · +7.2%
- By 2050
- 11,948,407 · +9.2%
- By 2075
- 11,818,114 · +8.0%
- By 2100
- 10,842,928 · -0.9%
Race, ethnicity, and origin ACS 2023
- Neighborhood character
- Diverse neighborhood (Simpson 0.64)
- Race & ethnicity
- Hispanic / Latino 49% White 34% Two or more races 21% Asian 6% Black 4% Native American 1%
- Hispanic origin (detail)
- Mexican 36%
- Common ancestry
- Romanian 1% Lithuanian 1% Scotch-Irish 1%
- Foreign-born
- 23% · Canada, Jamaica, South Korea
- Languages at home
- 54% English-only · Spanish 35% Other Indo-European 3% Tagalog/Filipino 2%
Political lean MEDSL · Los Angeles
- 2024 margin
- Solid D (+32.9) · D 64.8% · R 31.9% · Other 3.3%
- 2008→2024 swing
- -7.4pp toward R · 2008: 40.4pp · 2024: 32.9pp
- All cycles
- 2024: D+32.9 2020: D+44.2 2016: D+48.0 2012: D+40.0 2008: D+40.4
Not yet ingested
- Civics
- —
Market trends
- HPI YoY
- ▼ -703.16%
- Current HPI
- 360.9901
- Rent YoY
- ▲ 1.70%
- Metro
- Los Angeles-Long Beach-Anaheim, CA
- State GDP YoY
- ▲ 3.21%
- F500 in state
- 116
Industry mix (Fortune 500 HQ in CA)
| Industry | F500 HQs | Revenue |
|---|---|---|
| Technology | 27 | $1,492B |
|
||
| Financial Services | 3 | $174B |
|
||
| Retail | 3 | $44B |
|
||
| Insurance | 3 | $26B |
|
||
| Media / Entertainment | 2 | $115B |
|
||
| Pharmaceuticals / Biotech | 2 | $62B |
|
||
Price history
+292.9% since first listed12 events — show timeline
- 2026-05-20 Price Changed $137,499 CRMLS
- 2026-04-21 Price Changed $139,999 CRMLS
- 2026-04-02 Price Changed $170,000 CRMLS
- 2026-03-02 Price Changed $164,990 CRMLS
- 2026-02-18 Price Changed $169,990 CRMLS
- 2026-01-25 Listed $170,000 CRMLS
- 2015-03-23 Listing Removed — CRMLS
- 2015-03-13 Price Changed $26,992 CRMLS
- 2015-02-17 Price Changed $29,992 CRMLS
- 2014-10-07 Price Changed $32,000 CRMLS
- 2014-10-07 Price Changed $25,000 CRMLS
- 2014-09-22 Listed $35,000 CRMLS
Property tax history
+5.5%/yrLatest (2025): $312 · +5.5% YoY. Source: county tax records.
Cash-flow waterfall
monthlySold comps — $/sqft
last 12 mo · ≤1 miLoading sold comps…