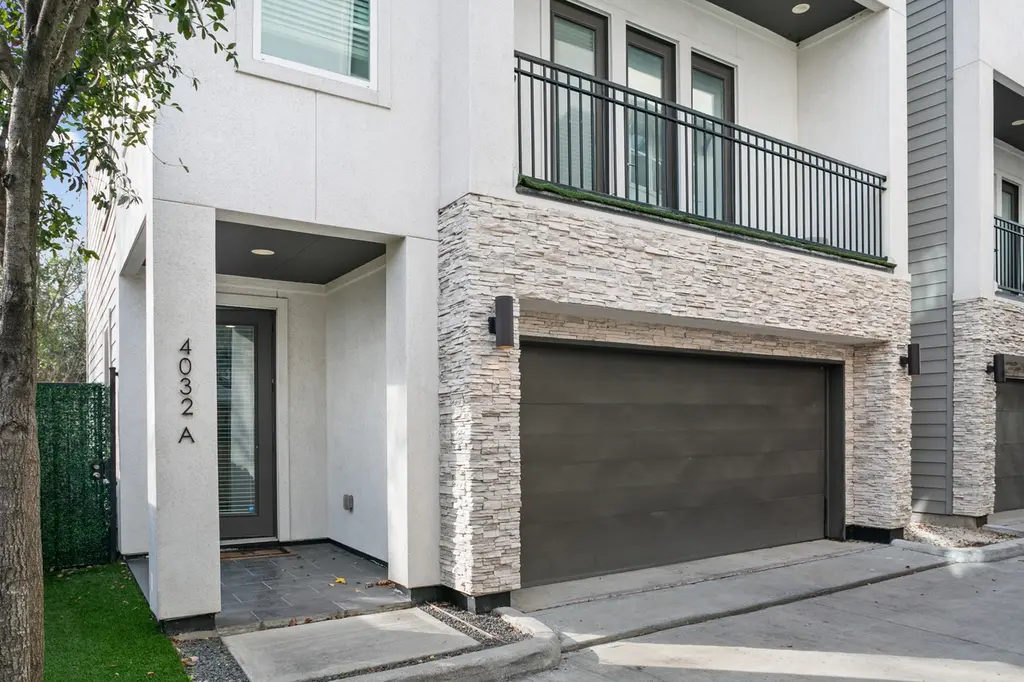
4032 Buck St Unit A · Houston, TX
Flood risk 6/10 · Moderate
- FEMA flood zone
- X (unshaded)
- Chance of flooding over 30 yrs
- 0.69%
- Est. flood insurance / yr
- $507 – $1,088
Fire risk 1/10 · Minimal
- Est. fire insurance / yr
- $1,222 – $2,270
Heat risk 9/10 · Severe
- Hot days now (above 109°F)
- 7 days/yr
- Hot days in 30 yrs
- 24 days/yr
Wind risk 9/10 · Severe
- Chance of severe wind over 30 yrs
- 99.0%
Air-quality risk 3/10 · Minor
- Unhealthy air days now
- 2 days/yr
- Unhealthy air days in 30 yrs
- 3 days/yr
Risk factors via First Street. Map © Google.
Why this score? — see what drove the D- grade
The composite is a weighted blend of 9 inputs, each scored 0–100. Each bar is that input's sub-score; the figure is the points it added to the 100-point composite (weight × sub-score).
- ARV discount +10.7/15.0
- Appreciation +10.0/10.0
- Cash flow +5.0/30.0
- Livability +3.7/5.0
- Rent growth +3.6/5.0
- Schools +2.7/10.0
- Condition / age +2.5/5.0
- 1% rule +1.3/10.0
- DSCR +0.0/10.0
$399,500
🖨 Deal sheet (PDF) 📄 Offer letter ✓ Due diligence
Listing remarks MLS
Modern at Buck offers stylish three-story living in the heart of East Downtown Houston, minutes from I-10, I-69, and Downtown. This contemporary home features 3 bedrooms, 3.5 baths, and upscale finishes throughout. The first floor includes a 2-car attached garage and a private secondary bedroom with ensuite bath and walk-in closet. The second floor showcases an open-concept layout with wood floors, a spacious family room, dining area, and a modern kitchen with white cabinetry, stainless steel appliances, and a large island. Enjoy a private balcony overlooking the community. The third floor features the primary suite with a spa-like bath offering double sinks, soaking tub, and separate shower, plus an additional bedroom with private bath. Schedule your showing today!
Key facts
- Three story living
- Private balcony
- Spa like bath
Tags
Neighborhood map
What this means for you Summary
Snapshot
- This is a 3-bed/3.5-bath single-family listed at $400k.
Deal economics
- At list price, monthly cash flow is $-947 ($-11k/yr) — negative.
- To cash-flow at today's rent, offer at most $232k (41.9% below list).
- To meet the 1% rule (rent ≥ 1% of price), the offer needs to be $251k (37.1% below list).
- Recommended offer: $232k (41.9% below list) — sets the bar for cash-flow.
Location & tenants
- Location reads 74/100 on livability (#184 in TX, #4,771 nationally) — a middle-class / working-renter tenant base. Strengths: amenities A+, cost of living A+, housing A+; Watch: schools D, crime F.
- Houston ISD (urban): math 27% / reading 35% proficiency, ranked #593 of 826 in TX (top 72%) — families likely to look elsewhere, expect single-tenant / working-renter base with shorter leases; 71% free/reduced lunch — lower-income household profile, screen leases tightly.
- Market conditions: Rents rising fast (+4.3%/yr); 339 active listings in the ZIP; 34 comparable units currently listed for rent nearby; rentals leasing fast (median 13d on market — plan ~1-2 weeks tenant-placement turnaround); 29,883 units permitted in Harris County in 2024 (8,621 in 5+ unit buildings).
- At $2,513/mo this rent would consume 60% of the median local household income ($50k/yr) (locally 969% of renters already pay >50% of income on rent) — very limited rent-growth headroom before tenants either downsize or default.
Forward outlook
- In year one you build about $43k of equity ($3k loan paydown + $40k appreciation (10.0% local appreciation)).
- Harris County population projected at +47% by 2050 — long-run rental-demand tailwind backs the buy-and-hold thesis.
- By year 2, paydown + projected appreciation supports a ~$69k cash-out refi (75% LTV) — recoverable capital for the next deal without selling this one.
Negotiation context
- It's been on market 85 days — a 6% lower offer ($376k) is reasonable based on typical stale-listing flexibility.
- 4 sale attempts since 6y ago; this cycle's ask is 15880% above the opening price — seller raised mid-cycle; expect resistance to lowballs.
Risks & watch-outs
- Climate carrying-cost: major flood risk; severe wind risk, 99% chance of damaging wind over 30y; extreme-heat days projected 7→24/yr by 2055 (HVAC capex compounding) — expect insurance premiums to compound above CPI over the hold.
Questions for the listing agent
- What do current leases actually rent for vs. the listed asking? Can we see a recent rent roll and the last 12 months of T-12 income?
- It's been on market 85 days. Have you received any prior offers? Is the seller open to a 42% concession, seller financing, or rate buy-down credit?
- Why hasn't it sold? Are there any deal-killer items the seller is aware of (foundation, flood, title, zoning, code violations)?
- Is there a deadline driving the sale (1031 exchange, divorce, estate, relocation)? That informs how much negotiation room exists.
- Schools are D-rated, which usually means shorter tenancies and higher turnover. Who's the typical renter profile here, and what's been the actual vacancy rate?
- Crime grade is F in this area — have there been break-ins, vandalism, or insurance claims at this property in the last 3 years? What carrier currently insures it and at what premium?
- The area grade is low — what's the realistic commute time and amenity access for the typical tenant pool here? Any planned neighborhood developments (good or bad) we should know about?
- What's the average days-on-market for RENTAL listings here right now (not sales)? A rising rental-DOM trend means longer vacancies and softer asking-rent achievability than the comps imply.
- What's the recent tenant-quality profile in this submarket — average credit score on applications, eviction rate, late-payment / NSF rate, and stable-employment percentage? A property-management company in the area should have these aggregated.
- How much new for-sale + rental construction is in the pipeline within 1–3 miles? Heavy new supply typically softens prices + rents 12–24 months out; constrained supply supports both.
Investment metrics
- 1% rule
- 0.63% ✗
- Cap rate
- 3.45%
- Cash-on-cash
- -10.16%
- DSCR
- 0.55
- GRM
- 13.2
CMA / ARV
- ARV (median comp)
- $430,140
- List price
- $399,500
- Delta
- -7.12%
- Verdict
- FAIR
- Comps
- 20 within 1.0 mi
Show comp detail 12 sales within ~0.75 mi
| Address | Dist | Beds/Ba | Sqft | Sold | Price | $/sf | Match |
|---|---|---|---|---|---|---|---|
| 4430 Edmund St | 0.35mi | 3/3.5 | 2,023 (+4%) | 2mo | $394,990 | $195 | 76 |
| 3415 Stonewall St | 0.38mi | 3/2.5 | 1,969 (+1%) | 1mo | $369,000 | $187 | 76 |
| 3209 Baer St Unit A | 0.44mi | 3/3.5 | 1,990 (+2%) | 1mo | $464,900 | $234 | 76 |
| 3409 Stonewall St | 0.39mi | 3/2.5 | 1,969 (+1%) | 1mo | $349,900 | $178 | 75 |
| 3209 Baer St Unit B | 0.44mi | 3/3.5 | 1,996 (+2%) | 1mo | $464,900 | $233 | 75 |
| 4439 Gunter St | 0.30mi | 3/2.5 | 2,027 (+4%) | 2mo | $325,000 | $160 | 73 |
| 411 Grove St Unit C | 0.47mi | 3/2.5 | 1,903 (-2%) | 2mo | $375,000 | $197 | 69 |
| 659 Press St | 0.13mi | 3/2.5 | 1,682 (-14%) | 2mo | $299,900 | $178 | 66 |
| 3605 New Orleans St | 0.54mi | 3/2.5 | 1,884 (-3%) | 1mo | $374,900 | $199 | 64 |
| 1266 Finnigan Dr | 0.67mi | 3/3.5 | 1,988 (+2%) | 2mo | $375,000 | $189 | 64 |
| 3306 Cline St | 0.44mi | 3/3.5 | 2,154 (+10%) | 1mo | $390,000 | $181 | 61 |
| 711 Schwartz St | 0.68mi | 3/3.5 | 1,692 (-13%) | 2mo | $309,000 | $183 | 44 |
Match score weights: distance 35% · size 25% · config 20% · recency 20%. Top-matched comps best support the ARV.
Projected returns pro-forma
10.0% appreciation · 4.27% rent growth · sell at horizon
- IRR
- 17.5%
- Equity multiple
- 2.44×
- Total profit
- $160,646
- Equity at exit
- $359,901
- IRR
- 16.7%
- Equity multiple
- 5.72×
- Total profit
- $527,754
- Equity at exit
- $776,141
Cash invested: $111,860 (down + closing). Projections, not guarantees.
Landlord ↔ Tenant lean methodology
- Overall (STATE)
- 87 Strongly Landlord-Friendly
- State Texas
- 87 Strongly Landlord-Friendly · R+5
- County
- — inherits STATE
- City
- — inherits STATE
ZIP-level market 77020
- Home prices YoY
- 29.1%
- Rents YoY
- 4.3%
- Active inventory
- 339
- Price-to-rent
- 13.2×
Monthly cashflow live
- Estimated rent
- $2,513 high interval (Pro) →
- Mortgage (P&I)
- −$2,095
- Tax from tax record
- −$671 /mo · $8,055/yr
- Insurance
- −$166
- HOA
- −$0
- Vacancy / Maint / Mgmt
- −$528
- Net cashflow
- $-947
Break-even live
Sensitivity live
| Price | -10% $-721 | -5% $-834 | +0% $-947 | +5% $-1,060 | +10% $-1,173 |
|---|---|---|---|---|---|
| Rent | -10% $-1,146 | -5% $-1,046 | +0% $-947 | +5% $-848 | +10% $-749 |
| Rate | -1.0pp $-746 | -0.5pp $-846 | base $-947 | +0.5pp $-1,051 | +1.0pp $-1,156 |
UW: 25.0% down · 7.5% · 30yr · 1.5% tax · 5.0% vac · 8.0% maint · 8.0% mgmt
Financing live
Cash to close
- Down payment
- $99,875
- Closing costs
- $11,985
- Reserves months
- —
- Total cash needed
- —
Loan-product check · same deal, 3 products live
Conventional
25% down · 7.5% · 30yr
- Down + closing
- —
- Monthly P&I
- —
- Monthly cashflow
- —
- DSCR
- —
- Eligible?
- —
Personal DTI + credit; lowest rate.
DSCR
20% down · 8.5% · 30yr
- Down + closing
- —
- Monthly P&I
- —
- Monthly cashflow
- —
- DSCR
- —
- Eligible?
- —
No personal income docs; deal must DSCR.
Hard money
10% down · 12.0% · 12mo
- Down + closing
- —
- Monthly P&I
- —
- Monthly cashflow
- —
- DSCR
- —
- Eligible?
- —
Short-term bridge; refi at stabilization.
Rent comps 34 comps
| Address | Beds | Baths | Sqft | Rent | $/sqft | DOM | Units | Dist |
|---|---|---|---|---|---|---|---|---|
| 4109 Hare St Unit 1019559P Houston, TX | 4.0 | 2.5 | 1905 | $6,852 | $3.60 | 8d | 1 | 0.03mi |
| 4109 Hare St Unit A Houston, TX | 4.0 | 2.5 | 1913 | $6,950 | $3.63 | 44d | 1 | 0.03mi |
| 3419 Gillespie St Houston, TX | 3.0 | 3.5 | 2168 | $2,300 | $1.06 | 44d | 1 | 0.34mi |
| 3410 Baer St Houston, TX | 3.0 | 4.0 | 2040 | $3,500 | $1.72 | 44d | 1 | 0.34mi |
| 1222 Upton St Houston, TX | 3.0 | 4.0 | 2055 | $2,600 | $1.27 | 44d | 1 | 0.35mi |
| 4300 Lyons Ave Unit 304 Houston, TX | 4.0 | 2.0 | 1393 | $1,460 | $1.05 | 44d | 1 | 0.44mi |
| 1513 Cage St Houston, TX | 3.0 | 2.0 | 1467 | $1,550 | $1.06 | 44d | 1 | 0.46mi |
| 308 Grove St Houston, TX | 3.0 | 3.0 | 1701 | $2,350 | $1.38 | 8d | 1 | 0.48mi |
| 1303 Bayou St Unit C Houston, TX | 3.0 | 3.0 | 1869 | $3,200 | $1.71 | 44d | 1 | 0.51mi |
| 1307 Bayou St Unit B Houston, TX | 3.0 | 3.0 | 1814 | $2,400 | $1.32 | 8d | 1 | 0.51mi |
| 611 Sydnor St Houston, TX | 3.0 | 4.0 | 2157 | $2,400 | $1.11 | 44d | 1 | 0.55mi |
| 3300 Lyons Ave Unit 304 Houston, TX | 4.0 | 2.0 | 1393 | $1,460 | $1.05 | 44d | 1 | 0.56mi |
| 2905 Baer St Unit 1047953P Houston, TX | 3.0 | 2.5 | 1991 | $3,094 | $1.55 | 6d | 1 | 0.64mi |
| 4706 Hershe St Houston, TX | 3.0 | 2.5 | 2283 | $3,300 | $1.45 | 44d | 1 | 0.68mi |
| 4712 Rawley St Unit B Houston, TX | 3.0 | 2.5 | 1501 | $2,045 | $1.36 | 21d | 1 | 0.77mi |
| 4712 Rawley St Unit a Houston, TX | 3.0 | 2.0 | 1501 | $2,070 | $1.38 | 21d | 1 | 0.77mi |
| 800 Middle St Houston, TX | 1.0–4.0 | 1.0–2.0 | 1003 | $1,593 | $1.59 | 6d | 1 | 0.79mi |
| 91 Jensen Dr Houston, TX | 3.0 | 1.0–2.5 | 970 | $3,420 | $3.52 | 2d | 69 | 1.01mi |
| 5217 Noble St Houston, TX | 3.0 | 2.5 | 1897 | $2,750 | $1.45 | 44d | 1 | 1.04mi |
| 2105 Sam Wilson St Houston, TX | 3.0 | 2.5 | 1416 | $6,750 | $4.77 | 44d | 1 | 1.17mi |
| 5605 Mulvey St Unit 1019610P Houston, TX | 3.0 | 2.5 | 1410 | $4,931 | $3.50 | 0d | 1 | 1.17mi |
| 2115 Runnels St Unit 2148 Houston, TX | 3.0 | 2.0 | 1839 | $3,045 | $1.66 | 12d | 1 | 1.20mi |
| 2115 Runnels St Unit 3174 Houston, TX | 3.0 | 2.0 | 1839 | $3,056 | $1.66 | 13d | 1 | 1.20mi |
| 2115 Runnels St Unit 3187 Houston, TX | 3.0 | 2.0 | 1839 | $3,051 | $1.66 | 0d | 1 | 1.20mi |
| 4509 Courtney St Houston, TX | 4.0 | 1.0 | 1456 | $1,150 | $0.79 | 23d | 1 | 1.22mi |
| 1023 Hahlo St Houston, TX | 4.0 | 2.0 | 1434 | $1,775 | $1.24 | 6d | 1 | 1.25mi |
| 2404 Navigation Blvd Unit 2187 Houston, TX | 2.0 | 2.0 | 1309 | $2,326 | $1.78 | 0d | 1 | 1.25mi |
| 2404 Navigation Blvd Unit 424 Houston, TX | 2.0 | 2.0 | 1309 | $2,296 | $1.75 | 6d | 1 | 1.25mi |
| 2404 Navigation Blvd Unit 2441 Houston, TX | 2.0 | 2.0 | 1309 | $2,320 | $1.77 | 11d | 1 | 1.25mi |
| 2404 Navigation Blvd Unit 422 Houston, TX | 2.0 | 2.0 | 1309 | $2,296 | $1.75 | 8d | 1 | 1.25mi |
| 2315 Navigation Blvd Houston, TX | 1.0–2.0 | 1.0–2.5 | 943 | $3,500 | $3.71 | 0d | 62 | 1.28mi |
| 2414 East Dr Unit Canal St unit Houston, TX | 3.0 | 3.5 | 2063 | $2,950 | $1.43 | 8d | 1 | 1.30mi |
| 2 Jenkins St Houston, TX | 3.0 | 2.0 | 1242 | $2,250 | $1.81 | 44d | 1 | 1.44mi |
| 1250 Leona St Houston, TX | 2.0 | 1.0–2.0 | 885 | $1,990 | $2.25 | 0d | 14 | 1.48mi |
Listing history 19 events
-
2026-06-21days on market $399,500 Active 85 DOM
-
2026-06-18days on market $399,500 Active 82 DOM
-
2026-06-17days on market $399,500 Active 81 DOM
-
2026-06-16days on market $399,500 Active 80 DOM
-
2026-06-15days on market $399,500 Active 79 DOM
-
2026-06-13days on market $399,500 Active 77 DOM
-
2026-06-10days on market $399,500 Active 73 DOM
-
2026-06-08days on market $399,500 Active 72 DOM
-
2026-06-07days on market $399,500 Active 71 DOM
-
2026-06-04days on market $399,500 Active 68 DOM
-
2026-06-01days on market $399,500 Active 65 DOM
-
2026-05-31days on market $399,500 Active 64 DOM
-
2026-05-09$2,500
-
2026-03-28historical
Show marketing remark (782 chars)
Modern at Buck offers stylish three-story living in the heart of East Downtown Houston, minutes from I-10, I-69, and Downtown. This contemporary home features 3 bedrooms, 3.5 baths, and upscale finishes throughout. The first floor includes a 2-car attached garage and a private secondary bedroom with ensuite bath and walk-in closet. The second floor showcases an open-concept layout with wood floors, a spacious family room, dining area, and a modern kitchen with white cabinetry, stainless steel appliances, and a large island. Enjoy a private balcony overlooking the community. The third floor features the primary suite with a spa-like bath offering double sinks, soaking tub, and separate shower, plus an additional bedroom with private bath. Schedule your showing today!
-
2026-03-28$399,500 Active 782-char remark
Show marketing remark (782 chars)
Modern at Buck offers stylish three-story living in the heart of East Downtown Houston, minutes from I-10, I-69, and Downtown. This contemporary home features 3 bedrooms, 3.5 baths, and upscale finishes throughout. The first floor includes a 2-car attached garage and a private secondary bedroom with ensuite bath and walk-in closet. The second floor showcases an open-concept layout with wood floors, a spacious family room, dining area, and a modern kitchen with white cabinetry, stainless steel appliances, and a large island. Enjoy a private balcony overlooking the community. The third floor features the primary suite with a spa-like bath offering double sinks, soaking tub, and separate shower, plus an additional bedroom with private bath. Schedule your showing today!
-
2026-01-20$429,000 Active
-
2020-12-07soldstatus
-
2020-09-30historical
-
2020-09-02$329,888 Active
ⓘ Source: listings_history table (triggers on properties + properties_extension) + one-shot
backfill from property_details.listing_events for pre-trigger history.
Tax reassessment forecast TX · Resets to sale price
- Current annual tax
- $8,055 · $671/mo
- Projected year-2 tax
- $8,055 · $671/mo
- Expected delta
- $0/yr ($0/mo · 0.0%)
ⓘ Screening estimate from a state-policy table — verify with the county assessor before closing.
Climate risk First Street
- Flood 6/10 Major FEMA zone X (unshaded) · 69% chance over 30 yrs
- Wildfire 1/10 Low
- Heat 9/10 Extreme 7 d/yr ≥109°F today · 24 d/yr by 30 yrs out
- Wind 9/10 Extreme 99% chance of damaging wind over 30 yrs
- Air quality 3/10 Moderate 2 unhealthy d/yr today · 3 by 30 yrs out
Nearby sold comps map
Loading sold comps map…
Walkable amenities ~0.75 mi
Loading nearby amenities…
Taxation est. · year 1
- Rental income
- $30,159
- − Mortgage interest
- −$22,378
- − Property taxes
- −$8,055
- − Insurance
- −$1,998
- − Repairs & maintenance
- −$2,413
- − Management
- −$2,413
- − Depreciation
- −$11,622
- Taxable loss
- −$18,718
- Est. tax savings @ 24.0%
- +$4,492
- After-tax cash flow
- $-6,874/yr
For passive investors: Depreciation is non-cash, so a rental often shows a tax loss while cash-flowing — sheltering income. Rental losses are passive: they offset passive income freely, and up to $25,000/yr can offset ordinary (W-2) income if you actively participate and your MAGI is under $100k (phasing out to $0 by $150k); unused losses carry forward. On sale, claimed depreciation is recaptured at up to 25%, and gains may owe capital-gains tax (a 1031 exchange can defer both). Figures are a year-1 estimate at your 24.0% rate — not tax advice; consult a CPA.
Schools (NCES district)
- District
- Houston ISD
- NCES district ID
- 4823640
- Math proficiency
- 27% ▼ -18.00%
- Reading proficiency
- 35% ▼ -6.00%
- Median HH income
- $46,054
- Composite
- 26.63/100
- National rank
- #7173
- State rank
- #593 of 826 in TX
Livability — Houston
- Score
- 74/100
- State rank
- #184
- US rank
- #4771
Category grades
Schools grade is shown separately in the Schools card above.
Census & demographics
- Census place
- Houston, TX
- County
- Harris County · 4,702,590 people
- City population
- 3,226,434
- Metro
- Houston-The Woodlands-Sugar Land, TX
- Population (ZIP)
- 23,686
- Household income
- $50,119
- Rent vs Own
- Severe rent burden
- 969.0
Population outlook (Harris County) Hauer SSP2
- Today (2025)
- 5,571,493 people
- By 2030
- 6,089,821 · +9.3%
- By 2040
- 7,142,806 · +28.2%
- By 2050
- 8,185,864 · +46.9%
- By 2075
- 10,574,329 · +89.8%
- By 2100
- 12,109,958 · +117.4%
Race, ethnicity, and origin ACS 2023
- Neighborhood character
- Predominantly Hispanic (69%)
- Race & ethnicity
- Hispanic / Latino 69% Black 24% Two or more races 22% White 5% Asian 1%
- Hispanic origin (detail)
- Mexican 60%
- Common ancestry
- Swiss 1%
- Foreign-born
- 23% · Canada
- Languages at home
- 39% English-only · Spanish 59% Other Indo-European 1%
Political lean MEDSL · Harris
- 2024 margin
- Lean D (+5.5) · D 52.0% · R 46.4% · Other 1.6%
- 2008→2024 swing
- +3.9pp toward D · 2008: 1.6pp · 2024: 5.5pp
- All cycles
- 2024: D+5.5 2020: D+13.3 2016: D+12.4 2012: D+0.1 2008: D+1.6
Not yet ingested
- Civics
- —
Market trends
- HPI YoY
- ▲ 55.64%
- Current HPI
- 246.5578
- Rent YoY
- ▲ 4.27%
- Metro
- Houston-The Woodlands-Sugar Land, TX
- State GDP YoY
- ▲ 3.95%
- F500 in state
- 110
Industry mix (Fortune 500 HQ in TX)
| Industry | F500 HQs | Revenue |
|---|---|---|
| Energy | 16 | $1,198B |
|
||
| Technology | 5 | $198B |
|
||
| Engineering / Construction | 4 | $72B |
|
||
| Energy Services | 3 | $60B |
|
||
| Utilities | 3 | $41B |
|
||
| Healthcare | 2 | $330B |
|
||
Price history
-99.2% since first listed7 events — show timeline
- 2026-05-09 Listed for Rent $2,500 HARMLS
- 2026-03-28 Listed $399,500 HARMLS
- 2026-03-28 Listing Removed — HARMLS
- 2026-01-20 Listed $429,000 HARMLS
- 2020-12-07 Sold (Public Records) — Public Records
- 2020-09-30 Listing Removed — HARMLS
- 2020-09-02 Listed $329,888 HARMLS
Property tax history
-2.9%/yrLatest (2025): $8,055 · -3.7% YoY. Source: county tax records.
Cash-flow waterfall
monthlySold comps — $/sqft
last 12 mo · ≤1 miLoading sold comps…