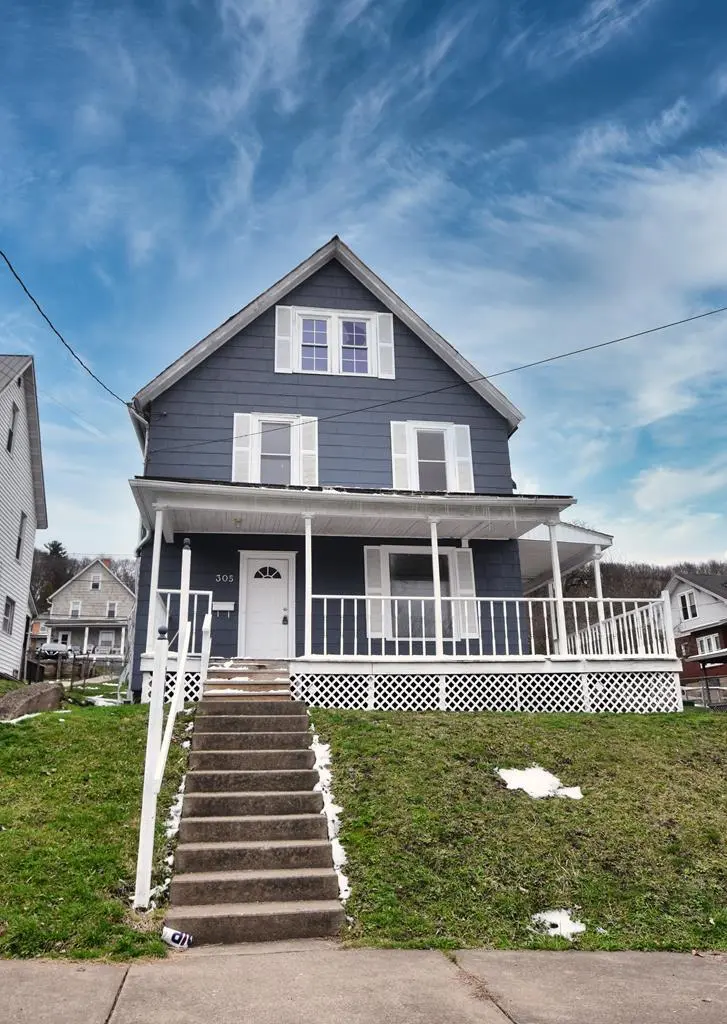
305 Hone Ave · Oil City, PA
Flood risk 1/10 · Minimal
- FEMA flood zone
- X (unshaded)
- Chance of flooding over 30 yrs
- 0.0%
- Est. flood insurance / yr
- $473 – $860
Fire risk 3/10 · Minor
- Est. fire insurance / yr
- $511 – $949
Heat risk 3/10 · Minor
- Hot days now (above 92°F)
- 7 days/yr
- Hot days in 30 yrs
- 19 days/yr
Wind risk 1/10 · Minimal
- Chance of severe wind over 30 yrs
- —
Air-quality risk 2/10 · Minimal
- Unhealthy air days now
- 1 days/yr
- Unhealthy air days in 30 yrs
- 2 days/yr
Risk factors via First Street. Map © Google.
Why this score? — see what drove the C+ grade
The composite is a weighted blend of 9 inputs, each scored 0–100. Each bar is that input's sub-score; the figure is the points it added to the 100-point composite (weight × sub-score).
- Cash flow +26.9/30.0
- DSCR +9.3/10.0
- 1% rule +6.8/10.0
- Appreciation +6.1/10.0
- Livability +3.6/5.0
- Schools +2.7/10.0
- Rent growth +2.5/5.0
- Condition / age +2.5/5.0
- ARV discount +0.0/15.0
$109,900
🖨 Deal sheet (PDF) 📄 Offer letter ✓ Due diligence
Listing remarks
Welcome to this recently refreshed 4-bedroom, 2-bath home offering modern updates and practical space for comfortable living. Step inside to find a brand-new kitchen featuring updated cabinetry, and fixtures both bathrooms have been tastefully renovated, and the home boasts new flooring and fresh paint throughout, giving it a clean, move-in-ready feel. Additional improvements include a new hot water tank and some new windows, adding efficiency and peace of mind. Outside, you'll appreciate the convenience of off-street parking for up to 3 vehicles, a valuable feature for homeowners and guests alike. This property is ideal for buyers seeking a turnkey home with updated systems and stylish upg
Key facts
- New kitchen
- Fresh paint
- Renovated bathrooms
Tags
Property features AI
Finance
- Other: Approximately 2,262 total finished area; Partial basement
Exterior
- Parking: No dedicated parking
- Utilities: Public water; Public sewer; 100 amp electric service with circuit breakers; Cable available
- Home design: Residential property; Multi-level / split-level, two stories; Wood siding exterior; Frame construction
- Construction: Composition roof; Combination foundation
- Exterior features: Front porch; Lot approximately 50 x 140 (0.16 acre); Residential zoning
Interior
- Kitchen: Electric water heater
- Flooring: Tile; Vinyl; Other
- Heating & cooling: Forced air heating; Natural gas heating; No central cooling
- Interior features: High-speed internet
- Laundry & utility: Washer hookup
Neighborhood map
What this means for you Summary
Snapshot
- This is a 4-bed/1.5-bath single-family listed at $110k.
Deal economics
- At list price, monthly cash flow is $304 ($4k/yr) — positive.
- The deal already cash-flows at list — no discount required.
- Meets the 1% rule at list price ($1k rent vs $110k).
- Recommended offer: $107k (3.0% below list) — sets the bar for market timing.
Location & tenants
- Location reads 71/100 on livability (#704 in PA) — a middle-class / working-renter tenant base. Strengths: crime A+, cost of living A+, housing A+; Watch: amenities F, commute F, employment F.
- Oil City Area SD (town): math 20% / reading 46% proficiency, ranked #436 of 539 in PA (top 81%) — families likely to look elsewhere, expect single-tenant / working-renter base with shorter leases.
- Zoned schools: Hasson Heights Sch (math 22% / reading 42%, grade F, #1,094 of 1,518 statewide, top 73%, 385 students, 100% FRL); Oil City Area Ms (math 11% / reading 46%, grade F, #395 of 512 statewide, top 78%, 582 students, 100% FRL); Oil City Shs (math 47% / reading 24%, grade F, #305 of 437 statewide, top 70%, 603 students, 74% FRL) — zoned schools average 92% FRL vs 52% district-wide (39 pts higher); higher-poverty schools than district average — tighter screening recommended.
- Market conditions: 52 active listings in the ZIP; 1 comparable units currently listed for rent nearby; 42 units permitted in Venango County in 2024 (0 in 5+ unit buildings).
Forward outlook
- In year one you build about $3k of equity ($760 loan paydown + $2k appreciation (2.2% local appreciation)).
- Venango County population projected at -30% by 2050 — secular population decline; favor cash flow + early exit over multi-decade hold.
- At projected returns (2.2% appreciation + 3.0% rent growth), your $31k cash investment doubles in ~5 years — after that, you're playing with house money.
- By year 10, paydown + projected appreciation supports a ~$31k cash-out refi (75% LTV) — recoverable capital for the next deal without selling this one.
Negotiation context
- It's been on market 46 days — a 3% lower offer ($107k) is reasonable based on typical stale-listing flexibility.
- Current owner paid $20k; list at $110k implies a 450% gain — meaningful room to come down on a strong offer.
Risks & watch-outs
- Watch-outs: built in 1897 — expect roof / HVAC / electrical / plumbing capex.
Questions for the listing agent
- It's been on market 46 days. Have you received any prior offers? Is the seller open to a 3% concession, seller financing, or rate buy-down credit?
- Built in 1897 — when were the roof, HVAC, electrical panel, plumbing, and water heater last replaced?
- Is there a deadline driving the sale (1031 exchange, divorce, estate, relocation)? That informs how much negotiation room exists.
- What's the average days-on-market for RENTAL listings here right now (not sales)? A rising rental-DOM trend means longer vacancies and softer asking-rent achievability than the comps imply.
- What's the recent tenant-quality profile in this submarket — average credit score on applications, eviction rate, late-payment / NSF rate, and stable-employment percentage? A property-management company in the area should have these aggregated.
- How much new for-sale + rental construction is in the pipeline within 1–3 miles? Heavy new supply typically softens prices + rents 12–24 months out; constrained supply supports both.
Investment metrics
- 1% rule
- 1.18% ✓
- Cap rate
- 9.61%
- Cash-on-cash
- 11.86%
- DSCR
- 1.53
- GRM
- 7.0
CMA / ARV
- ARV (median comp)
- $91,484
- List price
- $109,900
- Delta
- 20.13%
- Verdict
- OVERPRICED
- Comps
- 20 within 1.0 mi
Show comp detail 5 sales within ~0.75 mi
| Address | Dist | Beds/Ba | Sqft | Sold | Price | $/sf | Match |
|---|---|---|---|---|---|---|---|
| 207 Hoffman Ave | 0.18mi | 4/2.0 | 2,400 (+6%) | 7mo | $7,000 | $3 | 74 |
| 33 Hone Ave | 0.32mi | 3/1.0 (-1) | 2,184 (-3%) | 7mo | $40,000 | $18 | 66 |
| 284 Linden Ave | 0.12mi | 4/1.5 | 1,946 (-14%) | 12mo | $107,000 | $55 | 62 |
| 223 Cedar Ave | 0.14mi | 3/1.0 (-1) | 2,028 (-10%) | 15mo | $95,000 | $47 | 57 |
| 305 E Third St | 0.75mi | 3/1.5 (-1) | 2,016 (-11%) | 23mo | $20,500 | $10 | 23 |
Match score weights: distance 35% · size 25% · config 20% · recency 20%. Top-matched comps best support the ARV.
Projected returns pro-forma
2.18% appreciation · 3.0% rent growth · sell at horizon
- IRR
- 16.6%
- Equity multiple
- 1.91×
- Total profit
- $27,893
- Equity at exit
- $44,397
- IRR
- 18.8%
- Equity multiple
- 3.54×
- Total profit
- $78,228
- Equity at exit
- $64,748
Cash invested: $30,772 (down + closing). Projections, not guarantees.
Landlord ↔ Tenant lean methodology
- Overall (STATE)
- 62 Landlord-Friendly
- State Pennsylvania
- 62 Landlord-Friendly · EVEN
- County
- — inherits STATE
- City
- — inherits STATE
ZIP-level market 16301
- Home prices YoY
- 1.0%
- Active inventory
- 52
- Price-to-rent
- 7.0×
Monthly cashflow live
- Estimated rent
- $1,300 medium interval (Pro) →
- Mortgage (P&I)
- −$576
- Tax from tax record
- −$101 /mo · $1,208/yr
- Insurance
- −$46
- HOA
- −$0
- Vacancy / Maint / Mgmt
- −$273
- Net cashflow
- $304
Break-even live
Sensitivity live
| Price | -10% $366 | -5% $335 | +0% $304 | +5% $273 | +10% $242 |
|---|---|---|---|---|---|
| Rent | -10% $201 | -5% $253 | +0% $304 | +5% $356 | +10% $407 |
| Rate | -1.0pp $360 | -0.5pp $332 | base $304 | +0.5pp $276 | +1.0pp $247 |
UW: 25.0% down · 7.5% · 30yr · 1.5% tax · 5.0% vac · 8.0% maint · 8.0% mgmt
Financing live
Cash to close
- Down payment
- $27,475
- Closing costs
- $3,297
- Reserves months
- —
- Total cash needed
- —
Loan-product check · same deal, 3 products live
Conventional
25% down · 7.5% · 30yr
- Down + closing
- —
- Monthly P&I
- —
- Monthly cashflow
- —
- DSCR
- —
- Eligible?
- —
Personal DTI + credit; lowest rate.
DSCR
20% down · 8.5% · 30yr
- Down + closing
- —
- Monthly P&I
- —
- Monthly cashflow
- —
- DSCR
- —
- Eligible?
- —
No personal income docs; deal must DSCR.
Hard money
10% down · 12.0% · 12mo
- Down + closing
- —
- Monthly P&I
- —
- Monthly cashflow
- —
- DSCR
- —
- Eligible?
- —
Short-term bridge; refi at stabilization.
Rent comps 1 comps
| Address | Beds | Baths | Sqft | Rent | $/sqft | DOM | Units | Dist |
|---|---|---|---|---|---|---|---|---|
| 815 W 1st St Oil City, PA | 4.0 | 1.5 | 1674 | $1,300 | $0.78 | 45d | 1 | 1.42mi |
Listing history 18 events
-
2026-06-21days on market $109,900 Active 46 DOM
-
2026-06-21days on market $109,900 Active 45 DOM
-
2026-06-18days on market $109,900 Active 43 DOM
-
2026-06-17days on market $109,900 Active 42 DOM
-
2026-06-16days on market $109,900 Active 41 DOM
-
2026-06-15days on market $109,900 Active 40 DOM
-
2026-06-13days on market $109,900 Active 38 DOM
-
2026-06-12days on market $109,900 Active 37 DOM
-
2026-06-09days on market $109,900 Active 34 DOM
-
2026-06-08days on market $109,900 Active 33 DOM
-
2026-06-08days on market $109,900 Active 32 DOM
-
2026-06-07days on market $109,900 Active 31 DOM
-
2026-06-04days on market $109,900 Active 28 DOM
-
2026-06-02days on market $109,900 Active 27 DOM
-
2026-06-01days on market $109,900 Active 26 DOM
-
2026-05-31days on market $109,900 Active 25 DOM
-
2026-05-06$109,900 Active 705-char remark
-
1993-08-09soldstatus $20,000
ⓘ Source: listings_history table (triggers on properties + properties_extension) + one-shot
backfill from property_details.listing_events for pre-trigger history.
Tax reassessment forecast PA · Partial reset (capped growth)
- Current annual tax
- $1,208 · $101/mo
- Projected year-2 tax
- $1,472 · $123/mo
- Expected delta
- +$264/yr (+$22/mo · 21.9%)
ⓘ Screening estimate from a state-policy table — verify with the county assessor before closing.
Climate risk First Street
- Flood 1/10 Low FEMA zone X (unshaded) · 0% chance over 30 yrs
- Wildfire 3/10 Moderate
- Heat 3/10 Moderate 7 d/yr ≥92°F today · 19 d/yr by 30 yrs out
- Wind 1/10 Low
- Air quality 2/10 Low 1 unhealthy d/yr today · 2 by 30 yrs out
Nearby sold comps map
Loading sold comps map…
Walkable amenities ~0.75 mi
Loading nearby amenities…
Taxation est. · year 1
- Rental income
- $15,600
- − Mortgage interest
- −$6,156
- − Property taxes
- −$1,208
- − Insurance
- −$550
- − Repairs & maintenance
- −$1,248
- − Management
- −$1,248
- − Depreciation
- −$3,197
- Taxable income
- $1,993
- Est. tax owed @ 24.0%
- −$478
- After-tax cash flow
- $3,172/yr
For passive investors: Depreciation is non-cash, so a rental often shows a tax loss while cash-flowing — sheltering income. Rental losses are passive: they offset passive income freely, and up to $25,000/yr can offset ordinary (W-2) income if you actively participate and your MAGI is under $100k (phasing out to $0 by $150k); unused losses carry forward. On sale, claimed depreciation is recaptured at up to 25%, and gains may owe capital-gains tax (a 1031 exchange can defer both). Figures are a year-1 estimate at your 24.0% rate — not tax advice; consult a CPA.
Schools (NCES district)
- District
- Oil City Area SD
- NCES district ID
- 4218090
- Math proficiency
- 20% ▼ -19.00%
- Reading proficiency
- 46% ▼ -10.00%
- Median HH income
- $37,451
- Composite
- 27.39/100
- National rank
- #6973
- State rank
- #436 of 539 in PA
Livability — Oil City
- Score
- 71/100
- State rank
- #704
- US rank
- #6931
Category grades
Schools grade is shown separately in the Schools card above.
Census & demographics
- Census place
- Oil City, PA
- Population (ZIP)
- 15,067
Population outlook (Venango County) Hauer SSP2
- Today (2025)
- 48,827 people
- By 2030
- 46,061 · -5.7%
- By 2040
- 39,989 · -18.1%
- By 2050
- 34,094 · -30.2%
- By 2075
- 22,500 · -53.9%
- By 2100
- 13,659 · -72.0%
Race, ethnicity, and origin ACS 2023
- Neighborhood character
- Predominantly White (93%)
- Race & ethnicity
- White 93% Two or more races 4% Hispanic / Latino 1%
- Common ancestry
- Romanian 7% Iranian 3% Italian 2%
- Foreign-born
- 1%
Political lean MEDSL · Venango
- 2024 margin
- Solid R (+42.1) · D 28.5% · R 70.6%
- 2008→2024 swing
- -22.9pp toward R · 2008: -19.2pp · 2024: -42.1pp
- All cycles
- 2024: R+42.1 2020: R+41.4 2016: R+42.4 2012: R+26.3 2008: R+19.2
Not yet ingested
- Civics
- —
Market trends
- HPI YoY
- ▲ 2.18%
- Current HPI
- 218.0124
- Rent YoY
- —
- Metro
- —
- State GDP YoY
- ▲ 1.68%
- F500 in state
- 34
Industry mix (Fortune 500 HQ in PA)
| Industry | F500 HQs | Revenue |
|---|---|---|
| Healthcare | 2 | $309B |
|
||
| Insurance | 2 | $27B |
|
||
| Telecommunications / Media | 1 | $124B |
|
||
| Industrial Distribution | 1 | $22B |
|
||
| Financial Services | 1 | $20B |
|
||
| Chemicals / Materials | 1 | $18B |
|
||
Price history
+449.5% since first listed2 events — show timeline
- 2026-05-06 Listed $109,900 AVBREALTORS
- 1993-08-09 Sold (Public Records) $20,000 Public Records
Property tax history
+1.1%/yrLatest (2026): $1,208 · -1.3% YoY. Source: county tax records.
Cash-flow waterfall
monthlySold comps — $/sqft
last 12 mo · ≤1 miLoading sold comps…