17 Sunset Cir · Fort Valley, GA
Flood risk 1/10 · Minimal
- FEMA flood zone
- X (unshaded)
- Chance of flooding over 30 yrs
- 0.0%
- Est. flood insurance / yr
- $507 – $1,088
Fire risk 5/10 · Moderate
- Est. fire insurance / yr
- $963 – $1,789
Heat risk 6/10 · Moderate
- Hot days now (above 107°F)
- 7 days/yr
- Hot days in 30 yrs
- 18 days/yr
Wind risk 8/10 · Major
- Chance of severe wind over 30 yrs
- 80.0%
Air-quality risk 3/10 · Minor
- Unhealthy air days now
- 2 days/yr
- Unhealthy air days in 30 yrs
- 2 days/yr
Risk factors via First Street. Map © Google.
Why this score? — see what drove the B- grade
The composite is a weighted blend of 9 inputs, each scored 0–100. Each bar is that input's sub-score; the figure is the points it added to the 100-point composite (weight × sub-score).
- Cash flow +30.0/30.0
- 1% rule +10.0/10.0
- DSCR +10.0/10.0
- ARV discount +7.5/15.0
- Livability +3.2/5.0
- Rent growth +2.5/5.0
- Condition / age +2.5/5.0
- Schools +1.8/10.0
- Appreciation +0.0/10.0
$39,999
🖨 Deal sheet 📄 Offer letter ✓ Due diligence
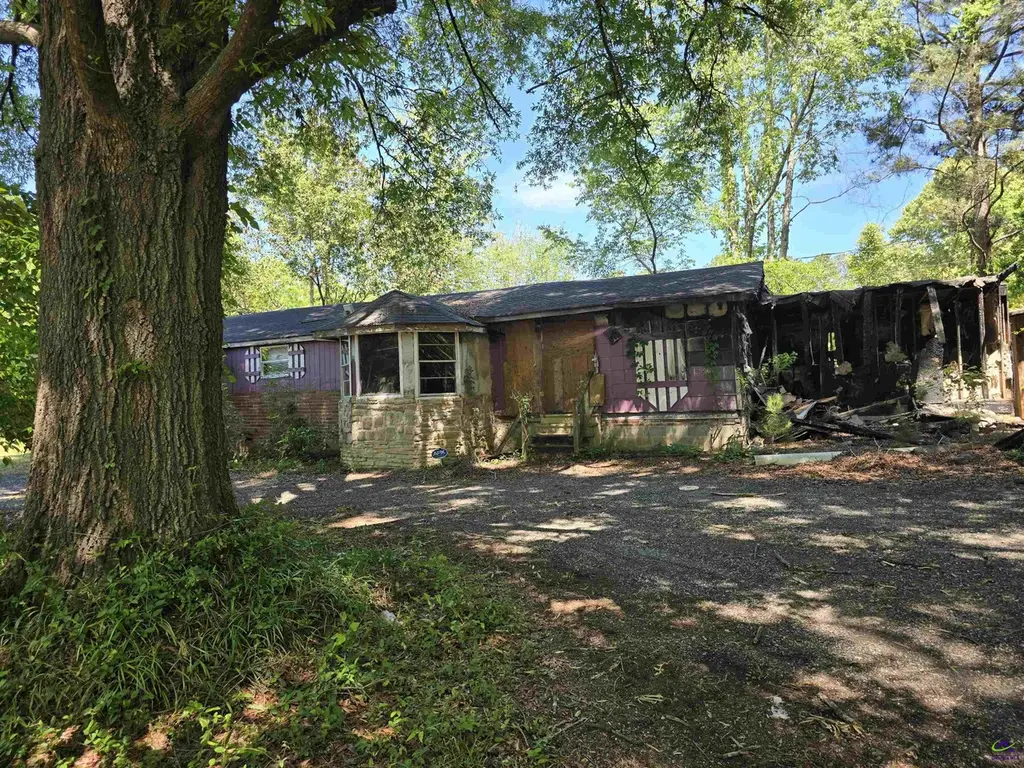
Listing remarks MLS
This gives You a Chance to Exhibit Your Skills and Display Your Own Masterpiece. The Property has Fire Damage. A Hold Harmless Agreement has to be signed Prior to viewing the Property.
Key facts
- 0.35 acre lot
- Built 1970
- Listed 38 days
Property features AI
Finance
- Other: Property located in Sunset/Gun Club subdivision; Corner lot size approximately 0.35 acres
- Financial info: Listing is offered As-Is; Cash offers only
- HOA & community: No HOA; No community features
Exterior
- Parking: Off-street parking
- Utilities: Well water; Septic tank; Underground utilities
- Home design: Manufactured home / Single-family residence; Manufactured house structure; One story; Resale condition
- Construction: Built in 1970; Brick construction
- Exterior features: Brick construction; Other roof type; Other fencing; Corner lot
Interior
- Kitchen: No appliances included
- Bedrooms: Three bedrooms on the main level
- Flooring: Carpet flooring
- Bathrooms: One full bathroom (main level)
- Heating & cooling: Central heating; Central air conditioning
- Interior features: Other interior features; One-level living; No fireplace; Basement: None
- Laundry & utility: Laundry: Other
Neighborhood map
What this means for you Summary
Snapshot
- This is a 3-bed/2.0-bath other listed at $40k.
Deal economics
- At list price, monthly cash flow is $790 ($9k/yr) — positive.
- The deal already cash-flows at list — no discount required.
- Meets the 1% rule at list price ($1k rent vs $40k).
- Recommended offer: $39k (3.0% below list) — sets the bar for market timing.
- Cap rate 30.0% vs local median 5.7% in Fort Valley — top-decile yield for the area; either an underpriced asset or a hidden risk that comps aren't pricing in. Stress-test before assuming the spread holds.
Location & tenants
- Location reads 65/100 on livability (#220 in GA) — a middle-class / working-renter tenant base. Strengths: cost of living A+, health & safety A+, housing A-; Watch: crime D+, amenities F, commute F.
- Peach County (rural): math 17% / reading 25% proficiency, ranked #141 of 174 in GA (top 81%) — low school quality limits family demand, transient renter base, plan for 1-2y turnover; 65% free/reduced lunch — lower-income household profile, screen leases tightly.
- Zoned schools: Hunt Elementary School (math 11% / reading 11%, grade F, #1,071 of 1,228 statewide, top 88%, 640 students, 82% FRL); Fort Valley Middle School (math 11% / reading 19%, grade F, #397 of 470 statewide, top 85%, 481 students, 82% FRL) — zoned schools average 82% FRL vs 65% district-wide (17 pts higher); higher-poverty schools than district average — tighter screening recommended.
- Market conditions: 116 active listings in the ZIP; 149 units permitted in Peach County in 2024 (0 in 5+ unit buildings).
Forward outlook
- Local home prices are declining (-3.0%/yr); year-one equity from $276 of loan paydown is wiped out by about $1k of value loss. Plan a longer hold.
- Peach County population projected at -18% by 2050 — secular population decline; favor cash flow + early exit over multi-decade hold.
- At projected returns (-3.0% appreciation + 3.0% rent growth), your $11k cash investment doubles in ~2 years — after that, you're playing with house money.
Negotiation context
- It's been on market 39 days — a 3% lower offer ($39k) is reasonable based on typical stale-listing flexibility.
- 3 sale attempts with the ask held roughly flat each time — persistent listings suggest the price (not the market) is what's stuck; bring a comps-based counter.
Risks & watch-outs
- Climate carrying-cost: severe wind risk, 80% chance of damaging wind over 30y; moderate wildfire risk; extreme-heat days projected 7→18/yr by 2055 (HVAC capex compounding) — expect insurance premiums to compound above CPI over the hold.
Questions for the listing agent
- It's been on market 39 days. Have you received any prior offers? Is the seller open to a 3% concession, seller financing, or rate buy-down credit?
- Built in 1970 — when were the roof, HVAC, electrical panel, plumbing, and water heater last replaced?
- Is there a deadline driving the sale (1031 exchange, divorce, estate, relocation)? That informs how much negotiation room exists.
- Schools are F-rated, which usually means shorter tenancies and higher turnover. Who's the typical renter profile here, and what's been the actual vacancy rate?
- Crime grade is D in this area — have there been break-ins, vandalism, or insurance claims at this property in the last 3 years? What carrier currently insures it and at what premium?
- What's the average days-on-market for RENTAL listings here right now (not sales)? A rising rental-DOM trend means longer vacancies and softer asking-rent achievability than the comps imply.
- What's the recent tenant-quality profile in this submarket — average credit score on applications, eviction rate, late-payment / NSF rate, and stable-employment percentage? A property-management company in the area should have these aggregated.
- How much new for-sale + rental construction is in the pipeline within 1–3 miles? Heavy new supply typically softens prices + rents 12–24 months out; constrained supply supports both.
Investment metrics
- 1% rule
- 3.38% ✓
- Cap rate
- 30.01%
- Cash-on-cash
- 84.69%
- DSCR
- 4.77
- GRM
- 2.5
CMA / ARV
- ARV (median comp)
- $132,491
- List price
- $39,999
- Delta
- -69.81%
- Verdict
- UNDERPRICED
- Comps
- 6 within 1.0 mi
Projected returns pro-forma
-3.0% appreciation · 3.0% rent growth · sell at horizon
- IRR
- 85.1%
- Equity multiple
- 4.92×
- Total profit
- $43,882
- Equity at exit
- $5,964
- IRR
- 88.3%
- Equity multiple
- 10.21×
- Total profit
- $103,120
- Equity at exit
- $3,458
Cash invested: $11,200 (down + closing). Projections, not guarantees.
Landlord ↔ Tenant lean methodology
- Overall (STATE)
- 90 Strongly Landlord-Friendly
- State Georgia
- 90 Strongly Landlord-Friendly · R+3
- County
- — inherits STATE
- City
- — inherits STATE
ZIP-level market 31030
- Home prices YoY
- -14.7%
- Active inventory
- 116
- Price-to-rent
- 2.5×
Monthly cashflow live
- Estimated rent
- $1,350 medium interval (Pro) →
- Mortgage (P&I)
- −$210
- Tax est. 1.5%
- −$50 /mo · $600/yr
- Insurance
- −$17
- HOA
- −$0
- Vacancy / Maint / Mgmt
- −$284
- Net cashflow
- $790
Break-even live
UW: 25.0% down · 7.5% · 30yr · 1.5% tax · 5.0% vac · 8.0% maint · 8.0% mgmt
Financing live
Cash to close
- Down payment
- $10,000
- Closing costs
- $1,200
- Reserves months
- —
- Total cash needed
- —
Loan-product check · same deal, 3 products live
Conventional
25% down · 7.5% · 30yr
- Down + closing
- —
- Monthly P&I
- —
- Monthly cashflow
- —
- DSCR
- —
- Eligible?
- —
Personal DTI + credit; lowest rate.
DSCR
20% down · 8.5% · 30yr
- Down + closing
- —
- Monthly P&I
- —
- Monthly cashflow
- —
- DSCR
- —
- Eligible?
- —
No personal income docs; deal must DSCR.
Hard money
10% down · 12.0% · 12mo
- Down + closing
- —
- Monthly P&I
- —
- Monthly cashflow
- —
- DSCR
- —
- Eligible?
- —
Short-term bridge; refi at stabilization.
Listing history 21 events
-
2026-06-19days on market $39,999 Active 39 DOM
-
2026-06-18days on market $39,999 Active 38 DOM
-
2026-06-17days on market $39,999 Active 37 DOM
-
2026-06-16days on market $39,999 Active 36 DOM
-
2026-06-15days on market $39,999 Active 35 DOM
-
2026-06-14days on market $39,999 Active 33 DOM
-
2026-06-13days on market $39,999 Active 32 DOM
-
2026-06-10days on market $39,999 Active 30 DOM
-
2026-06-09days on market $39,999 Active 29 DOM
-
2026-06-08days on market $39,999 Active 28 DOM
-
2026-06-07days on market $39,999 Active 27 DOM
-
2026-06-05days on market $39,999 Active 24 DOM
-
2026-06-03days on market $39,999 Active 23 DOM
-
2026-06-02days on market $39,999 Active 22 DOM
-
2026-06-01days on market $39,999 Active 21 DOM
-
2026-05-31days on market $39,999 Active 20 DOM
-
2026-05-30days on market $39,999 Active 19 DOM
-
2026-05-09$39,999 Active 184-char remark
Show marketing remark (184 chars)
This gives You a Chance to Exhibit Your Skills and Display Your Own Masterpiece. The Property has Fire Damage. A Hold Harmless Agreement has to be signed Prior to viewing the Property.
-
2026-05-09$39,999 New 221-char remark
Show marketing remark (184 chars)
This gives You a Chance to Exhibit Your Skills and Display Your Own Masterpiece. The Property has Fire Damage. A Hold Harmless Agreement has to be signed Prior to viewing the Property.
-
2026-03-09historical
-
2025-11-20$47,000 New
ⓘ Source: listings_history table (triggers on properties + properties_extension) + one-shot
backfill from property_details.listing_events for pre-trigger history.
Climate risk First Street
- Flood 1/10 Low FEMA zone X (unshaded) · 0% chance over 30 yrs
- Wildfire 5/10 Major
- Heat 6/10 Major 7 d/yr ≥107°F today · 18 d/yr by 30 yrs out
- Wind 8/10 Severe 80% chance of damaging wind over 30 yrs
- Air quality 3/10 Moderate 2 unhealthy d/yr today · 2 by 30 yrs out
Nearby sold comps map
Loading sold comps map…
Walkable amenities ~0.75 mi
Loading nearby amenities…
Taxation est. · year 1
- Rental income
- $16,206
- − Mortgage interest
- −$2,241
- − Property taxes
- −$600
- − Insurance
- −$200
- − Repairs & maintenance
- −$1,296
- − Management
- −$1,296
- − Depreciation
- −$1,164
- Taxable income
- $9,408
- Est. tax owed @ 24.0%
- −$2,258
- After-tax cash flow
- $7,227/yr
For passive investors: Depreciation is non-cash, so a rental often shows a tax loss while cash-flowing — sheltering income. Rental losses are passive: they offset passive income freely, and up to $25,000/yr can offset ordinary (W-2) income if you actively participate and your MAGI is under $100k (phasing out to $0 by $150k); unused losses carry forward. On sale, claimed depreciation is recaptured at up to 25%, and gains may owe capital-gains tax (a 1031 exchange can defer both). Figures are a year-1 estimate at your 24.0% rate — not tax advice; consult a CPA.
Schools (NCES district)
- District
- Peach County
- NCES district ID
- 1304050
- Math proficiency
- 17% ▼ -15.00%
- Reading proficiency
- 25% ▼ -5.00%
- Median HH income
- $41,348
- Composite
- 17.89/100
- National rank
- #9000
- State rank
- #141 of 174 in GA
Livability — Fort Valley
- Score
- 65/100
- State rank
- #220
- US rank
- #12957
Category grades
Schools grade is shown separately in the Schools card above.
Census & demographics
- City population
- 17,987
- Population (ZIP)
- 17,987
Population outlook (Peach County) Hauer SSP2
- Today (2025)
- 26,481 people
- By 2030
- 25,723 · -2.9%
- By 2040
- 23,812 · -10.1%
- By 2050
- 21,724 · -18.0%
- By 2075
- 17,513 · -33.9%
- By 2100
- 14,235 · -46.2%
Race, ethnicity, and origin ACS 2023
- Neighborhood character
- Diverse neighborhood (Simpson 0.62)
- Race & ethnicity
- Black 49% White 35% Hispanic / Latino 12% Two or more races 5% Native American 1%
- Hispanic origin (detail)
- Mexican 9% Cuban 2%
- Common ancestry
- Romanian 1% Italian 1% Serbian 1%
- Foreign-born
- 7% · Canada
- Languages at home
- 90% English-only · Spanish 8%
Political lean MEDSL · Peach
- 2024 margin
- Lean R (+6.0) · D 46.8% · R 52.8%
- 2008→2024 swing
- -12.8pp toward R · 2008: 6.8pp · 2024: -6.0pp
- All cycles
- 2024: R+6.0 2020: R+4.7 2016: R+3.0 2012: D+7.5 2008: D+6.8
Not yet ingested
- Civics
- —
Market trends
- HPI YoY
- ▼ -34.82%
- Current HPI
- 202.0025
- Rent YoY
- —
- Metro
- —
- State GDP YoY
- ▲ 2.66%
- F500 in state
- 28
Industry mix (Fortune 500 HQ in GA)
| Industry | F500 HQs | Revenue |
|---|---|---|
| Paper / Packaging | 2 | $29B |
|
||
| Retail | 1 | $160B |
|
||
| Transportation / Logistics | 1 | $91B |
|
||
| Airlines | 1 | $62B |
|
||
| Consumer Goods | 1 | $47B |
|
||
| Utilities | 1 | $25B |
|
||
Price history
-14.9% since first listed4 events — show timeline
- 2026-05-09 Listed $39,999 CGMLS
- 2026-05-09 Listed $39,999 GAMLS
- 2026-03-09 Listing Removed — GAMLS
- 2025-11-20 Listed $47,000 GAMLS
Property tax history
-9.9%/yrLatest (2025): $42 · -3.0% YoY. Source: county tax records.
Cash-flow waterfall
monthlySold comps — $/sqft
last 12 mo · ≤1 miLoading sold comps…