 🌊 Lakefront
12100 Melville Dr Unit 708G · Conroe, TX
Flood risk 4/10 · Minor
- FEMA flood zone
- X (unshaded)
- Chance of flooding over 30 yrs
- 0.24%
- Est. flood insurance / yr
- $507 – $1,088
Fire risk 1/10 · Minimal
- Est. fire insurance / yr
- $1,222 – $2,270
Heat risk 8/10 · Major
- Hot days now (above 110°F)
- 7 days/yr
- Hot days in 30 yrs
- 24 days/yr
Wind risk 8/10 · Major
- Chance of severe wind over 30 yrs
- 99.0%
Air-quality risk 2/10 · Minimal
- Unhealthy air days now
- 1 days/yr
- Unhealthy air days in 30 yrs
- 1 days/yr
Risk factors via First Street. Map © Google.
Why this score? — see what drove the C+ grade
The composite is a weighted blend of 9 inputs, each scored 0–100. Each bar is that input's sub-score; the figure is the points it added to the 100-point composite (weight × sub-score).
- Cash flow +25.7/30.0
- DSCR +8.6/10.0
- ARV discount +8.3/15.0
- 1% rule +6.6/10.0
- Schools +5.4/10.0
- Livability +3.7/5.0
- Condition / age +2.5/5.0
- Rent growth +1.7/5.0
- Appreciation +0.0/10.0
$150,000
🖨 Deal sheet (PDF) 📄 Offer letter ✓ Due diligence
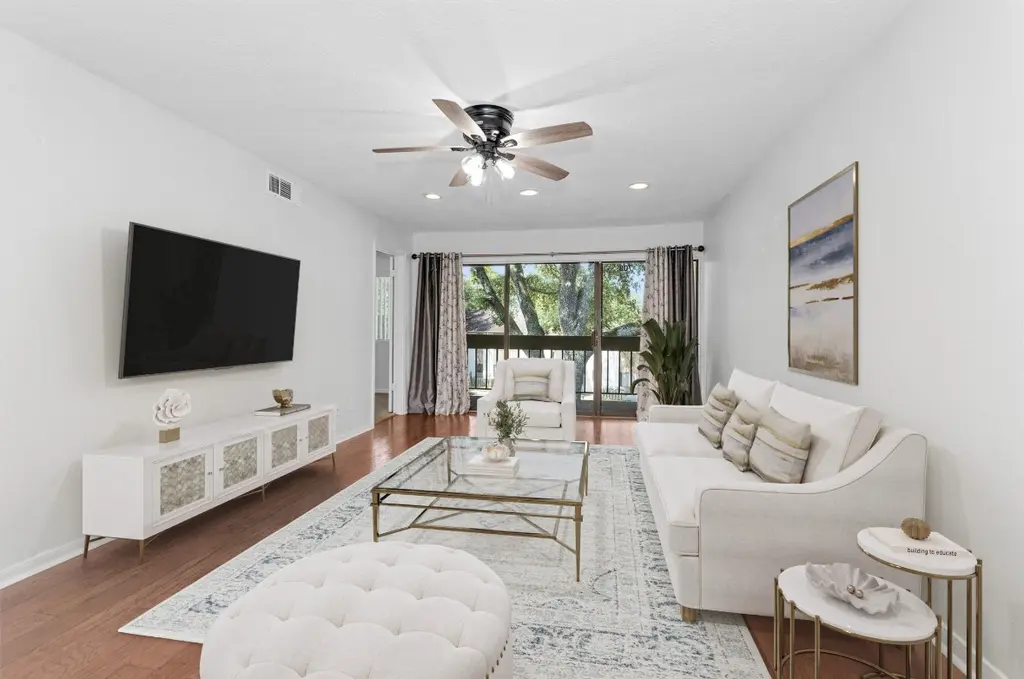
Listing remarks
Perfect LAKE CONROE LIVING or INVESTMENT PROPERTY! Offering 2 bedrooms and 2 full baths, this home has been thoughtfully updated throughout. The kitchen features quartzite countertops and opens directly to the living area, creating an inviting space for entertaining or everyday living. The spacious primary suite includes a walk-in closet, quartzite vanity, and a tub/shower with an updated tile surround. The guest bath has also been redone with a sleek walk-in shower with modern finishes. Fresh paint and abundant natural light give the home a bright, open feel, while laminate flooring in the main areas and like-new carpet in the bedrooms make upkeep simple. Walden residents enjoy access to c
Key facts
- Dog park
- Walk in closet
- Walk in shower
Tags
Property features AI
Finance
- Financial info: Leases considered
- HOA & community: Walden Community Improvement Association; Annual association fee; Association amenities: basketball court, boat dock, marina, boat ramp, clubhouse, sport court, dog park, fitness center, golf course, maintained grounds, meeting/banquet/party room, party room, picnic area, playground, pickleball, park, pool, boat slip, tennis courts, trails, trash service; Association fee covers common areas, insurance, structure maintenance, recreation facilities, and trash
Exterior
- Parking: Additional parking; Unassigned parking; No assigned parking
- Security: Smoke detectors
- Utilities: Public water; Public sewer
- Home design: Residential property; East-facing; 2-story; Full ownership; Entry level not specified
- Construction: Built in 1979; Cement siding; Wood siding; Composition roof; Slab foundation
- Exterior features: Balcony; Deck; Patio; Association pool
Interior
- Kitchen: Dishwasher; Electric oven; Electric range; Disposal; Microwave; Oven; Refrigerator
- Bedrooms: 2 possible bedrooms
- Flooring: Carpet
- Bathrooms: 2 full bathrooms
- Heating & cooling: Central heating (electric); Central air (electric)
- Interior features: Breakfast bar; Balcony; Kitchen/family room combo; Quartzite counters; Tub with shower; Window treatments; Ceiling fans; Window coverings
- Laundry & utility: Laundry in utility room; Stacked washer/dryer; Washer; Dryer
Neighborhood map
What this means for you Summary
Snapshot
- This is a 2-bed/2.0-bath other listed at $150k.
Deal economics
- At list price, monthly cash flow is $358 ($4k/yr) — positive.
- The deal already cash-flows at list — no discount required.
- Meets the 1% rule at list price ($2k rent vs $150k).
- Cap rate 9.2% vs local median 3.1% in Conroe — top-decile yield for the area; either an underpriced asset or a hidden risk that comps aren't pricing in. Stress-test before assuming the spread holds.
Location & tenants
- Location reads 74/100 on livability (#169 in TX, #4,447 nationally) — a middle-class / working-renter tenant base. Strengths: cost of living A+, housing A+, amenities B; Watch: commute F, health & safety F.
- Montgomery ISD (rural): math 63% / reading 57% proficiency, ranked #49 of 826 in TX (top 6%) — acceptable for families but not a draw, mixed tenant base, ~2y average lease.
- Zoned schools: Madeley Ranch El (math 59% / reading 55%, grade C+, #505 of 4,322 statewide, top 13%, 786 students, 26% FRL); Montgomery J H (math 68% / reading 54%, grade B+, #145 of 1,662 statewide, top 9%, 1,045 students, 30% FRL); Montgomery H S (math 53% / reading 62%, grade C, #327 of 1,632 statewide, top 20%, 1,556 students, 25% FRL) — zoned schools at 27% FRL track the district average.
- Market conditions: Rents falling (-3.3%/yr); 1056 active listings in the ZIP; 3 comparable units currently listed for rent nearby; rentals lingering (median 44d on market — plan ~5-8 weeks vacancy on turnover, expect pricing pressure); 100% of comp listings sitting > 30 days — soft ceiling on asking rent; solid renter incomes; 13,259 units permitted in Montgomery County in 2024 (1,402 in 5+ unit buildings).
Forward outlook
- Local home prices are declining (-3.0%/yr); year-one equity from $1k of loan paydown is wiped out by about $4k of value loss. Plan a longer hold.
- Montgomery County population projected at +65% by 2050 — long-run rental-demand tailwind backs the buy-and-hold thesis.
Negotiation context
- Only 8 days on market — expect competitive offers; lowballing is unlikely to land.
- 9 sale attempts since 2y ago with the ask held roughly flat each time — persistent listings suggest the price (not the market) is what's stuck; bring a comps-based counter.
Risks & watch-outs
- Climate carrying-cost: severe wind risk, 99% chance of damaging wind over 30y; extreme-heat days projected 7→24/yr by 2055 (HVAC capex compounding) — expect insurance premiums to compound above CPI over the hold.
Questions for the listing agent
- Built in 1979 — when were the roof, HVAC, electrical panel, plumbing, and water heater last replaced?
- What does the HOA fee cover, when was the last increase, and are there any pending special assessments or reserve-fund shortfalls?
- Is there a deadline driving the sale (1031 exchange, divorce, estate, relocation)? That informs how much negotiation room exists.
- Schools are D-rated, which usually means shorter tenancies and higher turnover. Who's the typical renter profile here, and what's been the actual vacancy rate?
- This sits on a lake — are riparian / water-frontage rights deeded with the parcel? Any dock permits, shoreline easements, or HOA water-use restrictions?
- What's the documented flood / surge / shoreline-erosion history here (FEMA AND non-FEMA — e.g., storm surge, creek backup, septic-field saturation)?
- Any water-quality or seasonal algae-bloom issues that affect tenant satisfaction or short-term-rental demand?
- What's the average days-on-market for RENTAL listings here right now (not sales)? A rising rental-DOM trend means longer vacancies and softer asking-rent achievability than the comps imply.
- What's the recent tenant-quality profile in this submarket — average credit score on applications, eviction rate, late-payment / NSF rate, and stable-employment percentage? A property-management company in the area should have these aggregated.
- How much new for-sale + rental construction is in the pipeline within 1–3 miles? Heavy new supply typically softens prices + rents 12–24 months out; constrained supply supports both.
Investment metrics
- 1% rule
- 1.16% ✓
- Cap rate
- 9.16%
- Cash-on-cash
- 10.23%
- DSCR
- 1.46
- GRM
- 7.2
CMA / ARV
- ARV (median comp)
- $152,679
- List price
- $150,000
- Delta
- -1.75%
- Verdict
- FAIR
- Comps
- 20 within 1.0 mi
Projected returns pro-forma
-3.0% appreciation · 0.0% rent growth · sell at horizon
- IRR
- -4.3%
- Equity multiple
- 0.84×
- Total profit
- $-6,573
- Equity at exit
- $22,365
- IRR
- 1.6%
- Equity multiple
- 1.10×
- Total profit
- $4,051
- Equity at exit
- $12,969
Cash invested: $42,000 (down + closing). Projections, not guarantees.
Landlord ↔ Tenant lean methodology
- Overall (STATE)
- 87 Strongly Landlord-Friendly
- State Texas
- 87 Strongly Landlord-Friendly · R+5
- County
- — inherits STATE
- City
- — inherits STATE
ZIP-level market 77356
- Home prices YoY
- -30.3%
- Rents YoY
- -3.3%
- Active inventory
- 1056
- Price-to-rent
- 7.2×
Monthly cashflow live
- Estimated rent
- $1,733 medium interval (Pro) →
- Mortgage (P&I)
- −$787
- Tax from tax record
- −$66 /mo · $792/yr
- Insurance
- −$62
- HOA
- −$96
- Vacancy / Maint / Mgmt
- −$364
- Net cashflow
- $358
Break-even live
Sensitivity live
| Price | -10% $443 | -5% $400 | +0% $358 | +5% $316 | +10% $273 |
|---|---|---|---|---|---|
| Rent | -10% $221 | -5% $290 | +0% $358 | +5% $426 | +10% $495 |
| Rate | -1.0pp $434 | -0.5pp $396 | base $358 | +0.5pp $319 | +1.0pp $280 |
UW: 25.0% down · 7.5% · 30yr · 1.5% tax · 5.0% vac · 8.0% maint · 8.0% mgmt
Financing live
Cash to close
- Down payment
- $37,500
- Closing costs
- $4,500
- Reserves months
- —
- Total cash needed
- —
Loan-product check · same deal, 3 products live
Conventional
25% down · 7.5% · 30yr
- Down + closing
- —
- Monthly P&I
- —
- Monthly cashflow
- —
- DSCR
- —
- Eligible?
- —
Personal DTI + credit; lowest rate.
DSCR
20% down · 8.5% · 30yr
- Down + closing
- —
- Monthly P&I
- —
- Monthly cashflow
- —
- DSCR
- —
- Eligible?
- —
No personal income docs; deal must DSCR.
Hard money
10% down · 12.0% · 12mo
- Down + closing
- —
- Monthly P&I
- —
- Monthly cashflow
- —
- DSCR
- —
- Eligible?
- —
Short-term bridge; refi at stabilization.
Rent comps 3 comps
| Address | Beds | Baths | Sqft | Rent | $/sqft | DOM | Units | Dist |
|---|---|---|---|---|---|---|---|---|
| 12100 Melville Dr Montgomery, TX | 2.0 | 2.0 | 964 | $1,750 | $1.82 | 44d | 2 | 0.04mi |
| 12500 Melville Dr Unit 317B Montgomery, TX | 2.0 | 2.0 | 902 | $1,550 | $1.72 | 44d | 1 | 0.23mi |
| 12500 Melville Dr Unit 227C Montgomery, TX | 2.0 | 2.0 | 917 | $1,700 | $1.85 | 44d | 1 | 0.23mi |
HOA detail
- Monthly dues
- $96 · $1,152/yr
Listing history 28 events
-
2026-06-18days on market $150,000 Active 8 DOM
-
2026-06-17days on market $150,000 Active 7 DOM
-
2026-06-16days on market $150,000 Active 6 DOM
-
2026-06-15days on market $150,000 Active 5 DOM
-
2026-06-13days on market $150,000 Active 3 DOM
-
2026-06-13days on market $150,000 Active 2 DOM
-
2026-06-08days on market $150,000 Active 80 DOM
-
2026-06-07days on market $150,000 Active 79 DOM
-
2026-06-04days on market $150,000 Active 76 DOM
-
2026-06-03days on market $150,000 Active 75 DOM
-
2026-06-02days on market $150,000 Active 74 DOM
-
2026-06-01days on market $150,000 Active 73 DOM
-
2026-05-31days on market $150,000 Active 72 DOM
-
2026-05-12price $150,000 936-char remark
-
2026-03-20$160,000 Active 936-char remark
-
2026-03-20historical
-
2026-03-14historical $1,400
-
2026-01-28$165,000 Active
-
2026-01-28historical
-
2026-01-01$1,400
-
2025-12-21historical $1,400
-
2025-12-18$1,400
-
2025-12-10historical $1,400
-
2025-11-22$1,400
-
2025-09-12$165,000 Active
-
2024-10-03soldstatus Sold
-
2024-09-19status Pending
-
2024-08-15$155,000 Active
ⓘ Source: listings_history table (triggers on properties + properties_extension) + one-shot
backfill from property_details.listing_events for pre-trigger history.
Tax reassessment forecast TX · Resets to sale price
- Current annual tax
- $792 · $66/mo
- Projected year-2 tax
- $2,745 · $229/mo
- Expected delta
- +$1,953/yr (+$163/mo · 246.4%)
ⓘ Screening estimate from a state-policy table — verify with the county assessor before closing.
Climate risk First Street
- Flood 4/10 Moderate FEMA zone X (unshaded) · 24% chance over 30 yrs
- Wildfire 1/10 Low
- Heat 8/10 Severe 7 d/yr ≥110°F today · 24 d/yr by 30 yrs out
- Wind 8/10 Severe 99% chance of damaging wind over 30 yrs
- Air quality 2/10 Low 1 unhealthy d/yr today · 1 by 30 yrs out
Nearby sold comps map
Loading sold comps map…
Walkable amenities ~0.75 mi
Loading nearby amenities…
Taxation est. · year 1
- Rental income
- $20,797
- − Mortgage interest
- −$8,402
- − Property taxes
- −$792
- − Insurance
- −$750
- − Repairs & maintenance
- −$1,664
- − Management
- −$1,664
- − HOA
- −$1,152
- − Depreciation
- −$4,364
- Taxable income
- $2,009
- Est. tax owed @ 24.0%
- −$482
- After-tax cash flow
- $3,814/yr
For passive investors: Depreciation is non-cash, so a rental often shows a tax loss while cash-flowing — sheltering income. Rental losses are passive: they offset passive income freely, and up to $25,000/yr can offset ordinary (W-2) income if you actively participate and your MAGI is under $100k (phasing out to $0 by $150k); unused losses carry forward. On sale, claimed depreciation is recaptured at up to 25%, and gains may owe capital-gains tax (a 1031 exchange can defer both). Figures are a year-1 estimate at your 24.0% rate — not tax advice; consult a CPA.
Schools (NCES district)
- District
- Montgomery ISD
- NCES district ID
- 4831260
- Math proficiency
- 63% ▼ -3.00%
- Reading proficiency
- 57% ▼ -3.00%
- Median HH income
- $75,596
- Composite
- 53.55/100
- National rank
- #1445
- State rank
- #49 of 826 in TX
Livability — Conroe
- Score
- 74/100
- State rank
- #169
- US rank
- #4447
Category grades
Schools grade is shown separately in the Schools card above.
Census & demographics
- County
- Montgomery County · 663,713 people
- City population
- 205,417
- Metro
- Houston-The Woodlands-Sugar Land, TX
- Population (ZIP)
- 32,583
- Household income
- $106,804
- Rent vs Own
- Severe rent burden
- 414.0
Population outlook (Montgomery County) Hauer SSP2
- Today (2025)
- 713,896 people
- By 2030
- 805,263 · +12.8%
- By 2040
- 992,708 · +39.1%
- By 2050
- 1,179,590 · +65.2%
- By 2075
- 1,628,084 · +128.1%
- By 2100
- 1,937,880 · +171.5%
Race, ethnicity, and origin ACS 2023
- Neighborhood character
- Predominantly White (87%)
- Race & ethnicity
- White 87% Two or more races 5% Hispanic / Latino 5% Black 4%
- Common ancestry
- Lithuanian 8% Slovak 2% Romanian 2%
- Foreign-born
- 3% · Canada, China
- Languages at home
- 96% English-only · Spanish 3%
Political lean MEDSL · Montgomery
- 2024 margin
- Solid R (+45.5) · D 26.8% · R 72.3%
- 2008→2024 swing
- +7.2pp toward D · 2008: -52.7pp · 2024: -45.5pp
- All cycles
- 2024: R+45.5 2020: R+43.8 2016: R+51.4 2012: R+60.7 2008: R+52.7
Not yet ingested
- Civics
- —
Market trends
- HPI YoY
- ▼ -101.28%
- Current HPI
- 233.0032
- Rent YoY
- ▼ -3.30%
- Metro
- Houston-The Woodlands-Sugar Land, TX
- State GDP YoY
- ▲ 3.95%
- F500 in state
- 110
Industry mix (Fortune 500 HQ in TX)
| Industry | F500 HQs | Revenue |
|---|---|---|
| Energy | 16 | $1,198B |
|
||
| Technology | 5 | $198B |
|
||
| Engineering / Construction | 4 | $72B |
|
||
| Energy Services | 3 | $60B |
|
||
| Utilities | 3 | $41B |
|
||
| Healthcare | 2 | $330B |
|
||
Price history
-3.2% since first listed19 events — show timeline
- 2026-06-10 Listed $150,000 HARMLS
- 2026-06-08 Listing Removed — HARMLS
- 2026-06-01 Rental Removed $1,400 HARMLS
- 2026-05-26 Listed for Rent $1,400 HARMLS
- 2026-05-12 Price Changed $150,000 HARMLS
- 2026-03-20 Listing Removed — HARMLS
- 2026-03-20 Listed $160,000 HARMLS
- 2026-03-14 Rental Removed $1,400 HARMLS
- 2026-01-28 Listing Removed — HARMLS
- 2026-01-28 Listed $165,000 HARMLS
- 2026-01-01 Listed for Rent $1,400 HARMLS
- 2025-12-21 Rental Removed $1,400 HARMLS
- 2025-12-18 Listed for Rent $1,400 HARMLS
- 2025-12-10 Rental Removed $1,400 HARMLS
- 2025-11-22 Listed for Rent $1,400 HARMLS
- 2025-09-12 Listed $165,000 HARMLS
- 2024-10-03 Sold (MLS) — HARMLS
- 2024-09-19 Pending — HARMLS
- 2024-08-15 Listed $155,000 HARMLS
Cash-flow waterfall
monthlySold comps — $/sqft
last 12 mo · ≤1 miLoading sold comps…