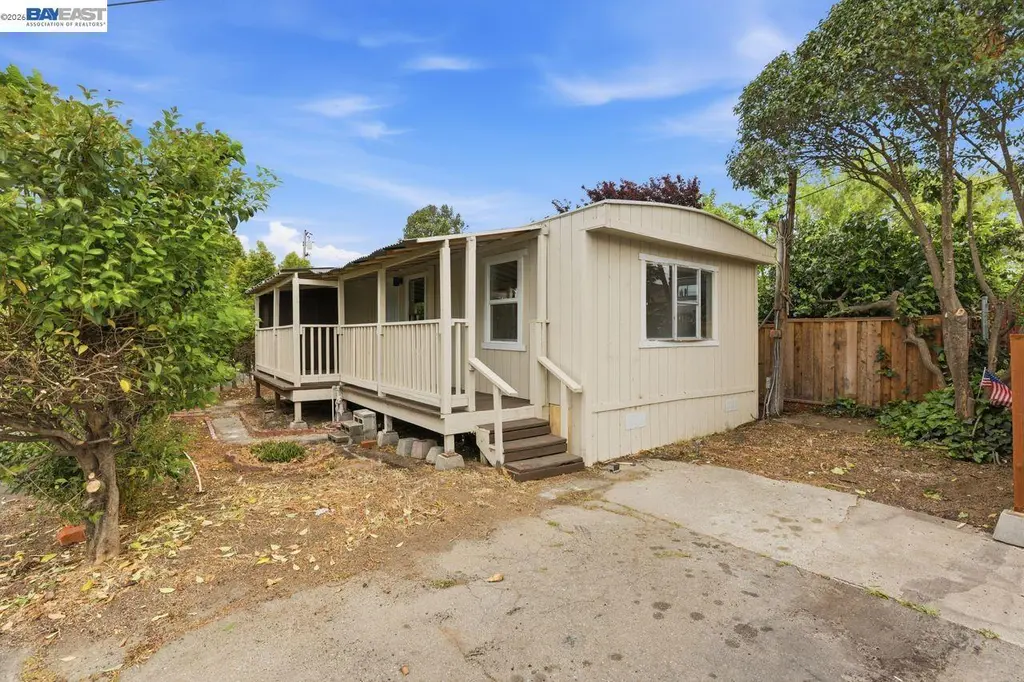
828 Olivina Ave #11 · Livermore, CA
Flood risk 1/10 · Minimal
- FEMA flood zone
- X (unshaded)
- Chance of flooding over 30 yrs
- 0.0%
- Est. flood insurance / yr
- $507 – $1,088
Fire risk 4/10 · Minor
- Est. fire insurance / yr
- $659 – $1,223
Heat risk 5/10 · Moderate
- Hot days now (above 97°F)
- 7 days/yr
- Hot days in 30 yrs
- 14 days/yr
Wind risk 1/10 · Minimal
- Chance of severe wind over 30 yrs
- —
Air-quality risk 9/10 · Severe
- Unhealthy air days now
- 20 days/yr
- Unhealthy air days in 30 yrs
- 21 days/yr
Risk factors via First Street. Map © Google.
Why this score? — see what drove the B grade
The composite is a weighted blend of 9 inputs, each scored 0–100. Each bar is that input's sub-score; the figure is the points it added to the 100-point composite (weight × sub-score).
- Cash flow +30.0/30.0
- DSCR +10.0/10.0
- 1% rule +9.8/10.0
- ARV discount +6.1/15.0
- Schools +5.1/10.0
- Livability +4.2/5.0
- Rent growth +2.6/5.0
- Condition / age +2.5/5.0
- Appreciation +0.0/10.0
$164,888
🖨 Deal sheet 📄 Offer letter ✓ Due diligence
Listing remarks MLS
This stunning, fully remodeled mobile home nestled in one of Livermore’s most desirable all-age communities. This move-in-ready gem combines modern comfort with unbeatable convenience — just minutes from vibrant downtown Livermore, award-winning wineries, top-rated schools, shopping, and easy freeway access. Step inside to discover a bright, open layout with brand-new finishes throughout, including luxury vinyl plank flooring, fresh designer paint, and stylish fixtures. The spacious kitchen boasts updated cabinetry, sleek countertops, and stainless steel appliances, making it perfect for cooking and entertaining. The bathrooms are beautifully upgraded with elegant tile work and contemporary vanities, adding a touch of everyday luxury. Enjoy peace of mind with a well-maintained property, private outdoor space for relaxing or gardening, and a community that welcomes all ages — ideal for first-time buyers, families, or those looking to downsize without compromise. This is modern Livermore living at an incredible value — a rare opportunity to own a turnkey home close to everything that makes the area so special. *Seller Financing Available*
Key facts
- Bright open layout
- Updated cabinetry
- Elegant tile work
Tags
Neighborhood map
What this means for you Summary
Snapshot
- This is a 2-bed/2.0-bath manufactured listed at $165k.
Deal economics
- At list price, monthly cash flow is $790 ($9k/yr) — positive.
- The deal already cash-flows at list — no discount required.
- Meets the 1% rule at list price ($2k rent vs $165k).
- Recommended offer: $155k (6.0% below list) — sets the bar for market timing.
- Cap rate 12.0% vs local median 1.6% in Livermore — top-decile yield for the area; either an underpriced asset or a hidden risk that comps aren't pricing in. Stress-test before assuming the spread holds.
Location & tenants
- Location reads 83/100 on livability (#21 in CA, #846 nationally) — a professional / high-income tenant draw. Strengths: amenities A+, commute A+, employment A+; Watch: cost of living F.
- Livermore Valley Joint Unified (suburban): math 46% / reading 61% proficiency, ranked #90 of 517 in CA (top 17%) — acceptable for families but not a draw, mixed tenant base, ~2y average lease.
- Market conditions: Rents flat; 215 active listings in the ZIP; 19 comparable units currently listed for rent nearby; rentals at typical pace (median 25d on market — plan ~3-4 weeks tenant-placement turnaround); 47% of comp listings sitting > 30 days — soft ceiling on asking rent; high-income renter base; 1,742 units permitted in Alameda County in 2024 (856 in 5+ unit buildings).
Forward outlook
- Local home prices are declining (-3.0%/yr); year-one equity from $1k of loan paydown is wiped out by about $5k of value loss. Plan a longer hold.
- Alameda County population projected at +34% by 2050 — long-run rental-demand tailwind backs the buy-and-hold thesis.
- At projected returns (-3.0% appreciation + 0.5% rent growth), your $46k cash investment doubles in ~8 years — after that, you're playing with house money.
Negotiation context
- It's been on market 77 days — a 6% lower offer ($155k) is reasonable based on typical stale-listing flexibility.
Risks & watch-outs
- Climate carrying-cost: extreme-heat days projected 7→14/yr by 2055 (HVAC capex compounding) — expect insurance premiums to compound above CPI over the hold.
Questions for the listing agent
- It's been on market 77 days. Have you received any prior offers? Is the seller open to a 6% concession, seller financing, or rate buy-down credit?
- Why hasn't it sold? Are there any deal-killer items the seller is aware of (foundation, flood, title, zoning, code violations)?
- Is there a deadline driving the sale (1031 exchange, divorce, estate, relocation)? That informs how much negotiation room exists.
- Schools are A-rated — typically a magnet for longer-tenancy family renters. What's the average tenant stay here, and is there a school-zone premium baked into asking?
- What's the average days-on-market for RENTAL listings here right now (not sales)? A rising rental-DOM trend means longer vacancies and softer asking-rent achievability than the comps imply.
- What's the recent tenant-quality profile in this submarket — average credit score on applications, eviction rate, late-payment / NSF rate, and stable-employment percentage? A property-management company in the area should have these aggregated.
- How much new for-sale + rental construction is in the pipeline within 1–3 miles? Heavy new supply typically softens prices + rents 12–24 months out; constrained supply supports both.
Investment metrics
- 1% rule
- 1.48% ✓
- Cap rate
- 12.04%
- Cash-on-cash
- 20.52%
- DSCR
- 1.91
- GRM
- 5.6
CMA / ARV
- ARV (on-the-fly)
- $159,936
- Comps found
- 1
Show comp detail 1 sale within ~0.75 mi
| Address | Dist | Beds/Ba | Sqft | Sold | Price | $/sf | Match |
|---|---|---|---|---|---|---|---|
| 828 Olivina #16 | 0.02mi | 2/1.5 | 672 (0%) | 18mo | $160,000 | $238 | 82 |
Match score weights: distance 35% · size 25% · config 20% · recency 20%. Top-matched comps best support the ARV.
Projected returns pro-forma
-3.0% appreciation · 0.5% rent growth · sell at horizon
- IRR
- 10.0%
- Equity multiple
- 1.38×
- Total profit
- $17,617
- Equity at exit
- $24,585
- IRR
- 16.9%
- Equity multiple
- 2.23×
- Total profit
- $56,858
- Equity at exit
- $14,257
Cash invested: $46,169 (down + closing). Projections, not guarantees.
Landlord ↔ Tenant lean methodology
- Overall (STATE)
- 18 Strongly Tenant-Friendly
- State California
- 18 Strongly Tenant-Friendly · D+13
- County
- — inherits STATE
- City
- — inherits STATE
ZIP-level market 94551
- Rents YoY
- 0.5%
- Active inventory
- 215
- Price-to-rent
- 5.6×
Monthly cashflow live
- Estimated rent
- $2,442 high interval (Pro) →
- Mortgage (P&I)
- −$865
- Tax est. 1.5%
- −$206 /mo · $2,473/yr
- Insurance
- −$69
- HOA
- −$0
- Vacancy / Maint / Mgmt
- −$513
- Net cashflow
- $790
Break-even live
UW: 25.0% down · 7.5% · 30yr · 1.5% tax · 5.0% vac · 8.0% maint · 8.0% mgmt
Financing live
Cash to close
- Down payment
- $41,222
- Closing costs
- $4,947
- Reserves months
- —
- Total cash needed
- —
Loan-product check · same deal, 3 products live
Conventional
25% down · 7.5% · 30yr
- Down + closing
- —
- Monthly P&I
- —
- Monthly cashflow
- —
- DSCR
- —
- Eligible?
- —
Personal DTI + credit; lowest rate.
DSCR
20% down · 8.5% · 30yr
- Down + closing
- —
- Monthly P&I
- —
- Monthly cashflow
- —
- DSCR
- —
- Eligible?
- —
No personal income docs; deal must DSCR.
Hard money
10% down · 12.0% · 12mo
- Down + closing
- —
- Monthly P&I
- —
- Monthly cashflow
- —
- DSCR
- —
- Eligible?
- —
Short-term bridge; refi at stabilization.
Rent comps 19 comps
| Address | Beds | Baths | Sqft | Rent | $/sqft | DOM | Units | Dist |
|---|---|---|---|---|---|---|---|---|
| 358 Albatross Ave Unit 1 Livermore, CA | 1.0 | 1.0 | 450 | $2,200 | $4.89 | 44d | 1 | 0.04mi |
| 981 Marylin Ave Unit ADU Livermore, CA | 1.0 | 1.0 | 500 | $2,100 | $4.20 | 44d | 1 | 0.14mi |
| 975 Murrieta Blvd #10 Livermore, CA | 1.0 | 1.0 | 690 | $2,100 | $3.04 | 44d | 1 | 0.55mi |
| 1001 Murrieta Blvd Unit 98 Livermore, CA | 1.0 | 1.0 | 674 | $2,150 | $3.19 | 2d | 1 | 0.55mi |
| 1009 Murrieta Blvd Livermore, CA | 1.0 | 1.0 | 669 | $1,900 | $2.84 | 24d | 1 | 0.56mi |
| 1229 4th St Livermore, CA | 2.0 | 1.0 | 750 | $2,595 | $3.46 | 44d | 1 | 0.62mi |
| 1809 Railroad Ave Livermore, CA | 1.0–2.0 | 1.0–2.0 | 809 | $3,481 | $4.30 | 2d | 11 | 0.65mi |
| 1461 5th St Livermore, CA | 1.0 | 1.0 | 600 | $2,100 | $3.50 | 44d | 1 | 0.72mi |
| 1351 N P St Unit 2 Livermore, CA | 1.0 | 1.0 | 600 | $1,800 | $3.00 | 44d | 1 | 0.75mi |
| 1738 4th St Livermore, CA | 1.0 | 1.0 | 500 | $1,725 | $3.45 | 44d | 1 | 0.77mi |
| 57 S L St Livermore, CA | 1.0–2.0 | 1.0–2.0 | 1010 | $4,716 | $4.67 | 2d | 12 | 0.78mi |
| 1160 Portola Meadows Rd Livermore, CA | 1.0–2.0 | 1.0–2.0 | 807 | $2,800 | $3.47 | 2d | 6 | 0.83mi |
| 434 Junction Ave Livermore, CA | 1.0 | 1.0 | 420 | $1,975 | $4.70 | 2d | 1 | 1.01mi |
| 277 Junction Ave Livermore, CA | 2.0 | 1.0 | 649 | $2,275 | $3.51 | 44d | 1 | 1.07mi |
| 277 Junction Ave Livermore, CA | 2.0 | 1.0 | 649 | $2,275 | $3.51 | 2d | 1 | 1.07mi |
| 281 Junction Ave Apt H Livermore, CA | 2.0 | 1.0 | 650 | $2,275 | $3.50 | 44d | 1 | 1.08mi |
| 1038 Catalina Dr Livermore, CA | 1.0 | 1.0 | 559 | $2,175 | $3.89 | 2d | 1 | 1.37mi |
| 1669 Catalina Ct Livermore, CA | 1.0–2.0 | 1.0 | 673 | $2,350 | $3.49 | 2d | 2 | 1.45mi |
| 1826 Cordoba St Unit 52 Livermore, CA | 1.0 | 1.0 | 580 | $1,895 | $3.27 | 22d | 1 | 1.48mi |
Listing history 15 events
-
2026-06-18days on market $164,888 Active 77 DOM
-
2026-06-17days on market $164,888 Active 76 DOM
-
2026-06-16days on market $164,888 Active 75 DOM
-
2026-06-15days on market $164,888 Active 74 DOM
-
2026-06-13days on market $164,888 Active 72 DOM
-
2026-06-13pricedays on market $164,888 Active 71 DOM
-
2026-06-09days on market $169,888 Active 68 DOM
-
2026-06-08days on market $169,888 Active 67 DOM
-
2026-06-07days on market $169,888 Active 66 DOM
-
2026-06-04days on market $169,888 Active 63 DOM
-
2026-06-03days on market $169,888 Active 62 DOM
-
2026-06-02days on market $169,888 Active 61 DOM
-
2026-06-01days on market $169,888 Active 60 DOM
-
2026-05-31days on market $169,888 Active 59 DOM
-
2026-04-02$169,888 Active 1178-char remark
Show marketing remark (1178 chars)
This stunning, fully remodeled mobile home nestled in one of Livermore’s most desirable all-age communities. This move-in-ready gem combines modern comfort with unbeatable convenience — just minutes from vibrant downtown Livermore, award-winning wineries, top-rated schools, shopping, and easy freeway access. Step inside to discover a bright, open layout with brand-new finishes throughout, including luxury vinyl plank flooring, fresh designer paint, and stylish fixtures. The spacious kitchen boasts updated cabinetry, sleek countertops, and stainless steel appliances, making it perfect for cooking and entertaining. The bathrooms are beautifully upgraded with elegant tile work and contemporary vanities, adding a touch of everyday luxury. Enjoy peace of mind with a well-maintained property, private outdoor space for relaxing or gardening, and a community that welcomes all ages — ideal for first-time buyers, families, or those looking to downsize without compromise. This is modern Livermore living at an incredible value — a rare opportunity to own a turnkey home close to everything that makes the area so special. *Seller Financing Available*
ⓘ Source: listings_history table (triggers on properties + properties_extension) + one-shot
backfill from property_details.listing_events for pre-trigger history.
Climate risk First Street
- Flood 1/10 Low FEMA zone X (unshaded) · 0% chance over 30 yrs
- Wildfire 4/10 Moderate
- Heat 5/10 Major 7 d/yr ≥97°F today · 14 d/yr by 30 yrs out
- Wind 1/10 Low
- Air quality 9/10 Extreme 20 unhealthy d/yr today · 21 by 30 yrs out
Nearby sold comps map
Loading sold comps map…
Walkable amenities ~0.75 mi
Loading nearby amenities…
Taxation est. · year 1
- Rental income
- $29,303
- − Mortgage interest
- −$9,236
- − Property taxes
- −$2,473
- − Insurance
- −$824
- − Repairs & maintenance
- −$2,344
- − Management
- −$2,344
- − Depreciation
- −$4,797
- Taxable income
- $7,284
- Est. tax owed @ 24.0%
- −$1,748
- After-tax cash flow
- $7,727/yr
For passive investors: Depreciation is non-cash, so a rental often shows a tax loss while cash-flowing — sheltering income. Rental losses are passive: they offset passive income freely, and up to $25,000/yr can offset ordinary (W-2) income if you actively participate and your MAGI is under $100k (phasing out to $0 by $150k); unused losses carry forward. On sale, claimed depreciation is recaptured at up to 25%, and gains may owe capital-gains tax (a 1031 exchange can defer both). Figures are a year-1 estimate at your 24.0% rate — not tax advice; consult a CPA.
Schools (NCES district)
- District
- Livermore Valley Joint Unified
- NCES district ID
- 0622110
- Math proficiency
- 46% ▼ -4.00%
- Reading proficiency
- 61% ▼ -2.00%
- Median HH income
- $102,399
- Composite
- 50.64/100
- National rank
- #1835
- State rank
- #90 of 517 in CA
Livability — Livermore
- Score
- 83/100
- State rank
- #21
- US rank
- #846
Category grades
Schools grade is shown separately in the Schools card above.
Census & demographics
- Census place
- Livermore, CA
- County
- Alameda County · 1,614,355 people
- City population
- 87,758
- Metro
- San Francisco-Oakland-Berkeley, CA
- Population (ZIP)
- 37,885
- Household income
- $145,392
- Rent vs Own
- Severe rent burden
- 1059.0
Population outlook (Alameda County) Hauer SSP2
- Today (2025)
- 1,928,884 people
- By 2030
- 2,069,146 · +7.3%
- By 2040
- 2,338,405 · +21.2%
- By 2050
- 2,586,608 · +34.1%
- By 2075
- 3,061,911 · +58.7%
- By 2100
- 3,234,133 · +67.7%
Race, ethnicity, and origin ACS 2023
- Neighborhood character
- Diverse neighborhood (Simpson 0.68)
- Race & ethnicity
- White 45% Hispanic / Latino 29% Asian 16% Two or more races 15% Black 2% Native American 1%
- Hispanic origin (detail)
- Mexican 24% Puerto Rican 1%
- Common ancestry
- Russian 3% Romanian 2% Lithuanian 2%
- Foreign-born
- 23% · Canada, China, Vietnam
- Languages at home
- 68% English-only · Spanish 17% Other Indo-European 4% Other Asian/Pacific 4%
Political lean MEDSL · Alameda
- 2024 margin
- Solid D (+53.6) · D 74.6% · R 21.0% · Other 4.4%
- 2008→2024 swing
- -5.9pp toward R · 2008: 59.5pp · 2024: 53.6pp
- All cycles
- 2024: D+53.6 2020: D+62.5 2016: D+64.4 2012: D+59.8 2008: D+59.5
Not yet ingested
- Civics
- —
Market trends
- HPI YoY
- ▼ -922.10%
- Current HPI
- 307.9736
- Rent YoY
- ▲ 0.50%
- Metro
- San Francisco-Oakland-Berkeley, CA
- State GDP YoY
- ▲ 3.21%
- F500 in state
- 116
Industry mix (Fortune 500 HQ in CA)
| Industry | F500 HQs | Revenue |
|---|---|---|
| Technology | 27 | $1,492B |
|
||
| Financial Services | 3 | $174B |
|
||
| Retail | 3 | $44B |
|
||
| Insurance | 3 | $26B |
|
||
| Media / Entertainment | 2 | $115B |
|
||
| Pharmaceuticals / Biotech | 2 | $62B |
|
||
Price history
1 event — show timeline
- 2026-04-02 Listed $169,888 bridgeMLS, Bay East AOR, or Contra Costa AOR
Property tax history
+0.8%/yrLatest (2025): $265 · -0.3% YoY. Source: county tax records.
Cash-flow waterfall
monthlySold comps — $/sqft
last 12 mo · ≤1 miLoading sold comps…