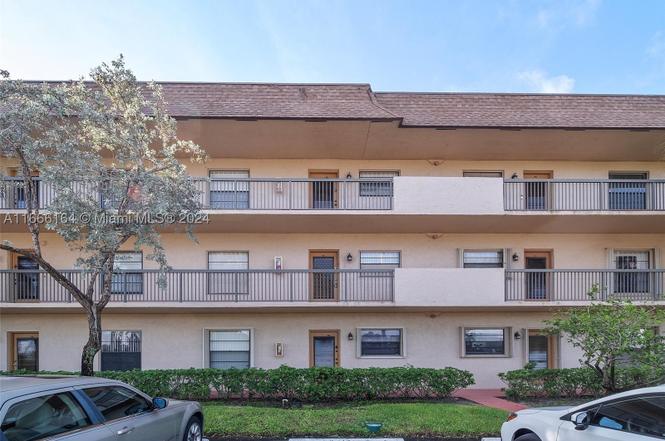
6090 N Sabal Palm Blvd #204 · Tamarac, FL
Flood risk No data
- FEMA flood zone
- —
- Chance of flooding over 30 yrs
- —
- Est. flood insurance / yr
- —
Fire risk No data
- Est. fire insurance / yr
- —
Heat risk No data
- Hot days now (above threshold)
- —
- Hot days in 30 yrs
- —
Wind risk No data
- Chance of severe wind over 30 yrs
- —
Air-quality risk No data
- Unhealthy air days now
- —
- Unhealthy air days in 30 yrs
- —
Risk factors via First Street. Map © Google.
Why this score? — see what drove the B grade
The composite is a weighted blend of 9 inputs, each scored 0–100. Each bar is that input's sub-score; the figure is the points it added to the 100-point composite (weight × sub-score).
- Cash flow +30.0/30.0
- 1% rule +10.0/10.0
- DSCR +10.0/10.0
- ARV discount +7.5/15.0
- Schools +4.1/10.0
- Livability +3.8/5.0
- Condition / age +2.5/5.0
- Rent growth +2.2/5.0
- Appreciation +0.0/10.0
$75,000
🖨 Deal sheet (PDF) 📄 Offer letter ✓ Due diligence
Listing remarks
Discover this charming 2-bedroom, 2-bath condo in a sought-after Tamarac 55+ community of Carriage Hills! Featuring a bright open layout, this home offers comfort and convenience. Enjoy fantastic amenities, including a clubhouse and pool, all within minutes of shopping and dining. PRICED TO SELL - NEW A/C 2025. Don’t miss out on this incredible opportunity—schedule your showing today!
Key facts
- Clubhouse and pool
- Minutes of dining
- Minutes of shopping
Tags
Property features AI
Finance
- Other: Pets allowed with restrictions or possible restrictions (conditional)
- HOA & community: Monthly association fee; Association fee: $624; Senior community
Exterior
- Parking: Assigned parking (one space)
- Home design: Attached property; 4 total stories; Entry on level 2
- Construction: Block construction; Resale property
- Exterior features: Lagoon waterfront
Interior
- Kitchen: Electric range; Microwave; Refrigerator
- Bedrooms: Bedroom on main level
- Flooring: Carpet; Tile
- Bathrooms: 2 full bathrooms
- Heating & cooling: Central heating; Central air conditioning
- Interior features: Second-floor entry; Bedroom on main level; Has view
Neighborhood map
What this means for you Summary
Snapshot
- This is a 2-bed/2.0-bath condo listed at $75k.
Deal economics
- At list price, monthly cash flow is $553 ($7k/yr) — positive.
- The deal already cash-flows at list — no discount required.
- Meets the 1% rule at list price ($2k rent vs $75k).
- Recommended offer: $66k (12.0% below list) — sets the bar for market timing.
- Cap rate 15.1% vs local median 3.9% in Tamarac — top-decile yield for the area; either an underpriced asset or a hidden risk that comps aren't pricing in. Stress-test before assuming the spread holds.
Location & tenants
- Location reads 76/100 on livability (#239 in FL, #3,785 nationally) — a middle-class / working-renter tenant base. Strengths: housing A+, health & safety A+, cost of living A-; Watch: employment C-, amenities F, commute F.
- Broward (suburban): math 42% / reading 53% proficiency, ranked #46 of 73 in FL (top 63%) — families likely to look elsewhere, expect single-tenant / working-renter base with shorter leases.
- Market conditions: Rents soft (-1.4%/yr); 827 active listings in the ZIP; 40 comparable units currently listed for rent nearby; rentals at typical pace (median 25d on market — plan ~3-4 weeks tenant-placement turnaround); 2,111 units permitted in Broward County in 2024 (1,265 in 5+ unit buildings).
- This rent runs 43% of the median local income ($58k/yr) — at the standard rent-burdened threshold; future hikes will face affordability resistance.
Forward outlook
- Local home prices are declining (-3.0%/yr); year-one equity from $519 of loan paydown is wiped out by about $2k of value loss. Plan a longer hold.
- Broward County population projected at +34% by 2050 — long-run rental-demand tailwind backs the buy-and-hold thesis.
- At projected returns (-3.0% appreciation + 0.0% rent growth), your $21k cash investment doubles in ~5 years — after that, you're playing with house money.
Negotiation context
- It's been on market 614 days — a 12% lower offer ($66k) is reasonable based on typical stale-listing flexibility.
- 2 sale attempts since 2y ago; this cycle's ask has dropped $60k (44%) from the opening price — seller is motivated, your offer sets the floor, not the list.
- Current owner paid $46k; list at $75k implies a 64% gain — meaningful room to come down on a strong offer.
Risks & watch-outs
- Watch-outs: HOA is 30% of rent.
Questions for the listing agent
- It's been on market 614 days. Have you received any prior offers? Is the seller open to a 12% concession, seller financing, or rate buy-down credit?
- What does the HOA fee cover, when was the last increase, and are there any pending special assessments or reserve-fund shortfalls?
- Any open or pending special assessments — roof, HVAC, plumbing, elevator, façade? What's the per-unit balance and payoff schedule, and is the seller paying it off at close or rolling it to the buyer?
- Why hasn't it sold? Are there any deal-killer items the seller is aware of (foundation, flood, title, zoning, code violations)?
- Is there a deadline driving the sale (1031 exchange, divorce, estate, relocation)? That informs how much negotiation room exists.
- Schools are B-rated — typically a magnet for longer-tenancy family renters. What's the average tenant stay here, and is there a school-zone premium baked into asking?
- What's the average days-on-market for RENTAL listings here right now (not sales)? A rising rental-DOM trend means longer vacancies and softer asking-rent achievability than the comps imply.
- What's the recent tenant-quality profile in this submarket — average credit score on applications, eviction rate, late-payment / NSF rate, and stable-employment percentage? A property-management company in the area should have these aggregated.
- How much new apartment / multifamily construction is in the pipeline within 1–3 miles? Heavy new supply (>2% of stock underway) typically softens rents 12–24 months out; light construction supports rent growth.
Investment metrics
- 1% rule
- 2.81% ✓
- Cap rate
- 15.14%
- Cash-on-cash
- 31.59%
- DSCR
- 2.41
- GRM
- 3.0
CMA / ARV
No comps found within radius.
Projected returns pro-forma
-3.0% appreciation · 0.0% rent growth · sell at horizon
- IRR
- 21.4%
- Equity multiple
- 1.82×
- Total profit
- $17,277
- Equity at exit
- $11,183
- IRR
- 26.2%
- Equity multiple
- 2.82×
- Total profit
- $38,139
- Equity at exit
- $6,485
Cash invested: $21,000 (down + closing). Projections, not guarantees.
Landlord ↔ Tenant lean methodology
- Overall (STATE)
- 87 Strongly Landlord-Friendly
- State Florida
- 87 Strongly Landlord-Friendly · R+3
- County
- — inherits STATE
- City
- — inherits STATE
ZIP-level market 33319
- Rents YoY
- -1.4%
- Active inventory
- 827
- Price-to-rent
- 3.0×
Monthly cashflow live
- Estimated rent
- $2,105 high interval (Pro) →
- Mortgage (P&I)
- −$393
- Tax from tax record
- −$62 /mo · $744/yr
- Insurance
- −$31
- HOA
- −$624
- Vacancy / Maint / Mgmt
- −$442
- Net cashflow
- $553
Break-even live
Sensitivity live
| Price | -10% $595 | -5% $574 | +0% $553 | +5% $532 | +10% $510 |
|---|---|---|---|---|---|
| Rent | -10% $386 | -5% $470 | +0% $553 | +5% $636 | +10% $719 |
| Rate | -1.0pp $591 | -0.5pp $572 | base $553 | +0.5pp $533 | +1.0pp $514 |
UW: 25.0% down · 7.5% · 30yr · 1.5% tax · 5.0% vac · 8.0% maint · 8.0% mgmt
Financing live
Cash to close
- Down payment
- $18,750
- Closing costs
- $2,250
- Reserves months
- —
- Total cash needed
- —
Loan-product check · same deal, 3 products live
Conventional
25% down · 7.5% · 30yr
- Down + closing
- —
- Monthly P&I
- —
- Monthly cashflow
- —
- DSCR
- —
- Eligible?
- —
Personal DTI + credit; lowest rate.
DSCR
20% down · 8.5% · 30yr
- Down + closing
- —
- Monthly P&I
- —
- Monthly cashflow
- —
- DSCR
- —
- Eligible?
- —
No personal income docs; deal must DSCR.
Hard money
10% down · 12.0% · 12mo
- Down + closing
- —
- Monthly P&I
- —
- Monthly cashflow
- —
- DSCR
- —
- Eligible?
- —
Short-term bridge; refi at stabilization.
Rent comps 40 comps
| Address | Beds | Baths | Sqft | Rent | $/sqft | DOM | Units | Dist |
|---|---|---|---|---|---|---|---|---|
| 1982 SW 68th Ter North Lauderdale, FL | 2.0 | 1.0 | 775 | $2,100 | $2.71 | 8d | 1 | 0.09mi |
| 1982 SW 68th Ter North Lauderdale, FL | 2.0 | 1.0 | 775 | $2,300 | $2.97 | 23d | 1 | 0.09mi |
| 6075 N Sabal Palm Blvd #210 Tamarac, FL | 2.0 | 2.0 | 970 | $1,900 | $1.96 | 21d | 1 | 0.12mi |
| 5155 E Sabal Palm Blvd #204 Tamarac, FL | 2.0 | 1.5 | 790 | $1,600 | $2.03 | 25d | 1 | 0.14mi |
| 6963 SW 19th St Pompano Beach, FL | 2.0 | 1.0 | 1054 | $1,700 | $1.61 | 25d | 1 | 0.25mi |
| 2024 Champions Way North Lauderdale, FL | 2.0 | 2.0 | 948 | $2,500 | $2.64 | 25d | 1 | 0.25mi |
| 1812 Adventure Pl #1812 North Lauderdale, FL | 2.0 | 1.0 | 955 | $2,200 | $2.30 | 25d | 1 | 0.27mi |
| 5780 Rock Island Rd #362 Tamarac, FL | 2.0 | 2.0 | 1030 | $1,900 | $1.84 | 25d | 1 | 0.31mi |
| 5740 Rock Island Rd Tamarac, FL | 1.0 | 1.0 | 722 | $1,722 | $2.38 | 25d | 1 | 0.33mi |
| 1740 SW 70th Way North Lauderdale, FL | 2.0 | 1.0 | 775 | $2,000 | $2.58 | 13d | 1 | 0.33mi |
| 5740 Rock Island Rd #299 Tamarac, FL | 1.0 | 1.0 | 750 | $1,895 | $2.53 | 15d | 1 | 0.33mi |
| 1850 Adventure Pl North Lauderdale, FL | 3.0 | 2.0 | 1336 | $2,750 | $2.06 | 25d | 1 | 0.34mi |
| 5672 Rock Island Rd Tamarac, FL | 1.0 | 1.0 | 717 | $1,748 | $2.44 | 4d | 2 | 0.36mi |
| 4717 NW 58th St Tamarac, FL | 2.0 | 2.0 | 1354 | $2,600 | $1.92 | 8d | 1 | 0.42mi |
| 1908 Players Pl North Lauderdale, FL | 3.0 | 2.0 | 1336 | $1,150 | $0.86 | 25d | 1 | 0.43mi |
| 7174 Sportsmans Dr North Lauderdale, FL | 2.0 | 2.0 | 1186 | $2,400 | $2.02 | 25d | 1 | 0.45mi |
| 5646 Rock Island Rd #198 Tamarac, FL | 2.0 | 2.0 | 1030 | $2,150 | $2.09 | 25d | 1 | 0.46mi |
| 1953 Players Pl #1953 North Lauderdale, FL | 3.0 | 2.0 | 1186 | $2,400 | $2.02 | 25d | 1 | 0.46mi |
| 5628 Rock Island Rd Tamarac, FL | 1.0–2.0 | 1.0–2.0 | 867 | $2,000 | $2.31 | 6d | 2 | 0.47mi |
| 1720 SW 64th Ter North Lauderdale, FL | 3.0 | 2.0 | 1248 | $3,600 | $2.88 | 13d | 1 | 0.49mi |
| 6872 SW 15th St Pompano Beach, FL | 2.0 | 1.0 | 919 | $2,400 | $2.61 | 15d | 1 | 0.50mi |
| 5584 NW 59th Pl Tamarac, FL | 3.0 | 2.5 | 1488 | $2,700 | $1.81 | 25d | 1 | 0.54mi |
| 5843 Woodlands Blvd Unit 5843 Tamarac, FL | 3.0 | 2.5 | 1373 | $2,900 | $2.11 | 25d | 1 | 0.55mi |
| 4934 NW 55th Ct Tamarac, FL | 2.0 | 1.0 | 1059 | $1,895 | $1.79 | 16d | 1 | 0.59mi |
| 6711 Boulevard of Champions North Lauderdale, FL | 1.0 | 1.0 | 1216 | $1,800 | $1.48 | 25d | 1 | 0.63mi |
| 6056 SW 19th Pl North Lauderdale, FL | 2.0 | 2.5 | 1161 | $2,350 | $2.02 | 25d | 1 | 0.70mi |
| 6001 Shakerwood Cir #205 Tamarac, FL | 2.0 | 2.0 | 775 | $1,800 | $2.32 | 25d | 1 | 0.71mi |
| 6060 SW 19th Ct North Lauderdale, FL | 2.0 | 3.0 | 1120 | $2,200 | $1.96 | 25d | 1 | 0.72mi |
| 6020 Shakerwood Cir #106 Tamarac, FL | 2.0 | 2.0 | 800 | $2,000 | $2.50 | 16d | 1 | 0.72mi |
| 6081 SW 19th St North Lauderdale, FL | 2.0 | 2.5 | 1161 | $2,499 | $2.15 | 25d | 1 | 0.72mi |
| 6081 SW 19th St North Lauderdale, FL | 2.0 | 2.5 | 1161 | $2,290 | $1.97 | 5d | 1 | 0.72mi |
| 5821 Swordfish Ct Unit B Tamarac, FL | 2.0 | 2.5 | 1380 | $2,250 | $1.63 | 25d | 1 | 0.73mi |
| 6061 Shakerwood Cir #206 Tamarac, FL | 2.0 | 2.0 | 775 | $1,800 | $2.32 | 5d | 1 | 0.74mi |
| 129 San Remo Blvd #129 North Lauderdale, FL | 3.0 | 2.5 | 1403 | $2,600 | $1.85 | 25d | 1 | 0.76mi |
| 1962 SW 60th Ave North Lauderdale, FL | 3.0 | 3.0 | 1280 | $2,500 | $1.95 | 21d | 1 | 0.79mi |
| 1954 SW 60th Ave Unit 1 North Lauderdale, FL | 2.0 | 2.0 | 1120 | $2,550 | $2.28 | 25d | 1 | 0.79mi |
| 224 San Remo Blvd Unit 224 North Lauderdale, FL | 3.0 | 2.5 | 1289 | $2,900 | $2.25 | 25d | 1 | 0.84mi |
| 4033 Lakeside Dr #4033 Tamarac, FL | 2.0 | 1.0 | 720 | $1,700 | $2.36 | 25d | 1 | 0.86mi |
| 4010 Lakeside Dr #4010 Tamarac, FL | 2.0 | 1.0 | 720 | $1,750 | $2.43 | 18d | 1 | 0.86mi |
| 4010 Lakeside Dr #4010 Tamarac, FL | 2.0 | 1.0 | 720 | $1,700 | $2.36 | 2d | 1 | 0.86mi |
HOA detail condo
- Monthly dues
- $624 · $7,488/yr
- Likely covers
- pool
- Assessments
- None detected in remarks — confirm with the listing agent.
Listing history 23 events
-
2026-06-21days on market $75,000 Active 614 DOM
-
2026-06-18days on market $75,000 Active 611 DOM
-
2026-06-17days on market $75,000 Active 610 DOM
-
2026-06-16days on market $75,000 Active 609 DOM
-
2026-06-15days on market $75,000 Active 608 DOM
-
2026-06-13days on market $75,000 Active 606 DOM
-
2026-06-10price $75,000 Active 602 DOM
-
2026-06-09days on market $90,000 Active 602 DOM
-
2026-06-07days on market $90,000 Active 600 DOM
-
2026-06-04days on market $90,000 Active 597 DOM
-
2026-06-03days on market $90,000 Active 596 DOM
-
2026-06-02days on market $90,000 Active 595 DOM
-
2026-06-01days on market $90,000 Active 594 DOM
-
2026-05-31days on market $90,000 Active 593 DOM
-
2026-05-19price $90,000
-
2026-02-27price $100,000
-
2025-04-11price $120,000
-
2025-03-01status Active
-
2025-01-22price $125,000
-
2024-12-09price $130,000
-
2024-09-30$135,000 Active
-
1998-03-24soldstatus $45,700
-
1983-12-01soldstatus $55,400
ⓘ Source: listings_history table (triggers on properties + properties_extension) + one-shot
backfill from property_details.listing_events for pre-trigger history.
Tax reassessment forecast FL · Resets to sale price
- Current annual tax
- $744 · $62/mo
- Projected year-2 tax
- $744 · $62/mo
- Expected delta
- $0/yr ($0/mo · 0.0%)
ⓘ Screening estimate from a state-policy table — verify with the county assessor before closing.
Nearby sold comps map
Loading sold comps map…
Walkable amenities ~0.75 mi
Loading nearby amenities…
Taxation est. · year 1
- Rental income
- $25,265
- − Mortgage interest
- −$4,201
- − Property taxes
- −$744
- − Insurance
- −$375
- − Repairs & maintenance
- −$2,021
- − Management
- −$2,021
- − HOA
- −$7,488
- − Depreciation
- −$2,182
- Taxable income
- $6,233
- Est. tax owed @ 24.0%
- −$1,496
- After-tax cash flow
- $5,137/yr
For passive investors: Depreciation is non-cash, so a rental often shows a tax loss while cash-flowing — sheltering income. Rental losses are passive: they offset passive income freely, and up to $25,000/yr can offset ordinary (W-2) income if you actively participate and your MAGI is under $100k (phasing out to $0 by $150k); unused losses carry forward. On sale, claimed depreciation is recaptured at up to 25%, and gains may owe capital-gains tax (a 1031 exchange can defer both). Figures are a year-1 estimate at your 24.0% rate — not tax advice; consult a CPA.
Schools (NCES district)
- District
- Broward
- NCES district ID
- 1200180
- Math proficiency
- 42% ▼ -18.00%
- Reading proficiency
- 53% ▼ -5.00%
- Median HH income
- $52,139
- Composite
- 40.88/100
- National rank
- #3621
- State rank
- #46 of 73 in FL
Livability — Tamarac
- Score
- 76/100
- State rank
- #239
- US rank
- #3785
Category grades
Schools grade is shown separately in the Schools card above.
Census & demographics
- Census place
- Tamarac, FL
- County
- Broward County · 1,963,430 people
- City population
- 105,666
- Metro
- Miami-Fort Lauderdale-Pompano Beach, FL
- Population (ZIP)
- 54,450
- Household income
- $58,388
- Rent vs Own
- Severe rent burden
- 2809.0
Population outlook (Broward County) Hauer SSP2
- Today (2025)
- 2,207,033 people
- By 2030
- 2,360,704 · +7.0%
- By 2040
- 2,661,208 · +20.6%
- By 2050
- 2,946,698 · +33.5%
- By 2075
- 3,602,273 · +63.2%
- By 2100
- 3,970,984 · +79.9%
Race, ethnicity, and origin ACS 2023
- Neighborhood character
- Diverse neighborhood (Simpson 0.58)
- Race & ethnicity
- Black 61% Hispanic / Latino 17% White 15% Two or more races 11% Asian 4%
- Hispanic origin (detail)
- Puerto Rican 4% Cuban 2% Dominican 1%
- Common ancestry
- Hispanic 13% Romanian 1% Italian 1%
- Foreign-born
- 46% · Canada, Jamaica, Vietnam
- Languages at home
- 64% English-only · Spanish 15% French/Haitian/Cajun 15% Other Indo-European 2%
Political lean MEDSL · Broward
- 2024 margin
- D (+17.0) · D 58.0% · R 41.0%
- 2008→2024 swing
- -17.8pp toward R · 2008: 34.7pp · 2024: 17.0pp
- All cycles
- 2024: D+17.0 2020: D+29.8 2016: D+35.0 2012: D+34.9 2008: D+34.7
Not yet ingested
- Civics
- —
Market trends
- HPI YoY
- ▼ -202.84%
- Current HPI
- 328.4307
- Rent YoY
- ▼ -1.38%
- Metro
- Miami-Fort Lauderdale-Pompano Beach, FL
- State GDP YoY
- ▲ 3.28%
- F500 in state
- 36
Industry mix (Fortune 500 HQ in FL)
| Industry | F500 HQs | Revenue |
|---|---|---|
| Industrial Technology | 2 | $29B |
|
||
| Insurance | 2 | $17B |
|
||
| Retail | 1 | $60B |
|
||
| Technology Distribution | 1 | $58B |
|
||
| Homebuilding | 1 | $35B |
|
||
| Technology Manufacturing | 1 | $35B |
|
||
Price history
+62.5% since first listed9 events — show timeline
- 2026-05-19 Price Changed $90,000 MARMLS
- 2026-02-27 Price Changed $100,000 MARMLS
- 2025-04-11 Price Changed $120,000 MARMLS
- 2025-03-01 Relisted — MARMLS
- 2025-01-22 Price Changed $125,000 MARMLS
- 2024-12-09 Price Changed $130,000 MARMLS
- 2024-09-30 Listed $135,000 MARMLS
- 1998-03-24 Sold (Public Records) $45,700 Public Records
- 1983-12-01 Sold (Public Records) $55,400 Public Records
Property tax history
+2.5%/yrLatest (2025): $744 · +6.4% YoY. Source: county tax records.
Cash-flow waterfall
monthlySold comps — $/sqft
last 12 mo · ≤1 miLoading sold comps…