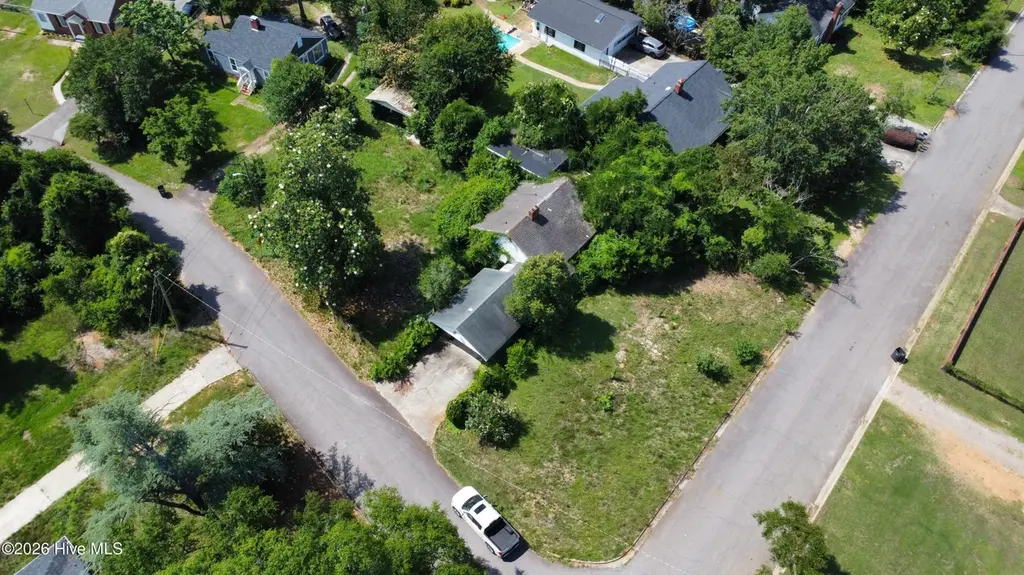
1005 Redbird Rd · Augusta-Richmond County consolidated government (balance), GA
Flood risk 1/10 · Minimal
- FEMA flood zone
- X (unshaded)
- Chance of flooding over 30 yrs
- 0.0%
- Est. flood insurance / yr
- $507 – $1,088
Fire risk 1/10 · Minimal
- Est. fire insurance / yr
- $963 – $1,789
Heat risk 7/10 · Major
- Hot days now (above 107°F)
- 7 days/yr
- Hot days in 30 yrs
- 15 days/yr
Wind risk 7/10 · Major
- Chance of severe wind over 30 yrs
- 78.0%
Air-quality risk 4/10 · Minor
- Unhealthy air days now
- 4 days/yr
- Unhealthy air days in 30 yrs
- 4 days/yr
Risk factors via First Street. Map © Google.
Why this score? — see what drove the B- grade
The composite is a weighted blend of 9 inputs, each scored 0–100. Each bar is that input's sub-score; the figure is the points it added to the 100-point composite (weight × sub-score).
- Cash flow +30.0/30.0
- 1% rule +10.0/10.0
- DSCR +10.0/10.0
- ARV discount +7.5/15.0
- Rent growth +3.6/5.0
- Livability +2.5/5.0
- Condition / age +2.5/5.0
- Schools +1.3/10.0
- Appreciation +0.0/10.0
$99,000
🖨 Deal sheet (PDF) 📄 Offer letter ✓ Due diligence
Listing remarks
Prime investment opportunity just walking distance from Augusta National Golf Club. This as-is property is perfect for the savvy investor looking to remodel and capitalize on Masters Week demand or tear down and build new. The potential here is limitless don't miss your shot at a high demand Augusta location.
Key facts
- Walking distance
- 0.36 acre lot
- Built 1942
Tags
Property features AI
Exterior
- Parking: Other parking configuration
- Utilities: Utilities: see remarks
- Home design: Single-family residence; One-story home; Entry level is ground floor
- Construction: Wood siding exterior; Shingle roof; Built on a crawl space foundation
- Exterior features: No patio or porch; No fencing; Property has a view
Interior
- Bedrooms: Total of 3 rooms (includes bedrooms and living areas)
- Bathrooms: 2 full bathrooms
- Heating & cooling: No central heating; No cooling; Other/unspecified cooling available
- Interior features: See remarks for additional interior details; Crawl space basement
Neighborhood map
What this means for you Summary
Snapshot
- This is a 3-bed/2.5-bath single-family listed at $99k.
Deal economics
- At list price, monthly cash flow is $674 ($8k/yr) — positive.
- The deal already cash-flows at list — no discount required.
- Meets the 1% rule at list price ($2k rent vs $99k).
- Recommended offer: $98k (1.5% below list) — sets the bar for market timing.
- Cap rate 14.5% vs local median 5.3% in Augusta-Richmond County consolidated government (balance) — top-decile yield for the area; either an underpriced asset or a hidden risk that comps aren't pricing in. Stress-test before assuming the spread holds.
Location & tenants
- Location reads: area grade B — affects rentability + tenant quality, not the cash-flow math above.
- Richmond County (urban): math 12% / reading 20% proficiency, ranked #154 of 174 in GA (top 88%) — low school quality limits family demand, transient renter base, plan for 1-2y turnover; 72% free/reduced lunch — lower-income household profile, screen leases tightly.
- Zoned schools: Garrett Elementary School (math 17% / reading 17%, grade F, #936 of 1,228 statewide, top 79%, 369 students, 98% FRL); Tutt Middle School (math 7% / reading 21%, grade F, #405 of 470 statewide, top 86%, 476 students, 98% FRL); Westside High School (math 2% / reading 12%, grade F, #385 of 424 statewide, top 92%, 999 students, 98% FRL) — zoned schools average 98% FRL vs 72% district-wide (26 pts higher); higher-poverty schools than district average — tighter screening recommended.
- Market conditions: Rents rising fast (+4.3%/yr); 227 active listings in the ZIP; 32 comparable units currently listed for rent nearby; rentals lingering (median 45d on market — plan ~5-8 weeks vacancy on turnover, expect pricing pressure); 56% of comp listings sitting > 30 days — soft ceiling on asking rent; 561 units permitted in Richmond County in 2024 (0 in 5+ unit buildings).
- This rent runs 43% of the median local income ($47k/yr) — at the standard rent-burdened threshold; future hikes will face affordability resistance.
Forward outlook
- Local home prices are declining (-3.0%/yr); year-one equity from $684 of loan paydown is wiped out by about $3k of value loss. Plan a longer hold.
- Richmond County population projected to shrink 5% by 2050 — rents likely to lag national; underwrite the cash flow, not the appreciation.
- At projected returns (-3.0% appreciation + 4.3% rent growth), your $28k cash investment doubles in ~4 years — after that, you're playing with house money.
Negotiation context
- It's been on market 15 days — a 2% lower offer ($98k) is reasonable based on typical stale-listing flexibility.
- Current owner paid $75k; 32% above their basis — modest negotiation headroom, anchor on the comps not their cost.
Risks & watch-outs
- Watch-outs: built in 1942 — expect roof / HVAC / electrical / plumbing capex.
- Climate carrying-cost: major wind risk, 78% chance of damaging wind over 30y; extreme-heat days projected 7→15/yr by 2055 (HVAC capex compounding) — expect insurance premiums to compound above CPI over the hold.
Questions for the listing agent
- Built in 1942 — when were the roof, HVAC, electrical panel, plumbing, and water heater last replaced?
- Is there a deadline driving the sale (1031 exchange, divorce, estate, relocation)? That informs how much negotiation room exists.
- What's the average days-on-market for RENTAL listings here right now (not sales)? A rising rental-DOM trend means longer vacancies and softer asking-rent achievability than the comps imply.
- What's the recent tenant-quality profile in this submarket — average credit score on applications, eviction rate, late-payment / NSF rate, and stable-employment percentage? A property-management company in the area should have these aggregated.
- How much new for-sale + rental construction is in the pipeline within 1–3 miles? Heavy new supply typically softens prices + rents 12–24 months out; constrained supply supports both.
Investment metrics
- 1% rule
- 1.69% ✓
- Cap rate
- 14.47%
- Cash-on-cash
- 29.19%
- DSCR
- 2.30
- GRM
- 4.9
CMA / ARV
- ARV (on-the-fly)
- $243,936
- Comps found
- 12
Show comp detail 12 sales within ~0.75 mi
| Address | Dist | Beds/Ba | Sqft | Sold | Price | $/sf | Match |
|---|---|---|---|---|---|---|---|
| 2353 Redwood Dr | 0.18mi | 3/2.0 | 1,497 (-6%) | 6mo | $229,900 | $154 | 76 |
| 2327 Redwood Dr | 0.33mi | 2/2.5 (-1) | 1,557 (-2%) | 9mo | $240,000 | $154 | 69 |
| 2314 Redwood Dr | 0.45mi | 3/2.0 | 1,568 (-1%) | 13mo | $194,400 | $124 | 65 |
| 1015 Oleander Dr | 0.47mi | 4/2.0 (+1) | 1,628 (+3%) | 5mo | $235,000 | $144 | 62 |
| 1117 Eisenhower Dr | 0.69mi | 3/2.0 | 1,534 (-3%) | 4mo | $280,000 | $183 | 57 |
| 1020 Stewart Ave | 0.09mi | 2/2.0 (-1) | 1,366 (-14%) | 13mo | $200,000 | $146 | 55 |
| 1117 Eisenhower Dr | 0.69mi | 3/2.0 | 1,500 (-5%) | 4mo | $289,900 | $193 | 54 |
| 840 Lake Terrace Dr | 0.49mi | 3/1.0 | 1,500 (-5%) | 14mo | $180,000 | $120 | 51 |
| 803 Ann St | 0.47mi | 2/2.0 (-1) | 1,443 (-9%) | 6mo | $185,500 | $129 | 51 |
| 2416 Forest Park Rd | 0.58mi | 3/2.0 | 1,402 (-12%) | 2mo | $250,000 | $178 | 50 |
| 2403 Ponderosa Dr | 0.62mi | 3/1.5 | 1,662 (+5%) | 12mo | $304,000 | $183 | 49 |
| 2410 Castlewood Dr | 0.65mi | 4/3.0 (+1) | 1,743 (+10%) | 2mo | $299,900 | $172 | 45 |
Match score weights: distance 35% · size 25% · config 20% · recency 20%. Top-matched comps best support the ARV.
Projected returns pro-forma
-3.0% appreciation · 4.29% rent growth · sell at horizon
- IRR
- 25.0%
- Equity multiple
- 2.05×
- Total profit
- $29,107
- Equity at exit
- $14,761
- IRR
- 33.6%
- Equity multiple
- 4.24×
- Total profit
- $89,910
- Equity at exit
- $8,560
Cash invested: $27,720 (down + closing). Projections, not guarantees.
Landlord ↔ Tenant lean methodology
- Overall (STATE)
- 90 Strongly Landlord-Friendly
- State Georgia
- 90 Strongly Landlord-Friendly · R+3
- County
- — inherits STATE
- City
- — inherits STATE
ZIP-level market 30904
- Rents YoY
- 4.3%
- Active inventory
- 227
- Price-to-rent
- 4.9×
Monthly cashflow live
- Estimated rent
- $1,671 high interval (Pro) →
- Mortgage (P&I)
- −$519
- Tax from tax record
- −$85 /mo · $1,021/yr
- Insurance
- −$41
- HOA
- −$0
- Vacancy / Maint / Mgmt
- −$351
- Net cashflow
- $674
Break-even live
Sensitivity live
| Price | -10% $730 | -5% $702 | +0% $674 | +5% $646 | +10% $618 |
|---|---|---|---|---|---|
| Rent | -10% $542 | -5% $608 | +0% $674 | +5% $740 | +10% $806 |
| Rate | -1.0pp $724 | -0.5pp $700 | base $674 | +0.5pp $649 | +1.0pp $623 |
UW: 25.0% down · 7.5% · 30yr · 1.5% tax · 5.0% vac · 8.0% maint · 8.0% mgmt
Financing live
Cash to close
- Down payment
- $24,750
- Closing costs
- $2,970
- Reserves months
- —
- Total cash needed
- —
Loan-product check · same deal, 3 products live
Conventional
25% down · 7.5% · 30yr
- Down + closing
- —
- Monthly P&I
- —
- Monthly cashflow
- —
- DSCR
- —
- Eligible?
- —
Personal DTI + credit; lowest rate.
DSCR
20% down · 8.5% · 30yr
- Down + closing
- —
- Monthly P&I
- —
- Monthly cashflow
- —
- DSCR
- —
- Eligible?
- —
No personal income docs; deal must DSCR.
Hard money
10% down · 12.0% · 12mo
- Down + closing
- —
- Monthly P&I
- —
- Monthly cashflow
- —
- DSCR
- —
- Eligible?
- —
Short-term bridge; refi at stabilization.
Rent comps 32 comps
| Address | Beds | Baths | Sqft | Rent | $/sqft | DOM | Units | Dist |
|---|---|---|---|---|---|---|---|---|
| 217 E Vineland Rd Augusta, GA | 3.0 | 2.0 | 1551 | $1,550 | $1.00 | 25d | 1 | 0.33mi |
| 848 Lake Terrace Dr Augusta, GA | 2.0 | 1.0 | 1200 | $1,300 | $1.08 | 45d | 1 | 0.48mi |
| 2404 Hiawassee Rd Augusta, GA | 3.0 | 1.0 | 1666 | $1,550 | $0.93 | 45d | 1 | 0.54mi |
| 264 E Vineland Rd Augusta, GA | 3.0 | 2.0 | 1363 | $1,800 | $1.32 | 45d | 1 | 0.57mi |
| 264 E Vineland Rd Augusta, GA | 3.0 | 2.0 | 1363 | $1,700 | $1.25 | 25d | 1 | 0.57mi |
| 2423 Brentwood Pl Augusta, GA | 3.0 | 2.0 | 1600 | $1,585 | $0.99 | 45d | 1 | 0.59mi |
| 1117 Eisenhower Dr Augusta, GA | 3.0 | 2.0 | 1534 | $2,250 | $1.47 | 45d | 1 | 0.71mi |
| 1117 Eisenhower Dr Augusta, GA | 3.0 | 2.0 | 1534 | $1,700 | $1.11 | 25d | 1 | 0.71mi |
| 2279 Overton Rd Augusta, GA | 3.0 | 2.5 | 2209 | $1,895 | $0.86 | 45d | 1 | 0.73mi |
| 1106 Azalea Dr Augusta, GA | 3.0 | 2.0 | 1276 | $2,200 | $1.72 | 45d | 1 | 0.80mi |
| 2448 Riverlook Dr Augusta, GA | 2.0 | 1.5 | 1288 | $1,350 | $1.05 | 45d | 1 | 0.82mi |
| 2448 Riverlook Dr Augusta, GA | 2.0 | 1.5 | 1288 | $1,325 | $1.03 | 25d | 1 | 0.82mi |
| 1127 Magnolia Dr Augusta, GA | 4.0 | 2.0 | 1425 | $2,700 | $1.89 | 45d | 1 | 0.84mi |
| 2403 Deodara Dr Augusta, GA | 2.0 | 2.0 | 1445 | $1,300 | $0.90 | 25d | 1 | 0.85mi |
| 1022 Oakdale Rd Unit 1 Augusta, GA | 3.0 | 2.0 | 1269 | $1,800 | $1.42 | 25d | 1 | 0.90mi |
| 1022 Oakdale Rd Augusta, GA | 3.0 | 2.0 | 1269 | $1,695 | $1.34 | 25d | 1 | 0.90mi |
| 1022 Oakdale Rd Augusta, GA | 3.0 | 2.0 | 1269 | $1,800 | $1.42 | 45d | 1 | 0.90mi |
| 2505 Smith St Augusta, GA | 3.0 | 1.0 | 1145 | $1,350 | $1.18 | 15d | 1 | 0.96mi |
| 2703 Northwood Ct Augusta, GA | 4.0 | 3.0 | 2172 | $1,795 | $0.83 | 25d | 1 | 1.02mi |
| 25 Curry St Augusta, GA | 2.0 | 1.5 | 1306 | $950 | $0.73 | 45d | 1 | 1.02mi |
| 530 Hickman Rd Augusta, GA | 2.0 | 2.0 | 1276 | $1,200 | $0.94 | 25d | 1 | 1.15mi |
| 1224 Oakdale Rd Augusta, GA | 3.0 | 1.5 | 1247 | $1,650 | $1.32 | 45d | 1 | 1.15mi |
| 1011 River Ridge Dr Augusta, GA | 1.0–3.0 | 1.0–2.0 | 1100 | $1,600 | $1.45 | 15d | 27 | 1.23mi |
| 2028 Battle Row Augusta, GA | 2.0 | 2.0 | 1100 | $1,650 | $1.50 | 45d | 1 | 1.31mi |
| 2009 Starnes St Augusta, GA | 2.0 | 1.0 | 1305 | $975 | $0.75 | 45d | 1 | 1.42mi |
| 1000 Fairhaven Dr Augusta, GA | 2.0 | 2.0 | 1167 | $1,978 | $1.69 | 45d | 1 | 1.46mi |
| 1000 Fairhaven Dr Augusta, GA | 2.0 | 2.0 | 1167 | $1,823 | $1.56 | 15d | 1 | 1.46mi |
| 1912 Watkins St #1912 Augusta, GA | 3.0 | 1.0 | 1126 | $1,425 | $1.27 | 45d | 1 | 1.46mi |
| 1912 Watkins St #1912 Augusta, GA | 3.0 | 1.0 | 1126 | $1,325 | $1.18 | 25d | 1 | 1.46mi |
| 2110 Gary St Augusta, GA | 2.0 | 1.5 | 1173 | $1,195 | $1.02 | 45d | 1 | 1.47mi |
| 3021 Brookhaven Way Augusta, GA | 2.0 | 2.0 | 1100 | $1,400 | $1.27 | 45d | 1 | 1.47mi |
| 3029 Brookhaven Way Unit 1 Augusta, GA | 2.0 | 2.0 | 1122 | $1,350 | $1.20 | 25d | 1 | 1.49mi |
Listing history 11 events
-
2026-06-21days on market $99,000 Active 15 DOM
-
2026-06-18days on market $99,000 Active 12 DOM
-
2026-06-17days on market $99,000 Active 11 DOM
-
2026-06-16days on market $99,000 Active 10 DOM
-
2026-06-15days on market $99,000 Active 9 DOM
-
2026-06-14days on market $99,000 Active 7 DOM
-
2026-06-10days on market $99,000 Active 4 DOM
-
2026-06-09days on market $99,000 Active 3 DOM
-
2026-06-08days on market $99,000 Active 2 DOM
-
2026-06-07remarks 311-char remark
-
2026-06-07$99,000 Active 1 DOM
ⓘ Source: listings_history table (triggers on properties + properties_extension) + one-shot
backfill from property_details.listing_events for pre-trigger history.
Tax reassessment forecast GA · Resets to sale price
- Current annual tax
- $1,021 · $85/mo
- Projected year-2 tax
- $1,021 · $85/mo
- Expected delta
- $0/yr ($0/mo · 0.0%)
ⓘ Screening estimate from a state-policy table — verify with the county assessor before closing.
Climate risk First Street
- Flood 1/10 Low FEMA zone X (unshaded) · 0% chance over 30 yrs
- Wildfire 1/10 Low
- Heat 7/10 Severe 7 d/yr ≥107°F today · 15 d/yr by 30 yrs out
- Wind 7/10 Severe 78% chance of damaging wind over 30 yrs
- Air quality 4/10 Moderate 4 unhealthy d/yr today · 4 by 30 yrs out
Nearby sold comps map
Loading sold comps map…
Walkable amenities ~0.75 mi
Loading nearby amenities…
Taxation est. · year 1
- Rental income
- $20,048
- − Mortgage interest
- −$5,546
- − Property taxes
- −$1,021
- − Insurance
- −$495
- − Repairs & maintenance
- −$1,604
- − Management
- −$1,604
- − Depreciation
- −$2,880
- Taxable income
- $6,899
- Est. tax owed @ 24.0%
- −$1,656
- After-tax cash flow
- $6,437/yr
For passive investors: Depreciation is non-cash, so a rental often shows a tax loss while cash-flowing — sheltering income. Rental losses are passive: they offset passive income freely, and up to $25,000/yr can offset ordinary (W-2) income if you actively participate and your MAGI is under $100k (phasing out to $0 by $150k); unused losses carry forward. On sale, claimed depreciation is recaptured at up to 25%, and gains may owe capital-gains tax (a 1031 exchange can defer both). Figures are a year-1 estimate at your 24.0% rate — not tax advice; consult a CPA.
Schools (NCES district)
- District
- Richmond County
- NCES district ID
- 1304380
- Math proficiency
- 12% ▼ -9.00%
- Reading proficiency
- 20% ▼ -6.00%
- Median HH income
- $38,069
- Composite
- 13.43/100
- National rank
- #9524
- State rank
- #154 of 174 in GA
Livability — Augusta-Richmond County consolidated government (balance)
No livability data for this city. (Only ~50 U.S. cities are tracked.)
Census & demographics
- Census place
- Augusta-Richmond County consolidated government (balance), GA
- County
- Richmond County · 190,917 people
- City population
- 154,035
- Metro
- Augusta-Richmond County, GA-SC
- Population (ZIP)
- 23,400
- Household income
- $46,696
- Rent vs Own
- Severe rent burden
- 1594.0
Population outlook (Richmond County) Hauer SSP2
- Today (2025)
- 200,753 people
- By 2030
- 200,232 · -0.3%
- By 2040
- 196,813 · -2.0%
- By 2050
- 190,347 · -5.2%
- By 2075
- 172,496 · -14.1%
- By 2100
- 146,284 · -27.1%
Race, ethnicity, and origin ACS 2023
- Neighborhood character
- Diverse neighborhood (Simpson 0.61)
- Race & ethnicity
- Black 47% White 41% Hispanic / Latino 6% Two or more races 6% Asian 2%
- Hispanic origin (detail)
- Mexican 1%
- Common ancestry
- Italian 1% Slovak 1% Romanian 1%
- Foreign-born
- 3% · Canada, South Korea, Jamaica
- Languages at home
- 93% English-only · Spanish 4% Korean 1%
Political lean MEDSL · Richmond
- 2024 margin
- Solid D (+36.1) · D 67.8% · R 31.7%
- 2008→2024 swing
- +4.3pp toward D · 2008: 31.8pp · 2024: 36.1pp
- All cycles
- 2024: D+36.1 2020: D+37.2 2016: D+32.4 2012: D+33.8 2008: D+31.8
Not yet ingested
- Civics
- —
Market trends
- HPI YoY
- ▼ -211.97%
- Current HPI
- 199.0807
- Rent YoY
- ▲ 4.29%
- Metro
- Augusta-Richmond County, GA-SC
- State GDP YoY
- ▲ 2.66%
- F500 in state
- 28
Industry mix (Fortune 500 HQ in GA)
| Industry | F500 HQs | Revenue |
|---|---|---|
| Paper / Packaging | 2 | $29B |
|
||
| Retail | 1 | $160B |
|
||
| Transportation / Logistics | 1 | $91B |
|
||
| Airlines | 1 | $62B |
|
||
| Consumer Goods | 1 | $47B |
|
||
| Utilities | 1 | $25B |
|
||
Price history
+538.7% since first listed3 events — show timeline
- 2026-06-05 Listed $99,000 Hive MLS
- 2026-04-30 Sold (Public Records) $75,000 Public Records
- 1974-09-01 Sold (Public Records) $15,500 Public Records
Property tax history
-5.1%/yrLatest (2025): $1,021 · -8.8% YoY. Source: county tax records.
Cash-flow waterfall
monthlySold comps — $/sqft
last 12 mo · ≤1 miLoading sold comps…