 🏷️ Likely Rental
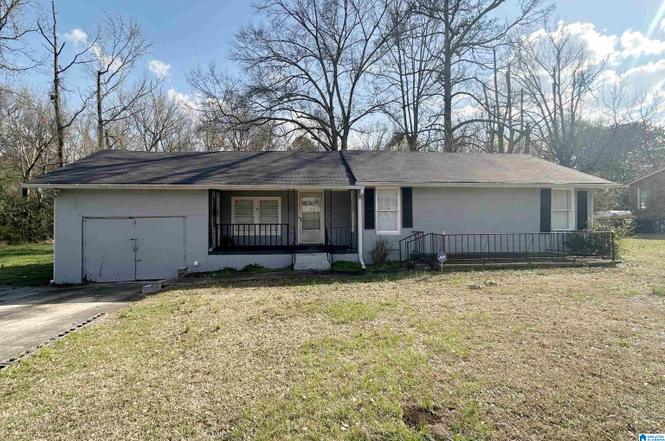
133 Mulberry Rd · Forestdale, AL
Flood risk 8/10 · Major
- FEMA flood zone
- AE
- Chance of flooding over 30 yrs
- 0.79%
- Est. flood insurance / yr
- $1,737 – $8,500
Fire risk 2/10 · Minimal
- Est. fire insurance / yr
- $916 – $1,700
Heat risk 6/10 · Moderate
- Hot days now (above 106°F)
- 7 days/yr
- Hot days in 30 yrs
- 19 days/yr
Wind risk 6/10 · Moderate
- Chance of severe wind over 30 yrs
- 27.0%
Air-quality risk 4/10 · Minor
- Unhealthy air days now
- 4 days/yr
- Unhealthy air days in 30 yrs
- 8 days/yr
Risk factors via First Street. Map © Google.
Why this score? — see what drove the B- grade
The composite is a weighted blend of 9 inputs, each scored 0–100. Each bar is that input's sub-score; the figure is the points it added to the 100-point composite (weight × sub-score).
- Cash flow +30.0/30.0
- 1% rule +10.0/10.0
- DSCR +10.0/10.0
- ARV discount +7.5/15.0
- Livability +2.9/5.0
- Rent growth +2.7/5.0
- Condition / age +2.5/5.0
- Schools +1.8/10.0
- Appreciation +0.0/10.0
$49,900
🖨 Deal sheet (PDF) 📄 Offer letter ✓ Due diligence
Listing remarks
2BR/1BA home in Forestdale! Conveniently located with many updates already made, this home is perfect for investors or owner occupants looking to add some sweat equity. Previously leased with a long-term tenant well below market value, This is an AS-IS sale. The home requires significant renovations, potentially including foundation repairs. Prospective buyers should perform their own inspections and assessments to determine the full scope of work needed. Central HVAC is present but not in working order.
Key facts
- 9,583 sq ft lot
- 2 garage spots
- Built 1955
Neighborhood map
What this means for you Summary
Snapshot
- This is a 3-bed/1.0-bath single-family listed at $50k.
Deal economics
- At list price, monthly cash flow is $225 ($3k/yr) — positive.
- The deal already cash-flows at list — no discount required.
- Meets the 1% rule at list price ($1k rent vs $50k).
- Recommended offer: $48k (3.0% below list) — sets the bar for market timing.
Location & tenants
- Location reads 58/100 on livability (#367 in AL) — a working-class tenant base; expect higher turnover. Strengths: cost of living A+, housing A+; Watch: employment D+, amenities F, commute F.
- Jefferson County (suburban): math 9% / reading 32% proficiency, ranked #104 of 129 in AL (top 81%) — low school quality limits family demand, transient renter base, plan for 1-2y turnover.
- Zoned schools: Minor High School (math 4% / reading 8%, grade F, #275 of 305 statewide, top 90%, 915 students, 84% FRL) — zoned schools average 84% FRL vs 49% district-wide (35 pts higher); higher-poverty schools than district average — tighter screening recommended.
- Zoned-school proficiency averages 6% at this address vs 20% district-wide (-15 pts) — the specific schools serving this property underperform the Jefferson County average; the district grade overstates school quality for this exact location.
- Market conditions: Rents flat; 116 active listings in the ZIP; 5 comparable units currently listed for rent nearby; rentals at typical pace (median 20d on market — plan ~3-4 weeks tenant-placement turnaround); 40% of comp listings sitting > 30 days — soft ceiling on asking rent; 2,114 units permitted in Jefferson County in 2024 (556 in 5+ unit buildings).
Forward outlook
- Local home prices are declining (-3.0%/yr); year-one equity from $345 of loan paydown is wiped out by about $1k of value loss. Plan a longer hold.
- Jefferson County population projected to shrink 4% by 2050 — rents likely to lag national; underwrite the cash flow, not the appreciation.
- At projected returns (-3.0% appreciation + 0.7% rent growth), your $14k cash investment doubles in ~9 years — after that, you're playing with house money.
Negotiation context
- It's been on market 45 days — a 3% lower offer ($48k) is reasonable based on typical stale-listing flexibility.
- 2 sale attempts; this cycle's ask has dropped $35k (41%) from the opening price — seller is motivated, your offer sets the floor, not the list.
- Current owner paid $25k; list at $50k implies a 100% gain — meaningful room to come down on a strong offer.
Risks & watch-outs
- Watch-outs: flood insurance adds $427/mo; built in 1955 — expect roof / HVAC / electrical / plumbing capex.
- Climate carrying-cost: in FEMA flood zone AE (mandatory federal flood insurance); major wind risk, 27% chance of damaging wind over 30y; extreme-heat days projected 7→19/yr by 2055 (HVAC capex compounding) — expect insurance premiums to compound above CPI over the hold.
Questions for the listing agent
- It's been on market 45 days. Have you received any prior offers? Is the seller open to a 3% concession, seller financing, or rate buy-down credit?
- Built in 1955 — when were the roof, HVAC, electrical panel, plumbing, and water heater last replaced?
- What's the actual annual flood-insurance premium (NFIP or private), and is the property in a SFHA with mandatory coverage?
- Is there a deadline driving the sale (1031 exchange, divorce, estate, relocation)? That informs how much negotiation room exists.
- Schools are D-rated, which usually means shorter tenancies and higher turnover. Who's the typical renter profile here, and what's been the actual vacancy rate?
- What's the average days-on-market for RENTAL listings here right now (not sales)? A rising rental-DOM trend means longer vacancies and softer asking-rent achievability than the comps imply.
- What's the recent tenant-quality profile in this submarket — average credit score on applications, eviction rate, late-payment / NSF rate, and stable-employment percentage? A property-management company in the area should have these aggregated.
- How much new for-sale + rental construction is in the pipeline within 1–3 miles? Heavy new supply typically softens prices + rents 12–24 months out; constrained supply supports both.
Investment metrics
- 1% rule
- 2.50% ✓
- Cap rate
- 21.97%
- Cash-on-cash
- 55.98%
- DSCR
- 3.49
- GRM
- 3.3
CMA / ARV
- ARV (on-the-fly)
- $114,540
- Comps found
- 6
Show comp detail 6 sales within ~0.75 mi
| Address | Dist | Beds/Ba | Sqft | Sold | Price | $/sf | Match |
|---|---|---|---|---|---|---|---|
| 133 Mulberry Rd | 0.00mi | 2/1.0 (-1) | 996 (0%) | 1mo | $43,000 | $43 | 94 |
| 9 Hedgewood Dr | 0.09mi | 3/1.0 | 1,000 (+0%) | 22mo | $88,500 | $89 | 77 |
| 229 Varden Hill Dr | 0.58mi | 3/1.0 | 997 (+0%) | 7mo | $115,000 | $115 | 67 |
| 2215 Arcadia Rd | 0.33mi | 3/1.0 | 1,138 (+14%) | 3mo | $115,000 | $101 | 58 |
| 645 Reba St | 0.66mi | 3/1.0 | 1,066 (+7%) | 8mo | $172,000 | $161 | 50 |
| 1646 Roberta Ln | 0.53mi | 3/2.0 | 960 (-4%) | 22mo | $155,000 | $161 | 47 |
Match score weights: distance 35% · size 25% · config 20% · recency 20%. Top-matched comps best support the ARV.
Projected returns pro-forma
-3.0% appreciation · 0.74% rent growth · sell at horizon
- IRR
- 7.2%
- Equity multiple
- 1.27×
- Total profit
- $3,761
- Equity at exit
- $7,440
- IRR
- 13.0%
- Equity multiple
- 1.86×
- Total profit
- $11,985
- Equity at exit
- $4,314
Cash invested: $13,972 (down + closing). Projections, not guarantees.
Landlord ↔ Tenant lean methodology
- Overall (STATE)
- 90 Strongly Landlord-Friendly
- State Alabama
- 90 Strongly Landlord-Friendly · R+15
- County
- — inherits STATE
- City
- — inherits STATE
ZIP-level market 35214
- Home prices YoY
- -20.0%
- Rents YoY
- 0.7%
- Active inventory
- 116
- Price-to-rent
- 3.3×
Monthly cashflow live
- Estimated rent
- $1,247 high interval (Pro) →
- Mortgage (P&I)
- −$262
- Tax from tax record
- −$51 /mo · $611/yr
- Insurance
- −$21
- Flood insurance flood zone
- −$427 /mo · $5,118/yr
- HOA
- −$0
- Vacancy / Maint / Mgmt
- −$262
- Net cashflow
- $225
Break-even live
Sensitivity live
| Price | -10% $253 | -5% $239 | +0% $225 | +5% $211 | +10% $197 |
|---|---|---|---|---|---|
| Rent | -10% $127 | -5% $176 | +0% $225 | +5% $275 | +10% $324 |
| Rate | -1.0pp $250 | -0.5pp $238 | base $225 | +0.5pp $212 | +1.0pp $199 |
UW: 25.0% down · 7.5% · 30yr · 1.5% tax · 5.0% vac · 8.0% maint · 8.0% mgmt
Financing live
Cash to close
- Down payment
- $12,475
- Closing costs
- $1,497
- Reserves months
- —
- Total cash needed
- —
Loan-product check · same deal, 3 products live
Conventional
25% down · 7.5% · 30yr
- Down + closing
- —
- Monthly P&I
- —
- Monthly cashflow
- —
- DSCR
- —
- Eligible?
- —
Personal DTI + credit; lowest rate.
DSCR
20% down · 8.5% · 30yr
- Down + closing
- —
- Monthly P&I
- —
- Monthly cashflow
- —
- DSCR
- —
- Eligible?
- —
No personal income docs; deal must DSCR.
Hard money
10% down · 12.0% · 12mo
- Down + closing
- —
- Monthly P&I
- —
- Monthly cashflow
- —
- DSCR
- —
- Eligible?
- —
Short-term bridge; refi at stabilization.
Rent comps 5 comps
| Address | Beds | Baths | Sqft | Rent | $/sqft | DOM | Units | Dist |
|---|---|---|---|---|---|---|---|---|
| 779 Heflin Ave E Birmingham, AL | 3.0 | 1.5 | 1052 | $1,100 | $1.05 | 19d | 1 | 1.12mi |
| 1344 Pratt Hwy Birmingham, AL | 3.0 | 2.0 | 936 | $980 | $1.05 | 44d | 1 | 1.19mi |
| 115 Crabapple Ln Birmingham, AL | 1.0–3.0 | 1.0–2.0 | 906 | $1,027 | $1.13 | 11d | 19 | 1.46mi |
| 1143 Oakley Dr Birmingham, AL | 3.0 | 1.0 | 1066 | $1,300 | $1.22 | 44d | 1 | 1.48mi |
| 1204 Pratt Hwy Birmingham, AL | 3.0 | 1.0 | 1124 | $1,125 | $1.00 | 16d | 1 | 1.48mi |
Listing history 7 events
-
2026-04-23status Pending
-
2026-04-15price $49,900
-
2026-04-15status Active
-
2026-04-02historical Contingent
-
2026-03-24price $79,900
-
2026-03-09$84,500 Active
-
1991-05-01soldstatus $25,000
ⓘ Source: listings_history table (triggers on properties + properties_extension) + one-shot
backfill from property_details.listing_events for pre-trigger history.
Tax reassessment forecast AL · Resets to sale price
- Current annual tax
- $611 · $51/mo
- Projected year-2 tax
- $611 · $51/mo
- Expected delta
- $0/yr ($0/mo · 0.0%)
ⓘ Screening estimate from a state-policy table — verify with the county assessor before closing.
Climate risk First Street
- Flood 8/10 Severe FEMA zone AE · 79% chance over 30 yrs
- Wildfire 2/10 Low
- Heat 6/10 Major 7 d/yr ≥106°F today · 19 d/yr by 30 yrs out
- Wind 6/10 Major 27% chance of damaging wind over 30 yrs
- Air quality 4/10 Moderate 4 unhealthy d/yr today · 8 by 30 yrs out
Nearby sold comps map
Loading sold comps map…
Walkable amenities ~0.75 mi
Loading nearby amenities…
Taxation est. · year 1
- Rental income
- $14,965
- − Mortgage interest
- −$2,795
- − Property taxes
- −$611
- − Insurance
- −$5,368
- − Repairs & maintenance
- −$1,197
- − Management
- −$1,197
- − Depreciation
- −$1,452
- Taxable income
- $2,345
- Est. tax owed @ 24.0%
- −$563
- After-tax cash flow
- $2,140/yr
For passive investors: Depreciation is non-cash, so a rental often shows a tax loss while cash-flowing — sheltering income. Rental losses are passive: they offset passive income freely, and up to $25,000/yr can offset ordinary (W-2) income if you actively participate and your MAGI is under $100k (phasing out to $0 by $150k); unused losses carry forward. On sale, claimed depreciation is recaptured at up to 25%, and gains may owe capital-gains tax (a 1031 exchange can defer both). Figures are a year-1 estimate at your 24.0% rate — not tax advice; consult a CPA.
Schools (NCES district)
- District
- Jefferson County
- NCES district ID
- 0101920
- Math proficiency
- 9% ▼ -24.00%
- Reading proficiency
- 32% ▼ -5.00%
- Median HH income
- $51,712
- Composite
- 18.4/100
- National rank
- #8937
- State rank
- #104 of 129 in AL
Livability — Forestdale
- Score
- 58/100
- State rank
- #367
- US rank
- #21236
Category grades
Schools grade is shown separately in the Schools card above.
Census & demographics
- Census place
- Forestdale, AL
- County
- Jefferson County · 527,445 people
- City population
- 17,027
- Metro
- Birmingham-Hoover, AL
- Population (ZIP)
- 17,027
- Household income
- $56,383
- Rent vs Own
- Severe rent burden
- 578.0
Population outlook (Jefferson County) Hauer SSP2
- Today (2025)
- 669,185 people
- By 2030
- 669,694 · +0.1%
- By 2040
- 661,388 · -1.2%
- By 2050
- 643,086 · -3.9%
- By 2075
- 577,267 · -13.7%
- By 2100
- 474,758 · -29.1%
Race, ethnicity, and origin ACS 2023
- Neighborhood character
- Predominantly Black (77%)
- Race & ethnicity
- Black 77% White 18% Two or more races 2%
- Foreign-born
- 1% · Canada
- Languages at home
- 98% English-only · Spanish 2%
Political lean MEDSL · Jefferson
- 2024 margin
- D (+10.4) · D 54.6% · R 44.2% · Other 1.2%
- 2008→2024 swing
- +5.4pp toward D · 2008: 5.1pp · 2024: 10.4pp
- All cycles
- 2024: D+10.4 2020: D+13.2 2016: D+7.2 2012: D+6.0 2008: D+5.1
Not yet ingested
- Civics
- —
Market trends
- HPI YoY
- ▼ -54.48%
- Current HPI
- 218.5233
- Rent YoY
- ▲ 0.74%
- Metro
- Birmingham-Hoover, AL
- State GDP YoY
- ▲ 2.94%
- F500 in state
- 4
Industry mix (Fortune 500 HQ in AL)
| Industry | F500 HQs | Revenue |
|---|---|---|
| Financial Services | 1 | $8B |
|
||
| Healthcare | 1 | $5B |
|
||
Price history
+99.6% since first listed7 events — show timeline
- 2026-04-23 Pending — Greater Alabama MLS
- 2026-04-15 Price Changed $49,900 Greater Alabama MLS
- 2026-04-15 Relisted — Greater Alabama MLS
- 2026-04-02 Contingent — Greater Alabama MLS
- 2026-03-24 Price Changed $79,900 Greater Alabama MLS
- 2026-03-09 Listed $84,500 Greater Alabama MLS
- 1991-05-01 Sold (Public Records) $25,000 Public Records
Property tax history
+1.9%/yrLatest (2025): $611 · +0.0% YoY. Source: county tax records.
Cash-flow waterfall
monthlySold comps — $/sqft
last 12 mo · ≤1 miLoading sold comps…