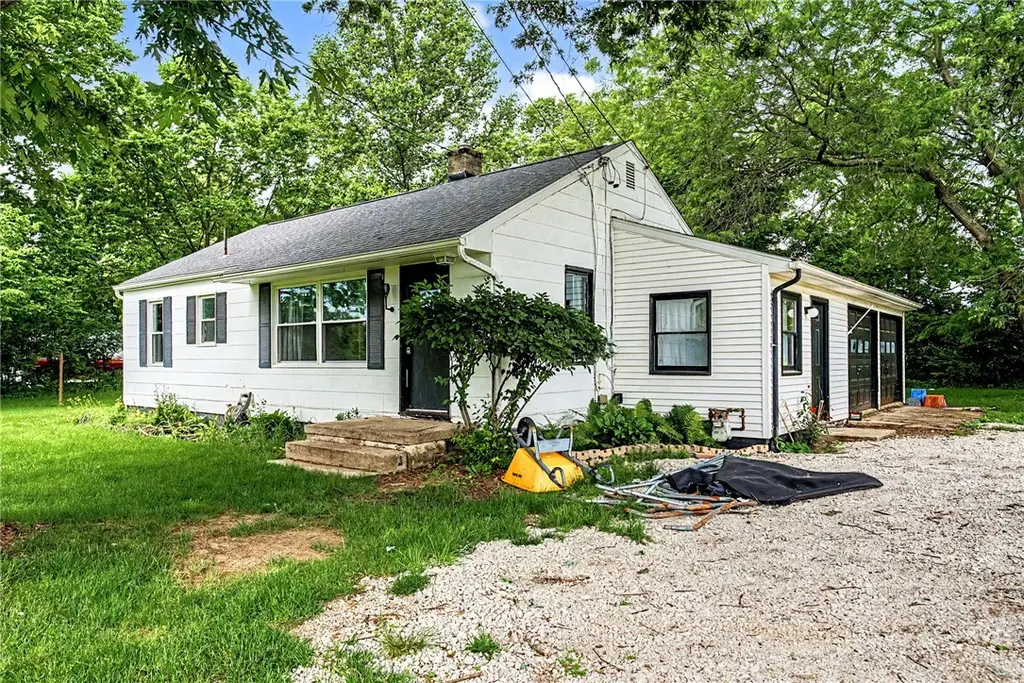
7040 S County Road 25a · Tipp City, OH
Flood risk 1/10 · Minimal
- FEMA flood zone
- X (unshaded)
- Chance of flooding over 30 yrs
- 0.0%
- Est. flood insurance / yr
- $507 – $1,088
Fire risk 1/10 · Minimal
- Est. fire insurance / yr
- $713 – $1,323
Heat risk 3/10 · Minor
- Hot days now (above 100°F)
- 7 days/yr
- Hot days in 30 yrs
- 17 days/yr
Wind risk 2/10 · Minimal
- Chance of severe wind over 30 yrs
- —
Air-quality risk 3/10 · Minor
- Unhealthy air days now
- 2 days/yr
- Unhealthy air days in 30 yrs
- 4 days/yr
Risk factors via First Street. Map © Google.
Why this score? — see what drove the C grade
The composite is a weighted blend of 9 inputs, each scored 0–100. Each bar is that input's sub-score; the figure is the points it added to the 100-point composite (weight × sub-score).
- Cash flow +23.6/30.0
- DSCR +7.6/10.0
- ARV discount +7.5/15.0
- Schools +6.3/10.0
- 1% rule +5.1/10.0
- Livability +4.0/5.0
- Rent growth +2.5/5.0
- Condition / age +2.5/5.0
- Appreciation +0.0/10.0
$170,000
🖨 Deal sheet 📄 Offer letter ✓ Due diligence
Listing remarks MLS
This one won’t last long! Newly remodeled 3 bedroom, 1 bath in a country setting is an absolute gem! Gorgeous modern farmhouse interiors: new gray/white paint throughout, new luxury vinyl plank flooring, and brand new windows, roof, gutters, and fascia. Complete kitchen and bathroom remodel with brand new stainless steel dishwasher and range. A laundry/mud room was added increasing sq footage and features a beautiful wood ceiling which contributes to the home’s authenticity and charm. 2-car attached garage offers plenty of space and possibility. This would make an adorable first home, or a fantastic home for those downsizing or a small family. No rear neighbors to be seen, the property sits on half acre that backs up to an open field – perfect for outdoor recreation or family gathering. An ideal yard for a fire pit and fun fall nights. Easy access to I75. Schedule a showing today!
Key facts
- 0.51 acre lot
- 2 garage spots
- Built 1953
Tags
Property features AI
Finance
- Financial info: Offered for sale
Exterior
- Parking: Attached two-car garage
- Utilities: Natural gas heating
- Home design: Single-story home
- Construction: Aluminum siding, vinyl siding and frame construction
- Exterior features: Half-acre residential lot (approximately 0.51 acres); Lot dimensions approximately 120 x 199
Interior
- Kitchen: Kitchen on main level (10 x 12); Dishwasher
- Bedrooms: Main level bedrooms (three): 11 x 13, 9 x 11, 10 x 10
- Bathrooms: One full bathroom on the main level
- Heating & cooling: Forced air heating (natural gas); Central air conditioning
- Interior features: Crawl space basement
- Laundry & utility: Mud room on main level (6 x 8)
Neighborhood map
What this means for you Summary
Snapshot
- This is a 3-bed/1.0-bath single-family listed at $170k.
Deal economics
- At list price, monthly cash flow is $319 ($4k/yr) — positive.
- The deal already cash-flows at list — no discount required.
- Meets the 1% rule at list price ($2k rent vs $170k).
- Recommended offer: $167k (1.5% below list) — sets the bar for market timing.
- Cap rate 8.5% vs local median 3.1% in Tipp City — top-decile yield for the area; either an underpriced asset or a hidden risk that comps aren't pricing in. Stress-test before assuming the spread holds.
Location & tenants
- Location reads 80/100 on livability (#125 in OH, #1,827 nationally) — a professional / high-income tenant draw. Strengths: schools A+, cost of living A+, housing A+; Watch: amenities F, commute F.
- Tipp City Exempted Village (suburban): math 70% / reading 76% proficiency, ranked #108 of 656 in OH (top 16%) — strong family-tenant draw, lease renewals of 3-5y typical; only 14% free/reduced lunch — higher-income household profile.
- Market conditions: 250 active listings in the ZIP; 1 comparable units currently listed for rent nearby; solid renter incomes; 326 units permitted in Miami County in 2024 (0 in 5+ unit buildings).
Forward outlook
- Local home prices are declining (-3.0%/yr); year-one equity from $1k of loan paydown is wiped out by about $5k of value loss. Plan a longer hold.
Negotiation context
- It's been on market 16 days — a 2% lower offer ($167k) is reasonable based on typical stale-listing flexibility.
- 4 sale attempts since 6y ago with the ask held roughly flat each time — persistent listings suggest the price (not the market) is what's stuck; bring a comps-based counter.
- Current owner paid $142k; 20% above their basis — modest negotiation headroom, anchor on the comps not their cost.
Risks & watch-outs
- Watch-outs: built in 1953 — expect roof / HVAC / electrical / plumbing capex.
Questions for the listing agent
- Built in 1953 — when were the roof, HVAC, electrical panel, plumbing, and water heater last replaced?
- Is there a deadline driving the sale (1031 exchange, divorce, estate, relocation)? That informs how much negotiation room exists.
- Schools are A-rated — typically a magnet for longer-tenancy family renters. What's the average tenant stay here, and is there a school-zone premium baked into asking?
- What's the average days-on-market for RENTAL listings here right now (not sales)? A rising rental-DOM trend means longer vacancies and softer asking-rent achievability than the comps imply.
- What's the recent tenant-quality profile in this submarket — average credit score on applications, eviction rate, late-payment / NSF rate, and stable-employment percentage? A property-management company in the area should have these aggregated.
- How much new for-sale + rental construction is in the pipeline within 1–3 miles? Heavy new supply typically softens prices + rents 12–24 months out; constrained supply supports both.
Investment metrics
- 1% rule
- 1.01% ✓
- Cap rate
- 8.55%
- Cash-on-cash
- 8.05%
- DSCR
- 1.36
- GRM
- 8.3
CMA / ARV
No comps found within radius.
Projected returns pro-forma
-3.0% appreciation · 3.0% rent growth · sell at horizon
- IRR
- -4.1%
- Equity multiple
- 0.85×
- Total profit
- $-7,261
- Equity at exit
- $25,348
- IRR
- 5.6%
- Equity multiple
- 1.41×
- Total profit
- $19,635
- Equity at exit
- $14,698
Cash invested: $47,600 (down + closing). Projections, not guarantees.
Landlord ↔ Tenant lean methodology
- Overall (STATE)
- 73 Landlord-Friendly
- State Ohio
- 73 Landlord-Friendly · R+6
- County
- — inherits STATE
- City
- — inherits STATE
ZIP-level market 45371
- Active inventory
- 250
- Price-to-rent
- 8.3×
Monthly cashflow live
- Estimated rent
- $1,716 medium interval (Pro) →
- Mortgage (P&I)
- −$891
- Tax from tax record
- −$74 /mo · $886/yr
- Insurance
- −$71
- HOA
- −$0
- Vacancy / Maint / Mgmt
- −$360
- Net cashflow
- $319
Break-even live
UW: 25.0% down · 7.5% · 30yr · 1.5% tax · 5.0% vac · 8.0% maint · 8.0% mgmt
Financing live
Cash to close
- Down payment
- $42,500
- Closing costs
- $5,100
- Reserves months
- —
- Total cash needed
- —
Loan-product check · same deal, 3 products live
Conventional
25% down · 7.5% · 30yr
- Down + closing
- —
- Monthly P&I
- —
- Monthly cashflow
- —
- DSCR
- —
- Eligible?
- —
Personal DTI + credit; lowest rate.
DSCR
20% down · 8.5% · 30yr
- Down + closing
- —
- Monthly P&I
- —
- Monthly cashflow
- —
- DSCR
- —
- Eligible?
- —
No personal income docs; deal must DSCR.
Hard money
10% down · 12.0% · 12mo
- Down + closing
- —
- Monthly P&I
- —
- Monthly cashflow
- —
- DSCR
- —
- Eligible?
- —
Short-term bridge; refi at stabilization.
Rent comps 1 comps
| Address | Beds | Baths | Sqft | Rent | $/sqft | DOM | Units | Dist |
|---|---|---|---|---|---|---|---|---|
| 550 Kitrina Ave Unit 1 Tipp City, OH | 2.0 | 1.0 | 950 | $1,200 | $1.26 | 3d | 1 | 0.61mi |
Listing history 11 events
-
2026-06-18days on market $170,000 Active 16 DOM
-
2026-06-17days on market $170,000 Active 15 DOM
-
2026-06-16statusdays on market $170,000 Active 14 DOM
-
2026-06-15days on market $170,000 ActiveUnderContract 13 DOM
-
2026-06-14days on market $170,000 ActiveUnderContract 11 DOM
-
2026-06-10days on market $170,000 ActiveUnderContract 8 DOM
-
2026-06-09days on market $170,000 ActiveUnderContract 7 DOM
-
2026-06-08days on market $170,000 ActiveUnderContract 6 DOM
-
2026-06-07statusdays on market $170,000 ActiveUnderContract 5 DOM
-
2026-06-03remarks 163-char remark
-
2026-06-03$170,000 Active 1 DOM
ⓘ Source: listings_history table (triggers on properties + properties_extension) + one-shot
backfill from property_details.listing_events for pre-trigger history.
Tax reassessment forecast OH · Partial reset (capped growth)
- Current annual tax
- $886 · $74/mo
- Projected year-2 tax
- $1,769 · $147/mo
- Expected delta
- +$883/yr (+$74/mo · 99.7%)
ⓘ Screening estimate from a state-policy table — verify with the county assessor before closing.
Climate risk First Street
- Flood 1/10 Low FEMA zone X (unshaded) · 0% chance over 30 yrs
- Wildfire 1/10 Low
- Heat 3/10 Moderate 7 d/yr ≥100°F today · 17 d/yr by 30 yrs out
- Wind 2/10 Low
- Air quality 3/10 Moderate 2 unhealthy d/yr today · 4 by 30 yrs out
Nearby sold comps map
Loading sold comps map…
Walkable amenities ~0.75 mi
Loading nearby amenities…
Taxation est. · year 1
- Rental income
- $20,591
- − Mortgage interest
- −$9,523
- − Property taxes
- −$886
- − Insurance
- −$850
- − Repairs & maintenance
- −$1,647
- − Management
- −$1,647
- − Depreciation
- −$4,945
- Taxable income
- $1,093
- Est. tax owed @ 24.0%
- −$262
- After-tax cash flow
- $3,571/yr
For passive investors: Depreciation is non-cash, so a rental often shows a tax loss while cash-flowing — sheltering income. Rental losses are passive: they offset passive income freely, and up to $25,000/yr can offset ordinary (W-2) income if you actively participate and your MAGI is under $100k (phasing out to $0 by $150k); unused losses carry forward. On sale, claimed depreciation is recaptured at up to 25%, and gains may owe capital-gains tax (a 1031 exchange can defer both). Figures are a year-1 estimate at your 24.0% rate — not tax advice; consult a CPA.
Schools (NCES district)
- District
- Tipp City Exempted Village
- NCES district ID
- 3904561
- Math proficiency
- 70% ▼ -9.00%
- Reading proficiency
- 76% ▼ -5.00%
- Median HH income
- $63,580
- Composite
- 63.13/100
- National rank
- #642
- State rank
- #108 of 656 in OH
Livability — Tipp City
- Score
- 80/100
- State rank
- #125
- US rank
- #1827
Category grades
Schools grade is shown separately in the Schools card above.
Census & demographics
- County
- Miami County · 85,667 people
- Metro
- Dayton-Kettering, OH
- Population (ZIP)
- 22,865
- Household income
- $93,599
- Rent vs Own
- Severe rent burden
- 465.0
Population outlook (Miami County) Hauer SSP2
- Today (2025)
- 107,816 people
- By 2030
- 108,896 · +1.0%
- By 2040
- 109,581 · +1.6%
- By 2050
- 108,110 · +0.3%
- By 2075
- 101,523 · -5.8%
- By 2100
- 85,787 · -20.4%
Race, ethnicity, and origin ACS 2023
- Neighborhood character
- Predominantly White (88%)
- Race & ethnicity
- White 88% Two or more races 6% Asian 3% Hispanic / Latino 2% Black 2%
- Common ancestry
- Lithuanian 3% Romanian 3% Scotch-Irish 2%
- Foreign-born
- 6% · Canada
- Languages at home
- 92% English-only · Other Asian/Pacific 3% Russian/Polish/Slavic 1% Spanish 1%
Political lean MEDSL · Miami
- 2024 margin
- Solid R (+45.1) · D 27.0% · R 72.1%
- 2008→2024 swing
- -16.6pp toward R · 2008: -28.5pp · 2024: -45.1pp
- All cycles
- 2024: R+45.1 2020: R+44.3 2016: R+45.6 2012: R+35.6 2008: R+28.5
Not yet ingested
- Civics
- —
Market trends
- HPI YoY
- ▼ -178.63%
- Current HPI
- 205.0064
- Rent YoY
- —
- Metro
- Dayton-Kettering, OH
- State GDP YoY
- ▲ 1.98%
- F500 in state
- 48
Industry mix (Fortune 500 HQ in OH)
| Industry | F500 HQs | Revenue |
|---|---|---|
| Insurance | 3 | $145B |
|
||
| Industrial Machinery | 3 | $49B |
|
||
| Financial Services | 3 | $24B |
|
||
| Consumer Goods | 2 | $93B |
|
||
| Aerospace / Defense | 2 | $47B |
|
||
| Utilities | 2 | $33B |
|
||
Price history
+161.9% since first listed13 events — show timeline
- 2026-06-02 Listed $170,000 Dayton MLS
- 2020-12-02 Sold (Public Records) $141,500 Public Records
- 2020-11-30 Sold (MLS) $141,500 WRIST
- 2020-11-30 Sold (MLS) $141,500 Dayton MLS
- 2020-11-30 Sold (MLS) $141,500 Dayton MLS
- 2020-10-30 Pending — Dayton MLS
- 2020-10-27 Listed $137,000 WRIST
- 2020-10-26 Listed $137,000 Dayton MLS
- 2020-08-05 Sold (Public Records) $60,400 Public Records
- 2020-08-03 Sold (MLS) $60,400 Dayton MLS
- 2020-08-03 Sold (MLS) $60,400 Dayton MLS
- 2020-07-17 Contingent — Dayton MLS
- 2020-07-15 Listed $64,900 Dayton MLS
Property tax history
+3.2%/yrLatest (2025): $886 · -47.7% YoY. Source: county tax records.
Cash-flow waterfall
monthlySold comps — $/sqft
last 12 mo · ≤1 miLoading sold comps…