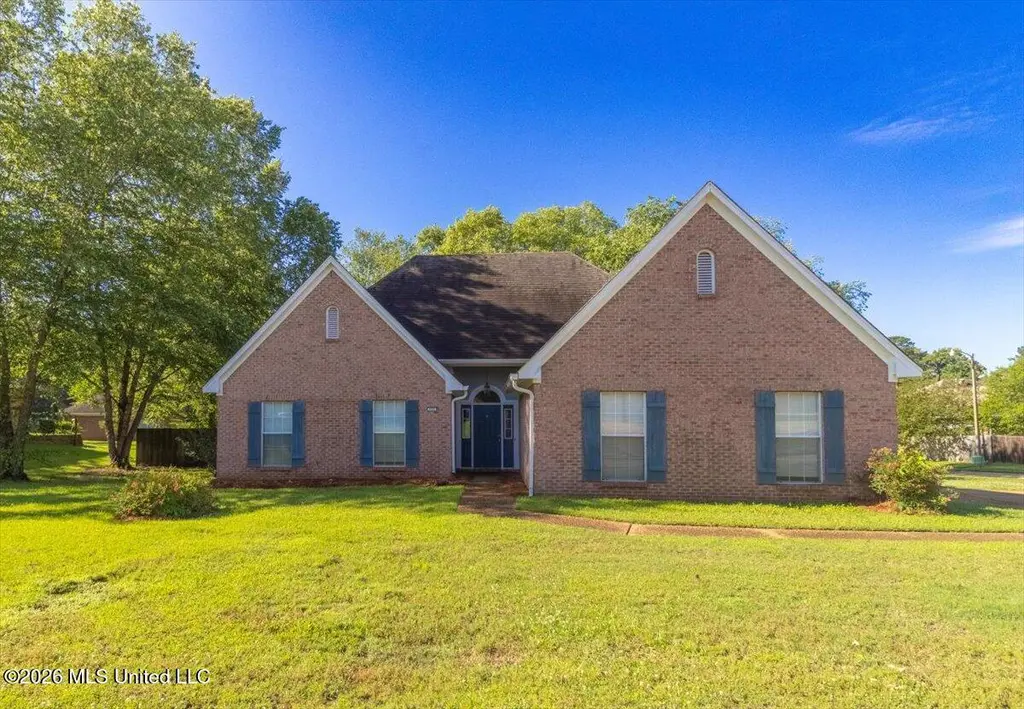
220 Moss Valley Cir · Brandon, MS
Flood risk 1/10 · Minimal
- FEMA flood zone
- X (unshaded)
- Chance of flooding over 30 yrs
- 0.0%
- Est. flood insurance / yr
- $507 – $1,088
Fire risk 4/10 · Minor
- Est. fire insurance / yr
- $1,241 – $2,305
Heat risk 7/10 · Major
- Hot days now (above 108°F)
- 7 days/yr
- Hot days in 30 yrs
- 20 days/yr
Wind risk 8/10 · Major
- Chance of severe wind over 30 yrs
- 80.0%
Air-quality risk 2/10 · Minimal
- Unhealthy air days now
- 1 days/yr
- Unhealthy air days in 30 yrs
- 1 days/yr
Risk factors via First Street. Map © Google.
Why this score? — see what drove the D- grade
The composite is a weighted blend of 9 inputs, each scored 0–100. Each bar is that input's sub-score; the figure is the points it added to the 100-point composite (weight × sub-score).
- Cash flow +10.3/30.0
- ARV discount +7.6/15.0
- Schools +4.6/10.0
- Rent growth +4.3/5.0
- Livability +4.0/5.0
- DSCR +2.9/10.0
- 1% rule +2.7/10.0
- Condition / age +2.5/5.0
- Appreciation +0.0/10.0
$259,900
🖨 Deal sheet 📄 Offer letter ✓ Due diligence
Listing remarks MLS
You won't find a more immaculate home. Decorator Colors and updated everything. Move in READY. HIGH ceilings in living. New architectural shingles. Side entry garage. Wonderful yard, landscape and deck. Good working family floorplan. Pride of ownership throughout. 3/2/2 with two dining areas and sep. laundry. Come See. Won't last long.
Key facts
- Walk-in closet
- Tile flooring
- Double vanities
Tags
Property features AI
Exterior
- Parking: 4-car garage; Garage door opener
- Security: Smoke detectors
- Utilities: Public water; Public sewer; Sewer available; Cat-5 prewired
- Home design: Single family residence (house); One level
- Construction: Brick construction; Conventional foundation; Architectural shingle roof; Move-in ready
- Exterior features: Private yard; Deck; Wood fencing; Corner lot; Cul-de-sac lot; Front yard
Interior
- Kitchen: Dishwasher; Disposal; Microwave; Exhaust fan; Gas water heater (serves kitchen)
- Bathrooms: 2 full bathrooms
- Heating & cooling: Central heating (natural gas); Central air conditioning; Ceiling fans; Gas heating/cooling components
- Interior features: Cathedral ceilings and vaulted ceiling(s); High ceilings; Entrance foyer; Double vanity; Walk-in closets; Eat-in kitchen; Built-in sound system; Fireplace in living room and bath; Has fireplace
- Laundry & utility: Water heater; Cat-5 prewired
Neighborhood map
What this means for you Summary
Snapshot
- This is a 3-bed/2.0-bath single-family listed at $260k.
Deal economics
- At list price, monthly cash flow is $-144 ($-2k/yr) — negative.
- To cash-flow at today's rent, offer at most $234k (9.8% below list).
- To meet the 1% rule (rent ≥ 1% of price), the offer needs to be $201k (22.8% below list).
- Recommended offer: $201k (22.8% below list) — sets the bar for 1% rule.
- Cap rate 5.6% vs local median 4.2% in Brandon — top-decile yield for the area; either an underpriced asset or a hidden risk that comps aren't pricing in. Stress-test before assuming the spread holds.
Location & tenants
- Location reads 81/100 on livability (#3 in MS, #1,514 nationally) — a professional / high-income tenant draw. Strengths: crime A+, employment A+, cost of living A+; Watch: amenities F, commute F.
- Rankin County School District (rural): math 56% / reading 48% proficiency, ranked #6 of 130 in MS (top 5%) — acceptable for families but not a draw, mixed tenant base, ~2y average lease.
- Zoned schools: Brandon Elementary School (math 69% / reading 65%, grade B+, #11 of 375 statewide, top 3%, 741 students, 100% FRL); Brandon Middle School (math 67% / reading 49%, grade B, #11 of 179 statewide, top 6%, 1,193 students, 100% FRL); Brandon High School (math 47% / reading 49%, grade D, #27 of 197 statewide, top 13%, 1,648 students, 100% FRL) — zoned schools average 100% FRL vs 35% district-wide (65 pts higher); higher-poverty schools than district average — tighter screening recommended.
- Market conditions: Rents rising fast (+7.1%/yr); 302 active listings in the ZIP; 3 comparable units currently listed for rent nearby; rentals at typical pace (median 24d on market — plan ~3-4 weeks tenant-placement turnaround); solid renter incomes; 343 units permitted in Rankin County in 2024 (0 in 5+ unit buildings).
Forward outlook
- Local home prices are declining (-3.0%/yr); year-one equity from $2k of loan paydown is wiped out by about $8k of value loss. Plan a longer hold.
- Rankin County population projected at +17% by 2050 — long-run rental-demand tailwind backs the buy-and-hold thesis.
Negotiation context
- Only 12 days on market — expect competitive offers; lowballing is unlikely to land.
- 5 sale attempts since 18y ago with the ask held roughly flat each time — persistent listings suggest the price (not the market) is what's stuck; bring a comps-based counter.
Risks & watch-outs
- Climate carrying-cost: severe wind risk, 80% chance of damaging wind over 30y; extreme-heat days projected 7→20/yr by 2055 (HVAC capex compounding) — expect insurance premiums to compound above CPI over the hold.
Questions for the listing agent
- What do current leases actually rent for vs. the listed asking? Can we see a recent rent roll and the last 12 months of T-12 income?
- Is there a deadline driving the sale (1031 exchange, divorce, estate, relocation)? That informs how much negotiation room exists.
- Schools are A-rated — typically a magnet for longer-tenancy family renters. What's the average tenant stay here, and is there a school-zone premium baked into asking?
- The area grade is low — what's the realistic commute time and amenity access for the typical tenant pool here? Any planned neighborhood developments (good or bad) we should know about?
- What's the average days-on-market for RENTAL listings here right now (not sales)? A rising rental-DOM trend means longer vacancies and softer asking-rent achievability than the comps imply.
- What's the recent tenant-quality profile in this submarket — average credit score on applications, eviction rate, late-payment / NSF rate, and stable-employment percentage? A property-management company in the area should have these aggregated.
- How much new for-sale + rental construction is in the pipeline within 1–3 miles? Heavy new supply typically softens prices + rents 12–24 months out; constrained supply supports both.
Investment metrics
- 1% rule
- 0.77% ✗
- Cap rate
- 5.63%
- Cash-on-cash
- -2.38%
- DSCR
- 0.89
- GRM
- 10.8
CMA / ARV
- ARV (median comp)
- $260,414
- List price
- $259,900
- Delta
- -0.20%
- Verdict
- FAIR
- Comps
- 20 within 1.0 mi
Show comp detail 12 sales within ~0.75 mi
| Address | Dist | Beds/Ba | Sqft | Sold | Price | $/sf | Match |
|---|---|---|---|---|---|---|---|
| 100 Rollingwood Dr | 0.42mi | 3/2.0 | 1,511 (+0%) | 1mo | $247,500 | $164 | 79 |
| 104 Afton Dr | 0.14mi | 3/2.0 | 1,427 (-5%) | 7mo | $235,000 | $165 | 79 |
| 321 Busick Well Rd | 0.20mi | 3/2.0 | 1,465 (-3%) | 10mo | $199,900 | $136 | 78 |
| 215 Moss Valley Dr | 0.03mi | 3/2.0 | 1,627 (+8%) | 11mo | $262,000 | $161 | 76 |
| 301 Old Town Cir | 0.27mi | 3/2.0 | 1,635 (+9%) | 4mo | $259,900 | $159 | 70 |
| 308 Rollingwood Ave | 0.27mi | 3/3.0 | 1,609 (+7%) | 7mo | $152,000 | $94 | 66 |
| 430 Stoneybrook Dr | 0.39mi | 2/2.0 (-1) | 1,448 (-4%) | 10mo | $239,000 | $165 | 62 |
| 437 Old Town Cir | 0.44mi | 3/2.0 | 1,676 (+11%) | 5mo | $260,000 | $155 | 56 |
| 1120 Ellington Ct | 0.68mi | 3/2.0 | 1,581 (+5%) | 6mo | $253,000 | $160 | 54 |
| 724 S College St | 0.55mi | 2/1.0 (-1) | 1,385 (-8%) | 1mo | $239,900 | $173 | 51 |
| 526 E Jasper St | 0.54mi | 3/2.0 | 1,700 (+13%) | 4mo | $259,000 | $152 | 50 |
| 105 E Sunset | 0.56mi | 4/2.0 (+1) | 1,700 (+13%) | 3mo | $129,900 | $76 | 45 |
Match score weights: distance 35% · size 25% · config 20% · recency 20%. Top-matched comps best support the ARV.
Projected returns pro-forma
-3.0% appreciation · 7.13% rent growth · sell at horizon
- IRR
- -15.9%
- Equity multiple
- 0.41×
- Total profit
- $-42,627
- Equity at exit
- $38,752
- IRR
- -1.8%
- Equity multiple
- 0.86×
- Total profit
- $-10,195
- Equity at exit
- $22,471
Cash invested: $72,772 (down + closing). Projections, not guarantees.
Landlord ↔ Tenant lean methodology
- Overall (STATE)
- 90 Strongly Landlord-Friendly
- State Mississippi
- 90 Strongly Landlord-Friendly · R+11
- County
- — inherits STATE
- City
- — inherits STATE
ZIP-level market 39042
- Home prices YoY
- -34.3%
- Rents YoY
- 7.1%
- Active inventory
- 302
- Price-to-rent
- 10.8×
Monthly cashflow live
- Estimated rent
- $2,006 medium interval (Pro) →
- Mortgage (P&I)
- −$1,363
- Tax from tax record
- −$258 /mo · $3,090/yr
- Insurance
- −$108
- HOA
- −$0
- Vacancy / Maint / Mgmt
- −$421
- Net cashflow
- $-144
Break-even live
UW: 25.0% down · 7.5% · 30yr · 1.5% tax · 5.0% vac · 8.0% maint · 8.0% mgmt
Financing live
Cash to close
- Down payment
- $64,975
- Closing costs
- $7,797
- Reserves months
- —
- Total cash needed
- —
Loan-product check · same deal, 3 products live
Conventional
25% down · 7.5% · 30yr
- Down + closing
- —
- Monthly P&I
- —
- Monthly cashflow
- —
- DSCR
- —
- Eligible?
- —
Personal DTI + credit; lowest rate.
DSCR
20% down · 8.5% · 30yr
- Down + closing
- —
- Monthly P&I
- —
- Monthly cashflow
- —
- DSCR
- —
- Eligible?
- —
No personal income docs; deal must DSCR.
Hard money
10% down · 12.0% · 12mo
- Down + closing
- —
- Monthly P&I
- —
- Monthly cashflow
- —
- DSCR
- —
- Eligible?
- —
Short-term bridge; refi at stabilization.
Rent comps 3 comps
| Address | Beds | Baths | Sqft | Rent | $/sqft | DOM | Units | Dist |
|---|---|---|---|---|---|---|---|---|
| 202 Overby St Brandon, MS | 3.0 | 2.0 | 1394 | $1,786 | $1.28 | 43d | 1 | 0.98mi |
| 114 Fox Meadow Dr Brandon, MS | 3.0 | 2.0 | 1500 | $2,250 | $1.50 | 13d | 1 | 1.02mi |
| 1500 Chapelridge Way Brandon, MS | 3.0 | 2.0 | 1081 | $1,609 | $1.49 | 23d | 1 | 1.17mi |
Listing history 12 events
-
2026-05-13status Pending 705-char remark
-
2026-04-29$259,900 Active 705-char remark
-
2024-10-27historical $1,945
-
2024-10-12$1,945
-
2024-10-12historical $1,945
-
2024-10-05$1,945
-
2024-02-11historical $1,705
-
2024-01-07$1,705
-
2021-10-29soldstatus
-
2021-10-29soldstatus
-
2008-06-04soldstatus 337-char remark
Show marketing remark (337 chars)
You won't find a more immaculate home. Decorator Colors and updated everything. Move in READY. HIGH ceilings in living. New architectural shingles. Side entry garage. Wonderful yard, landscape and deck. Good working family floorplan. Pride of ownership throughout. 3/2/2 with two dining areas and sep. laundry. Come See. Won't last long.
-
2008-05-14$159,900 337-char remark
Show marketing remark (337 chars)
You won't find a more immaculate home. Decorator Colors and updated everything. Move in READY. HIGH ceilings in living. New architectural shingles. Side entry garage. Wonderful yard, landscape and deck. Good working family floorplan. Pride of ownership throughout. 3/2/2 with two dining areas and sep. laundry. Come See. Won't last long.
ⓘ Source: listings_history table (triggers on properties + properties_extension) + one-shot
backfill from property_details.listing_events for pre-trigger history.
Tax reassessment forecast MS · Resets to sale price
- Current annual tax
- $3,090 · $258/mo
- Projected year-2 tax
- $3,090 · $258/mo
- Expected delta
- $0/yr ($0/mo · 0.0%)
ⓘ Screening estimate from a state-policy table — verify with the county assessor before closing.
Climate risk First Street
- Flood 1/10 Low FEMA zone X (unshaded) · 0% chance over 30 yrs
- Wildfire 4/10 Moderate
- Heat 7/10 Severe 7 d/yr ≥108°F today · 20 d/yr by 30 yrs out
- Wind 8/10 Severe 80% chance of damaging wind over 30 yrs
- Air quality 2/10 Low 1 unhealthy d/yr today · 1 by 30 yrs out
Nearby sold comps map
Loading sold comps map…
Walkable amenities ~0.75 mi
Loading nearby amenities…
Taxation est. · year 1
- Rental income
- $24,070
- − Mortgage interest
- −$14,558
- − Property taxes
- −$3,090
- − Insurance
- −$1,300
- − Repairs & maintenance
- −$1,926
- − Management
- −$1,926
- − Depreciation
- −$7,561
- Taxable loss
- −$6,290
- Est. tax savings @ 24.0%
- +$1,510
- After-tax cash flow
- $-220/yr
For passive investors: Depreciation is non-cash, so a rental often shows a tax loss while cash-flowing — sheltering income. Rental losses are passive: they offset passive income freely, and up to $25,000/yr can offset ordinary (W-2) income if you actively participate and your MAGI is under $100k (phasing out to $0 by $150k); unused losses carry forward. On sale, claimed depreciation is recaptured at up to 25%, and gains may owe capital-gains tax (a 1031 exchange can defer both). Figures are a year-1 estimate at your 24.0% rate — not tax advice; consult a CPA.
Schools (NCES district)
- District
- Rankin County School District
- NCES district ID
- 2803830
- Math proficiency
- 56% ▼ -4.00%
- Reading proficiency
- 48% ▼ -6.00%
- Median HH income
- $61,867
- Composite
- 45.62/100
- National rank
- #2587
- State rank
- #6 of 130 in MS
Livability — Brandon
- Score
- 81/100
- State rank
- #3
- US rank
- #1514
Category grades
Schools grade is shown separately in the Schools card above.
Census & demographics
- Census place
- Brandon, MS
- County
- Rankin County · 123,614 people
- City population
- 79,950
- Metro
- Jackson, MS
- Population (ZIP)
- 39,142
- Household income
- $88,597
- Rent vs Own
- Severe rent burden
- 474.0
Population outlook (Rankin County) Hauer SSP2
- Today (2025)
- 164,317 people
- By 2030
- 171,013 · +4.1%
- By 2040
- 182,723 · +11.2%
- By 2050
- 192,376 · +17.1%
- By 2075
- 209,535 · +27.5%
- By 2100
- 209,534 · +27.5%
Race, ethnicity, and origin ACS 2023
- Neighborhood character
- Predominantly White (75%)
- Race & ethnicity
- White 75% Black 21% Hispanic / Latino 2% Two or more races 2%
- Common ancestry
- Italian 5% Slovak 2% Iranian 2%
- Foreign-born
- 2% · Canada
- Languages at home
- 97% English-only · Spanish 2%
Political lean MEDSL · Rankin
- 2024 margin
- Solid R (+47.1) · D 25.9% · R 73.0% · Other 1.0%
- 2008→2024 swing
- +6.4pp toward D · 2008: -53.5pp · 2024: -47.1pp
- All cycles
- 2024: R+47.1 2020: R+45.4 2016: R+52.9 2012: R+51.9 2008: R+53.5
Not yet ingested
- Civics
- —
Market trends
- HPI YoY
- ▼ -90.04%
- Current HPI
- 172.5248
- Rent YoY
- ▲ 7.13%
- Metro
- Jackson, MS
- State GDP YoY
- —
- F500 in state
- 0
Price history
+62.5% since first listed12 events — show timeline
- 2026-05-13 Pending — MLSU
- 2026-04-29 Listed $259,900 MLSU
- 2024-10-27 Rental Removed $1,945 RENTLY
- 2024-10-12 Listed for Rent $1,945 RENTLY
- 2024-10-12 Rental Removed $1,945 RENTLY
- 2024-10-05 Listed for Rent $1,945 RENTLY
- 2024-02-11 Rental Removed $1,705 RENTLY
- 2024-01-07 Listed for Rent $1,705 RENTLY
- 2021-10-29 Sold (Public Records) — Public Records
- 2021-10-29 Sold (Public Records) — Public Records
- 2008-06-04 Sold (MLS) — MLSU
- 2008-05-14 Listed $159,900 MLSU
Property tax history
+7.8%/yrLatest (2025): $3,090 · +1.3% YoY. Source: county tax records.
Cash-flow waterfall
monthlySold comps — $/sqft
last 12 mo · ≤1 miLoading sold comps…