2006 N Lake Ln · Nixa, MO
Flood risk 1/10 · Minimal
- FEMA flood zone
- X (unshaded)
- Chance of flooding over 30 yrs
- 0.0%
- Est. flood insurance / yr
- $473 – $860
Fire risk 3/10 · Minor
- Est. fire insurance / yr
- $1,054 – $1,958
Heat risk 4/10 · Minor
- Hot days now (above 104°F)
- 6 days/yr
- Hot days in 30 yrs
- 17 days/yr
Wind risk 2/10 · Minimal
- Chance of severe wind over 30 yrs
- —
Air-quality risk 1/10 · Minimal
- Unhealthy air days now
- 0 days/yr
- Unhealthy air days in 30 yrs
- 0 days/yr
Risk factors via First Street. Map © Google.
Why this score? — see what drove the D grade
The composite is a weighted blend of 9 inputs, each scored 0–100. Each bar is that input's sub-score; the figure is the points it added to the 100-point composite (weight × sub-score).
- Cash flow +12.0/30.0
- ARV discount +7.5/15.0
- Schools +5.6/10.0
- Rent growth +3.9/5.0
- Livability +3.7/5.0
- DSCR +3.5/10.0
- Condition / age +2.5/5.0
- 1% rule +2.3/10.0
- Appreciation +0.0/10.0
$235,000
🖨 Deal sheet 📄 Offer letter ✓ Due diligence
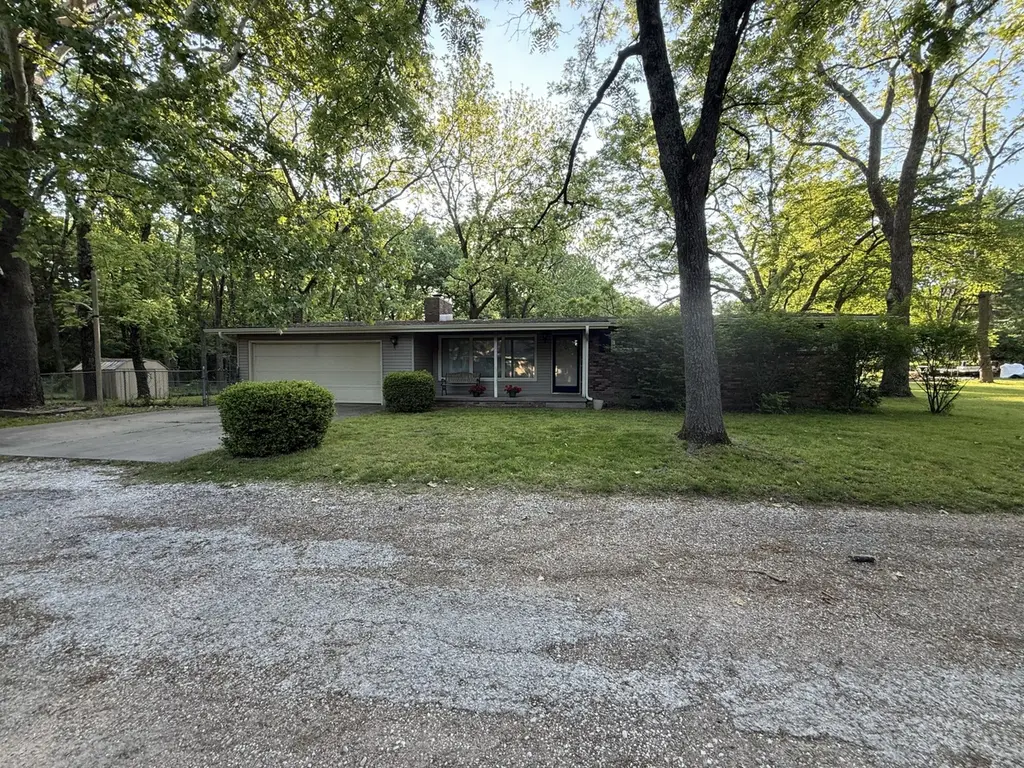
Listing remarks
One-of-a-kind property in Nixa that has been loved and well cared for over the years! Situated on nearly a half-acre lot on the north side of Nixa, this home offers an easy commute via Hwy 160.Featuring 3 bedrooms, 2 full baths, and 2 living areas, there's plenty of space to spread out and enjoy. Step outside to a fenced backyard perfect for pets, play, or entertaining, sitting on almost half an acre. Bonus opportunity: the adjoining 2-acre lot is also available to purchase for an additional price. Conveniently located near shopping, dining, and everything Nixa has to offer!
Key facts
- 0.39 acre lot
- 2 garage spots
- Built 1963
Neighborhood map
What this means for you Summary
Snapshot
- This is a 3-bed/2.0-bath other listed at $235k.
Deal economics
- At list price, monthly cash flow is $-56 ($-677/yr) — negative.
- To cash-flow at today's rent, offer at most $225k (4.2% below list).
- To meet the 1% rule (rent ≥ 1% of price), the offer needs to be $172k (27.0% below list).
- Recommended offer: $172k (27.0% below list) — sets the bar for 1% rule.
- Cap rate 6.0% vs local median 3.7% in Nixa — top-decile yield for the area; either an underpriced asset or a hidden risk that comps aren't pricing in. Stress-test before assuming the spread holds.
Location & tenants
- Location reads 74/100 on livability (#68 in MO, #4,558 nationally) — a middle-class / working-renter tenant base. Strengths: crime A+, cost of living A+, housing A+; Watch: amenities F, commute F, health & safety F.
- Nixa Public Schools (suburban): math 66% / reading 65% proficiency, ranked #6 of 324 in MO (top 2%) — acceptable for families but not a draw, mixed tenant base, ~2y average lease.
- Zoned schools: Nixa Junior High (math 70% / reading 61%, grade A-, #3 of 391 statewide, top 1%, 1,067 students, 29% FRL); Nixa High (math 70% / reading 77%, grade B+, #6 of 521 statewide, top 1%, 1,957 students, 24% FRL) — zoned schools at 26% FRL track the district average.
- Market conditions: Rents rising fast (+5.7%/yr); 396 active listings in the ZIP; solid renter incomes; 537 units permitted in Christian County in 2024 (0 in 5+ unit buildings).
Forward outlook
- Local home prices are declining (-3.0%/yr); year-one equity from $2k of loan paydown is wiped out by about $7k of value loss. Plan a longer hold.
- Christian County population projected at +24% by 2050 — long-run rental-demand tailwind backs the buy-and-hold thesis.
Negotiation context
- Only 0 days on market — expect competitive offers; lowballing is unlikely to land.
Questions for the listing agent
- What do current leases actually rent for vs. the listed asking? Can we see a recent rent roll and the last 12 months of T-12 income?
- Built in 1963 — when were the roof, HVAC, electrical panel, plumbing, and water heater last replaced?
- Is there a deadline driving the sale (1031 exchange, divorce, estate, relocation)? That informs how much negotiation room exists.
- Schools are B-rated — typically a magnet for longer-tenancy family renters. What's the average tenant stay here, and is there a school-zone premium baked into asking?
- The area grade is low — what's the realistic commute time and amenity access for the typical tenant pool here? Any planned neighborhood developments (good or bad) we should know about?
- What's the average days-on-market for RENTAL listings here right now (not sales)? A rising rental-DOM trend means longer vacancies and softer asking-rent achievability than the comps imply.
- What's the recent tenant-quality profile in this submarket — average credit score on applications, eviction rate, late-payment / NSF rate, and stable-employment percentage? A property-management company in the area should have these aggregated.
- How much new for-sale + rental construction is in the pipeline within 1–3 miles? Heavy new supply typically softens prices + rents 12–24 months out; constrained supply supports both.
Investment metrics
- 1% rule
- 0.73% ✗
- Cap rate
- 6.00%
- Cash-on-cash
- -1.03%
- DSCR
- 0.95
- GRM
- 11.4
CMA / ARV
No comps found within radius.
Projected returns pro-forma
-3.0% appreciation · 5.67% rent growth · sell at horizon
- IRR
- -15.5%
- Equity multiple
- 0.44×
- Total profit
- $-37,045
- Equity at exit
- $35,039
- IRR
- -3.5%
- Equity multiple
- 0.74×
- Total profit
- $-16,796
- Equity at exit
- $20,319
Cash invested: $65,800 (down + closing). Projections, not guarantees.
Landlord ↔ Tenant lean methodology
- Overall (STATE)
- 81 Strongly Landlord-Friendly
- State Missouri
- 81 Strongly Landlord-Friendly · R+10
- County
- — inherits STATE
- City
- — inherits STATE
ZIP-level market 65714
- Home prices YoY
- -25.0%
- Rents YoY
- 5.7%
- Active inventory
- 396
- Price-to-rent
- 11.4×
Monthly cashflow live
- Estimated rent
- $1,716 medium interval (Pro) →
- Mortgage (P&I)
- −$1,232
- Tax from tax record
- −$82 /mo · $980/yr
- Insurance
- −$98
- HOA
- −$0
- Vacancy / Maint / Mgmt
- −$360
- Net cashflow
- $-56
Break-even live
UW: 25.0% down · 7.5% · 30yr · 1.5% tax · 5.0% vac · 8.0% maint · 8.0% mgmt
Financing live
Cash to close
- Down payment
- $58,750
- Closing costs
- $7,050
- Reserves months
- —
- Total cash needed
- —
Loan-product check · same deal, 3 products live
Conventional
25% down · 7.5% · 30yr
- Down + closing
- —
- Monthly P&I
- —
- Monthly cashflow
- —
- DSCR
- —
- Eligible?
- —
Personal DTI + credit; lowest rate.
DSCR
20% down · 8.5% · 30yr
- Down + closing
- —
- Monthly P&I
- —
- Monthly cashflow
- —
- DSCR
- —
- Eligible?
- —
No personal income docs; deal must DSCR.
Hard money
10% down · 12.0% · 12mo
- Down + closing
- —
- Monthly P&I
- —
- Monthly cashflow
- —
- DSCR
- —
- Eligible?
- —
Short-term bridge; refi at stabilization.
Listing history 3 events
-
2026-05-08historical
-
2026-05-07$235,000
-
1980-10-01soldstatus
ⓘ Source: listings_history table (triggers on properties + properties_extension) + one-shot
backfill from property_details.listing_events for pre-trigger history.
Tax reassessment forecast MO · Resets to sale price
- Current annual tax
- $980 · $82/mo
- Projected year-2 tax
- $2,280 · $190/mo
- Expected delta
- +$1,299/yr (+$108/mo · 132.5%)
ⓘ Screening estimate from a state-policy table — verify with the county assessor before closing.
Climate risk First Street
- Flood 1/10 Low FEMA zone X (unshaded) · 0% chance over 30 yrs
- Wildfire 3/10 Moderate
- Heat 4/10 Moderate 6 d/yr ≥104°F today · 17 d/yr by 30 yrs out
- Wind 2/10 Low
- Air quality 1/10 Low 0 unhealthy d/yr today · 0 by 30 yrs out
Nearby sold comps map
Loading sold comps map…
Walkable amenities ~0.75 mi
Loading nearby amenities…
Taxation est. · year 1
- Rental income
- $20,591
- − Mortgage interest
- −$13,164
- − Property taxes
- −$980
- − Insurance
- −$1,175
- − Repairs & maintenance
- −$1,647
- − Management
- −$1,647
- − Depreciation
- −$6,836
- Taxable loss
- −$4,859
- Est. tax savings @ 24.0%
- +$1,166
- After-tax cash flow
- $489/yr
For passive investors: Depreciation is non-cash, so a rental often shows a tax loss while cash-flowing — sheltering income. Rental losses are passive: they offset passive income freely, and up to $25,000/yr can offset ordinary (W-2) income if you actively participate and your MAGI is under $100k (phasing out to $0 by $150k); unused losses carry forward. On sale, claimed depreciation is recaptured at up to 25%, and gains may owe capital-gains tax (a 1031 exchange can defer both). Figures are a year-1 estimate at your 24.0% rate — not tax advice; consult a CPA.
Schools (NCES district)
- District
- Nixa Public Schools
- NCES district ID
- 2922530
- Math proficiency
- 66% ▲ 8.00%
- Reading proficiency
- 65% ▲ 4.00%
- Median HH income
- $54,073
- Composite
- 56.04/100
- National rank
- #1186
- State rank
- #6 of 324 in MO
Livability — Nixa
- Score
- 74/100
- State rank
- #68
- US rank
- #4558
Category grades
Schools grade is shown separately in the Schools card above.
Census & demographics
- County
- Christian County · 70,465 people
- City population
- 37,013
- Metro
- Springfield, MO
- Population (ZIP)
- 37,013
- Household income
- $86,765
- Rent vs Own
- Severe rent burden
- 769.0
Population outlook (Christian County) Hauer SSP2
- Today (2025)
- 95,071 people
- By 2030
- 100,379 · +5.6%
- By 2040
- 109,902 · +15.6%
- By 2050
- 117,487 · +23.6%
- By 2075
- 130,738 · +37.5%
- By 2100
- 131,730 · +38.6%
Race, ethnicity, and origin ACS 2023
- Neighborhood character
- Predominantly White (89%)
- Race & ethnicity
- White 89% Two or more races 4% Hispanic / Latino 4% Asian 2% Black 1%
- Common ancestry
- Italian 3% Slovak 3% Lithuanian 2%
- Foreign-born
- 4% · Canada, Vietnam
- Languages at home
- 94% English-only · Spanish 3% Russian/Polish/Slavic 2% Vietnamese 1%
Political lean MEDSL · Christian
- 2024 margin
- Solid R (+52.2) · D 23.3% · R 75.6% · Other 1.1%
- 2008→2024 swing
- -16.4pp toward R · 2008: -35.8pp · 2024: -52.2pp
- All cycles
- 2024: R+52.2 2020: R+50.8 2016: R+54.2 2012: R+46.5 2008: R+35.8
Not yet ingested
- Civics
- —
Market trends
- HPI YoY
- ▼ -71.42%
- Current HPI
- 213.8371
- Rent YoY
- ▲ 5.67%
- Metro
- Springfield, MO
- State GDP YoY
- ▲ 1.84%
- F500 in state
- 20
Industry mix (Fortune 500 HQ in MO)
| Industry | F500 HQs | Revenue |
|---|---|---|
| Healthcare | 1 | $163B |
|
||
| Insurance | 1 | $21B |
|
||
| Industrial Technology | 1 | $17B |
|
||
| Retail | 1 | $16B |
|
||
| Industrial Distribution | 1 | $10B |
|
||
| Utilities | 1 | $9B |
|
||
Price history
3 events — show timeline
- 2026-05-08 Delisted — SOMO
- 2026-05-07 Listed $235,000 SOMO
- 1980-10-01 Sold (Public Records) — Public Records
Property tax history
+2.6%/yrLatest (2025): $980 · +2.0% YoY. Source: county tax records.
Cash-flow waterfall
monthlySold comps — $/sqft
last 12 mo · ≤1 miLoading sold comps…