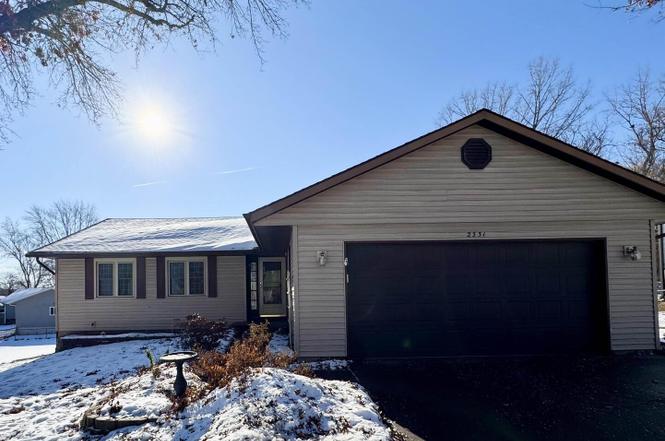
2331 Cameron Dr Dr · Clinton, IA
Flood risk 1/10 · Minimal
- FEMA flood zone
- X (unshaded)
- Chance of flooding over 30 yrs
- 0.0%
- Est. flood insurance / yr
- $473 – $860
Fire risk 3/10 · Minor
- Est. fire insurance / yr
- $902 – $1,676
Heat risk 3/10 · Minor
- Hot days now (above 103°F)
- 7 days/yr
- Hot days in 30 yrs
- 16 days/yr
Wind risk 2/10 · Minimal
- Chance of severe wind over 30 yrs
- —
Air-quality risk 3/10 · Minor
- Unhealthy air days now
- 2 days/yr
- Unhealthy air days in 30 yrs
- 3 days/yr
Risk factors via First Street. Map © Google.
Why this score? — see what drove the C- grade
The composite is a weighted blend of 9 inputs, each scored 0–100. Each bar is that input's sub-score; the figure is the points it added to the 100-point composite (weight × sub-score).
- ARV discount +15.0/15.0
- Cash flow +13.7/30.0
- Schools +4.5/10.0
- 1% rule +4.2/10.0
- DSCR +4.1/10.0
- Livability +3.8/5.0
- Rent growth +2.5/5.0
- Condition / age +2.5/5.0
- Appreciation +0.0/10.0
$139,000
🖨 Deal sheet (PDF) 📄 Offer letter ✓ Due diligence
Listing remarks
New listing in the beloved Cameron Oaks subdivision! This home offers a spacious layout at 1,300 square feet of living space on the main level, as well as an additional 1,300 square feet of space in the basement. The main level offers a primary suite with a full bathroom and a walk in closet. On the other side of the home, there are 2 additional bedrooms and a full bathroom. The living room holds beautiful French doors that lead to the deck and offer tons of natural light! The basement has a finished rec room, and SO MUCH STORAGE! The mechanicals have been updated throughout the years. There is an attached 2 car garage, and the lot is . 21 acres with a fence.
Key facts
- Finished rec room
- Primary suite
- French doors
Tags
Neighborhood map
What this means for you Summary
Snapshot
- This is a 3-bed/2.0-bath single-family listed at $139k.
Deal economics
- At list price, monthly cash flow is $10 ($119/yr) — positive.
- The deal already cash-flows at list — no discount required.
- To meet the 1% rule (rent ≥ 1% of price), the offer needs to be $128k (8.1% below list).
- Recommended offer: $128k (8.1% below list) — sets the bar for 1% rule.
Location & tenants
- Location reads 75/100 on livability (#222 in IA, #4,192 nationally) — a middle-class / working-renter tenant base. Strengths: cost of living A+, housing A+, health & safety A+; Watch: amenities C-, crime D, employment D.
- Clinton Community School District (town): math 52% / reading 56% proficiency, ranked #273 of 289 in IA (top 94%) — acceptable for families but not a draw, mixed tenant base, ~2y average lease.
- Zoned schools: Whittier Elementary School (math 82% / reading 77%, grade A, #71 of 616 statewide, top 15%, 354 students, 41% FRL); Clinton Middle School (math 49% / reading 53%, grade C, #210 of 246 statewide, top 87%, 749 students, 59% FRL); Clinton High School (math 43% / reading 57%, grade D+, #313 of 336 statewide, top 93%, 981 students, 49% FRL) — zoned schools at 50% FRL track the district average.
- Market conditions: 247 active listings in the ZIP; 1 comparable units currently listed for rent nearby; 116 units permitted in Clinton County in 2024 (50 in 5+ unit buildings).
Forward outlook
- Local home prices are declining (-3.0%/yr); year-one equity from $961 of loan paydown is wiped out by about $4k of value loss. Plan a longer hold.
- Clinton County population projected at -19% by 2050 — secular population decline; favor cash flow + early exit over multi-decade hold.
Negotiation context
- Only 1 days on market — expect competitive offers; lowballing is unlikely to land.
Questions for the listing agent
- Built in 1978 — when were the roof, HVAC, electrical panel, plumbing, and water heater last replaced?
- Is there a deadline driving the sale (1031 exchange, divorce, estate, relocation)? That informs how much negotiation room exists.
- Schools are B-rated — typically a magnet for longer-tenancy family renters. What's the average tenant stay here, and is there a school-zone premium baked into asking?
- Crime grade is D in this area — have there been break-ins, vandalism, or insurance claims at this property in the last 3 years? What carrier currently insures it and at what premium?
- What's the average days-on-market for RENTAL listings here right now (not sales)? A rising rental-DOM trend means longer vacancies and softer asking-rent achievability than the comps imply.
- What's the recent tenant-quality profile in this submarket — average credit score on applications, eviction rate, late-payment / NSF rate, and stable-employment percentage? A property-management company in the area should have these aggregated.
- How much new for-sale + rental construction is in the pipeline within 1–3 miles? Heavy new supply typically softens prices + rents 12–24 months out; constrained supply supports both.
Investment metrics
- 1% rule
- 0.92% ✗
- Cap rate
- 6.38%
- Cash-on-cash
- 0.31%
- DSCR
- 1.01
- GRM
- 9.1
CMA / ARV
- ARV (on-the-fly)
- $172,900
- Comps found
- 6
Show comp detail 6 sales within ~0.75 mi
| Address | Dist | Beds/Ba | Sqft | Sold | Price | $/sf | Match |
|---|---|---|---|---|---|---|---|
| 1404 Windsor Ct | 0.20mi | 4/2.0 (+1) | 1,796 (-6%) | 22mo | $215,000 | $120 | 58 |
| 1908 Circle Dr S | 0.54mi | 3/2.0 | 1,773 (-7%) | 8mo | $112,500 | $63 | 57 |
| 2226 13th Ave S | 0.19mi | 3/2.0 | 1,699 (-11%) | 20mo | $117,500 | $69 | 57 |
| 2326 Lafayette Ter | 0.04mi | 4/2.5 (+1) | 1,642 (-14%) | 21mo | $170,000 | $104 | 51 |
| 2216 13th Ave S | 0.20mi | 3/2.5 | 1,626 (-14%) | 20mo | $147,900 | $91 | 47 |
| 1864 Circle Dr S | 0.62mi | 4/2.0 (+1) | 2,062 (+8%) | 24mo | $68,000 | $33 | 32 |
Match score weights: distance 35% · size 25% · config 20% · recency 20%. Top-matched comps best support the ARV.
Projected returns pro-forma
-3.0% appreciation · 3.0% rent growth · sell at horizon
- IRR
- -15.8%
- Equity multiple
- 0.44×
- Total profit
- $-21,849
- Equity at exit
- $20,725
- IRR
- -7.3%
- Equity multiple
- 0.54×
- Total profit
- $-18,039
- Equity at exit
- $12,018
Cash invested: $38,920 (down + closing). Projections, not guarantees.
Landlord ↔ Tenant lean methodology
- Overall (STATE)
- 83 Strongly Landlord-Friendly
- State Iowa
- 83 Strongly Landlord-Friendly · R+6
- County
- — inherits STATE
- City
- — inherits STATE
ZIP-level market 52732
- Home prices YoY
- -34.9%
- Active inventory
- 247
- Price-to-rent
- 9.1×
Monthly cashflow live
- Estimated rent
- $1,277 medium interval (Pro) →
- Mortgage (P&I)
- −$729
- Tax from tax record
- −$212 /mo · $2,544/yr
- Insurance
- −$58
- HOA
- −$0
- Vacancy / Maint / Mgmt
- −$268
- Net cashflow
- $10
Break-even live
Sensitivity live
| Price | -10% $89 | -5% $49 | +0% $10 | +5% $-29 | +10% $-69 |
|---|---|---|---|---|---|
| Rent | -10% $-91 | -5% $-41 | +0% $10 | +5% $60 | +10% $111 |
| Rate | -1.0pp $80 | -0.5pp $45 | base $10 | +0.5pp $-26 | +1.0pp $-63 |
UW: 25.0% down · 7.5% · 30yr · 1.5% tax · 5.0% vac · 8.0% maint · 8.0% mgmt
Financing live
Cash to close
- Down payment
- $34,750
- Closing costs
- $4,170
- Reserves months
- —
- Total cash needed
- —
Loan-product check · same deal, 3 products live
Conventional
25% down · 7.5% · 30yr
- Down + closing
- —
- Monthly P&I
- —
- Monthly cashflow
- —
- DSCR
- —
- Eligible?
- —
Personal DTI + credit; lowest rate.
DSCR
20% down · 8.5% · 30yr
- Down + closing
- —
- Monthly P&I
- —
- Monthly cashflow
- —
- DSCR
- —
- Eligible?
- —
No personal income docs; deal must DSCR.
Hard money
10% down · 12.0% · 12mo
- Down + closing
- —
- Monthly P&I
- —
- Monthly cashflow
- —
- DSCR
- —
- Eligible?
- —
Short-term bridge; refi at stabilization.
Rent comps 1 comps
| Address | Beds | Baths | Sqft | Rent | $/sqft | DOM | Units | Dist |
|---|---|---|---|---|---|---|---|---|
| 2582 Friendship Trl Clinton, IA | 1.0–3.0 | 1.0–2.5 | 1190 | $1,510 | $1.27 | 15d | 9 | 0.87mi |
Listing history 17 events
-
2026-05-24status Pending
-
2026-05-24status Pending
-
2026-05-22status Pending
-
2026-01-16soldstatus $130,000 Closed
-
2026-01-16soldstatus $130,000 Closed
-
2026-01-16soldstatus $130,000 Closed
-
2026-01-16soldstatus $130,000 Closed
-
2026-01-16soldstatus $130,000
-
2026-01-16status Pending
-
2026-01-14historical
-
2026-01-08status Pending
-
2026-01-07status Active
-
2025-12-21historical
-
2025-12-18status Pending
-
2025-12-18status Pending
-
2025-12-17historical
-
2025-12-16Active
ⓘ Source: listings_history table (triggers on properties + properties_extension) + one-shot
backfill from property_details.listing_events for pre-trigger history.
Tax reassessment forecast IA · Partial reset (capped growth)
- Current annual tax
- $2,544 · $212/mo
- Projected year-2 tax
- $2,544 · $212/mo
- Expected delta
- $0/yr ($0/mo · 0.0%)
ⓘ Screening estimate from a state-policy table — verify with the county assessor before closing.
Climate risk First Street
- Flood 1/10 Low FEMA zone X (unshaded) · 0% chance over 30 yrs
- Wildfire 3/10 Moderate
- Heat 3/10 Moderate 7 d/yr ≥103°F today · 16 d/yr by 30 yrs out
- Wind 2/10 Low
- Air quality 3/10 Moderate 2 unhealthy d/yr today · 3 by 30 yrs out
Nearby sold comps map
Loading sold comps map…
Walkable amenities ~0.75 mi
Loading nearby amenities…
Taxation est. · year 1
- Rental income
- $15,323
- − Mortgage interest
- −$7,786
- − Property taxes
- −$2,544
- − Insurance
- −$695
- − Repairs & maintenance
- −$1,226
- − Management
- −$1,226
- − Depreciation
- −$4,044
- Taxable loss
- −$2,197
- Est. tax savings @ 24.0%
- +$527
- After-tax cash flow
- $646/yr
For passive investors: Depreciation is non-cash, so a rental often shows a tax loss while cash-flowing — sheltering income. Rental losses are passive: they offset passive income freely, and up to $25,000/yr can offset ordinary (W-2) income if you actively participate and your MAGI is under $100k (phasing out to $0 by $150k); unused losses carry forward. On sale, claimed depreciation is recaptured at up to 25%, and gains may owe capital-gains tax (a 1031 exchange can defer both). Figures are a year-1 estimate at your 24.0% rate — not tax advice; consult a CPA.
Schools (NCES district)
- District
- Clinton Community School District
- NCES district ID
- 1907710
- Math proficiency
- 52% ▼ -13.00%
- Reading proficiency
- 56% ▼ -8.00%
- Median HH income
- $40,900
- Composite
- 45.22/100
- National rank
- #2666
- State rank
- #273 of 289 in IA
Livability — Clinton
- Score
- 75/100
- State rank
- #222
- US rank
- #4192
Category grades
Schools grade is shown separately in the Schools card above.
Census & demographics
- Census place
- Clinton, IA
- County
- Clinton County · 25,880 people
- City population
- 25,880
- Metro
- Clinton, IA
- Population (ZIP)
- 25,880
- Household income
- $61,105
- Rent vs Own
- Severe rent burden
- 889.0
Population outlook (Clinton County) Hauer SSP2
- Today (2025)
- 44,817 people
- By 2030
- 43,090 · -3.9%
- By 2040
- 39,513 · -11.8%
- By 2050
- 36,209 · -19.2%
- By 2075
- 31,888 · -28.8%
- By 2100
- 30,382 · -32.2%
Race, ethnicity, and origin ACS 2023
- Neighborhood character
- Predominantly White (86%)
- Race & ethnicity
- White 86% Two or more races 7% Hispanic / Latino 5% Black 4%
- Common ancestry
- Iranian 4% Portuguese 2% Lithuanian 2%
- Foreign-born
- 2% · Canada
- Languages at home
- 97% English-only · Spanish 2% Arabic 1%
Political lean MEDSL · Clinton
- 2024 margin
- R (+18.9) · D 39.8% · R 58.6% · Other 1.6%
- 2008→2024 swing
- -41.9pp toward R · 2008: 23.0pp · 2024: -18.9pp
- All cycles
- 2024: R+18.9 2020: R+10.3 2016: R+5.1 2012: D+22.9 2008: D+23.0
Not yet ingested
- Civics
- —
Market trends
- HPI YoY
- ▼ -83.23%
- Current HPI
- 155.3426
- Rent YoY
- —
- Metro
- Clinton, IA
- State GDP YoY
- ▲ 2.48%
- F500 in state
- 4
Industry mix (Fortune 500 HQ in IA)
| Industry | F500 HQs | Revenue |
|---|---|---|
| Financial Services | 1 | $16B |
|
||
| Retail / Convenience | 1 | $15B |
|
||
Price history
+0.0% since first listed17 events — show timeline
- 2026-05-24 Pending — MRED as Distributed by MLS Grid
- 2026-05-24 Pending — MRED as Distributed by MLS Grid
- 2026-05-22 Pending — MRED as Distributed by MLS Grid
- 2026-01-16 Sold (Public Records) $130,000 Public Records
- 2026-01-16 Sold (MLS) $130,000 MRED as Distributed by MLS Grid
- 2026-01-16 Sold (MLS) $130,000 MRED as Distributed by MLS Grid
- 2026-01-16 Sold (MLS) $130,000 MRED as Distributed by MLS Grid
- 2026-01-16 Sold (MLS) $130,000 MRED as Distributed by MLS Grid
- 2026-01-16 Pending — MRED as Distributed by MLS Grid
- 2026-01-14 Listing Removed — MRED as Distributed by MLS Grid
- 2026-01-08 Pending — MRED as Distributed by MLS Grid
- 2026-01-07 Relisted — MRED as Distributed by MLS Grid
- 2025-12-21 Listing Removed — MRED as Distributed by MLS Grid
- 2025-12-18 Pending — RMLSA as Distributed by MLS Grid
- 2025-12-18 Pending — MRED as Distributed by MLS Grid
- 2025-12-17 Listing Removed — RMLSA as Distributed by MLS Grid
- 2025-12-16 Listed — RMLSA as Distributed by MLS Grid
Property tax history
-0.6%/yrLatest (2025): $2,544 · -3.0% YoY. Source: county tax records.
Cash-flow waterfall
monthlySold comps — $/sqft
last 12 mo · ≤1 miLoading sold comps…