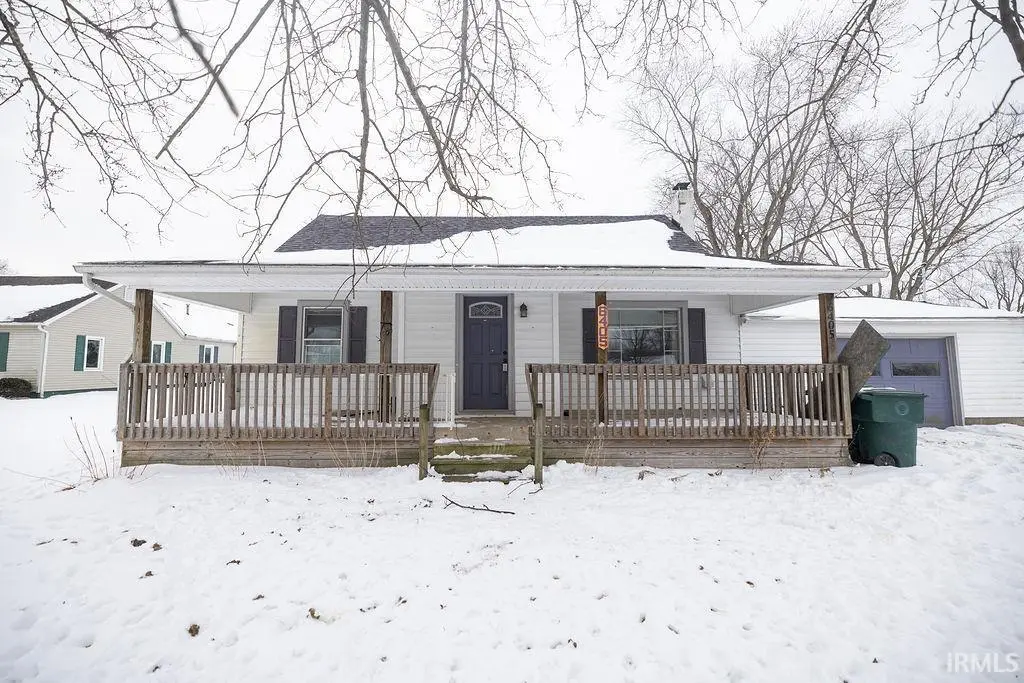
6405 W Bethel Ave · Muncie, IN
Flood risk 1/10 · Minimal
- FEMA flood zone
- X (unshaded)
- Chance of flooding over 30 yrs
- 0.0%
- Est. flood insurance / yr
- $507 – $1,088
Fire risk 1/10 · Minimal
- Est. fire insurance / yr
- $717 – $1,331
Heat risk 3/10 · Minor
- Hot days now (above 100°F)
- 7 days/yr
- Hot days in 30 yrs
- 18 days/yr
Wind risk 2/10 · Minimal
- Chance of severe wind over 30 yrs
- 1.0%
Air-quality risk 2/10 · Minimal
- Unhealthy air days now
- 1 days/yr
- Unhealthy air days in 30 yrs
- 2 days/yr
Risk factors via First Street. Map © Google.
Why this score? — see what drove the C- grade
The composite is a weighted blend of 9 inputs, each scored 0–100. Each bar is that input's sub-score; the figure is the points it added to the 100-point composite (weight × sub-score).
- Cash flow +16.3/30.0
- ARV discount +15.0/15.0
- DSCR +5.1/10.0
- Rent growth +4.5/5.0
- Livability +4.0/5.0
- 1% rule +3.4/10.0
- Schools +2.8/10.0
- Condition / age +2.5/5.0
- Appreciation +0.0/10.0
$154,900
🖨 Deal sheet 📄 Offer letter ✓ Due diligence
Listing remarks MLS
Looking for move-in ready maintenance-free home? Super location located in popular WesDel school system. Maint.-free vinyl siding, replacement windows & new ext. doors. Wonderful welcoming front porch w/treated wood floors & posts. Home has convenient entry w/sconces & coat closet. Opens to large Living Room. All new Kitchen has been enlarged & features gorgeous wood cabs, new dishwasher & mwave plus a gas stove for serious cooks! Utility room,W/D remain. 2 BR's on first floor, 1 BR on main.
Key facts
- 0.38 acre lot
- Garage
- Built 1945
Neighborhood map
What this means for you Summary
Snapshot
- This is a 3-bed/1.0-bath single-family listed at $155k.
Deal economics
- At list price, monthly cash flow is $86 ($1k/yr) — positive.
- The deal already cash-flows at list — no discount required.
- To meet the 1% rule (rent ≥ 1% of price), the offer needs to be $130k (15.8% below list).
- Recommended offer: $130k (15.8% below list) — sets the bar for 1% rule.
Location & tenants
- Location reads 80/100 on livability (#18 in IN, #1,654 nationally) — a professional / high-income tenant draw. Strengths: amenities A+, commute A+, cost of living A+; Watch: schools D+, crime F, employment F.
- Wes-Del Community Schools (rural): math 27% / reading 38% proficiency, ranked #209 of 301 in IN (top 69%) — families likely to look elsewhere, expect single-tenant / working-renter base with shorter leases.
- Market conditions: Rents rising fast (+8.1%/yr); 202 active listings in the ZIP; 1 comparable units currently listed for rent nearby; 171 units permitted in Delaware County in 2024 (57 in 5+ unit buildings).
Forward outlook
- Local home prices are declining (-3.0%/yr); year-one equity from $1k of loan paydown is wiped out by about $5k of value loss. Plan a longer hold.
- Delaware County population projected at -11% by 2050 — secular population decline; favor cash flow + early exit over multi-decade hold.
Negotiation context
- It's been on market 133 days — a 12% lower offer ($136k) is reasonable based on typical stale-listing flexibility.
- 2 sale attempts since 13y ago; this cycle's ask has dropped $10k (6%) from the opening price — seller is motivated, your offer sets the floor, not the list.
- Current owner paid $67k; list at $155k implies a 131% gain — meaningful room to come down on a strong offer.
Risks & watch-outs
- Watch-outs: built in 1945 — expect roof / HVAC / electrical / plumbing capex.
Questions for the listing agent
- It's been on market 133 days. Have you received any prior offers? Is the seller open to a 16% concession, seller financing, or rate buy-down credit?
- Built in 1945 — when were the roof, HVAC, electrical panel, plumbing, and water heater last replaced?
- Why hasn't it sold? Are there any deal-killer items the seller is aware of (foundation, flood, title, zoning, code violations)?
- Is there a deadline driving the sale (1031 exchange, divorce, estate, relocation)? That informs how much negotiation room exists.
- Schools are D-rated, which usually means shorter tenancies and higher turnover. Who's the typical renter profile here, and what's been the actual vacancy rate?
- Crime grade is F in this area — have there been break-ins, vandalism, or insurance claims at this property in the last 3 years? What carrier currently insures it and at what premium?
- What's the average days-on-market for RENTAL listings here right now (not sales)? A rising rental-DOM trend means longer vacancies and softer asking-rent achievability than the comps imply.
- What's the recent tenant-quality profile in this submarket — average credit score on applications, eviction rate, late-payment / NSF rate, and stable-employment percentage? A property-management company in the area should have these aggregated.
- How much new for-sale + rental construction is in the pipeline within 1–3 miles? Heavy new supply typically softens prices + rents 12–24 months out; constrained supply supports both.
Investment metrics
- 1% rule
- 0.84% ✗
- Cap rate
- 6.96%
- Cash-on-cash
- 2.37%
- DSCR
- 1.11
- GRM
- 9.9
CMA / ARV
- ARV (median comp)
- $199,900
- List price
- $154,900
- Delta
- -22.51%
- Verdict
- UNDERPRICED
- Comps
- 19 within 1.0 mi
Show comp detail 4 sales within ~0.75 mi
| Address | Dist | Beds/Ba | Sqft | Sold | Price | $/sf | Match |
|---|---|---|---|---|---|---|---|
| 6308 W Mcarthur Ln | 0.15mi | 3/1.5 | 1,588 (-10%) | 9mo | $205,000 | $129 | 66 |
| 3609 N Burgess Rd | 0.47mi | 3/2.0 | 1,902 (+8%) | 14mo | $275,000 | $145 | 50 |
| 3308 N Burgess Rd | 0.66mi | 3/1.5 | 1,676 (-5%) | 15mo | $193,000 | $115 | 46 |
| 5413 Westminster Blvd | 0.66mi | 2/2.0 (-1) | 1,785 (+1%) | 15mo | $240,000 | $134 | 46 |
Match score weights: distance 35% · size 25% · config 20% · recency 20%. Top-matched comps best support the ARV.
Projected returns pro-forma
-3.0% appreciation · 8.0% rent growth · sell at horizon
- IRR
- -7.7%
- Equity multiple
- 0.70×
- Total profit
- $-12,802
- Equity at exit
- $23,096
- IRR
- 6.9%
- Equity multiple
- 1.62×
- Total profit
- $27,025
- Equity at exit
- $13,393
Cash invested: $43,372 (down + closing). Projections, not guarantees.
Landlord ↔ Tenant lean methodology
- Overall (STATE)
- 90 Strongly Landlord-Friendly
- State Indiana
- 90 Strongly Landlord-Friendly · R+11
- County
- — inherits STATE
- City
- — inherits STATE
ZIP-level market 47304
- Home prices YoY
- -28.4%
- Rents YoY
- 8.1%
- Active inventory
- 202
- Price-to-rent
- 9.9×
Monthly cashflow live
- Estimated rent
- $1,304 medium interval (Pro) →
- Mortgage (P&I)
- −$812
- Tax from tax record
- −$68 /mo · $812/yr
- Insurance
- −$65
- HOA
- −$0
- Vacancy / Maint / Mgmt
- −$274
- Net cashflow
- $86
Break-even live
UW: 25.0% down · 7.5% · 30yr · 1.5% tax · 5.0% vac · 8.0% maint · 8.0% mgmt
Financing live
Cash to close
- Down payment
- $38,725
- Closing costs
- $4,647
- Reserves months
- —
- Total cash needed
- —
Loan-product check · same deal, 3 products live
Conventional
25% down · 7.5% · 30yr
- Down + closing
- —
- Monthly P&I
- —
- Monthly cashflow
- —
- DSCR
- —
- Eligible?
- —
Personal DTI + credit; lowest rate.
DSCR
20% down · 8.5% · 30yr
- Down + closing
- —
- Monthly P&I
- —
- Monthly cashflow
- —
- DSCR
- —
- Eligible?
- —
No personal income docs; deal must DSCR.
Hard money
10% down · 12.0% · 12mo
- Down + closing
- —
- Monthly P&I
- —
- Monthly cashflow
- —
- DSCR
- —
- Eligible?
- —
Short-term bridge; refi at stabilization.
Rent comps 1 comps
| Address | Beds | Baths | Sqft | Rent | $/sqft | DOM | Units | Dist |
|---|---|---|---|---|---|---|---|---|
| 4500 W Bethel Ave Muncie, IN | 2.0–4.0 | 2.0–4.0 | 1207 | $674 | $0.56 | 43d | 26 | 1.27mi |
Listing history 19 events
-
2026-06-19days on market $154,900 Active 133 DOM
-
2026-06-18days on market $154,900 Active 132 DOM
-
2026-06-17days on market $154,900 Active 131 DOM
-
2026-06-16days on market $154,900 Active 130 DOM
-
2026-06-15days on market $154,900 Active 129 DOM
-
2026-06-14days on market $154,900 Active 127 DOM
-
2026-06-13days on market $154,900 Active 126 DOM
-
2026-06-10days on market $154,900 Active 124 DOM
-
2026-06-09days on market $154,900 Active 123 DOM
-
2026-06-08days on market $154,900 Active 122 DOM
-
2026-06-07days on market $154,900 Active 121 DOM
-
2026-06-02days on market $154,900 Active 116 DOM
-
2026-06-01days on market $154,900 Active 115 DOM
-
2026-05-31days on market $154,900 Active 114 DOM
-
2026-05-30days on market $154,900 Active 113 DOM
-
2026-04-28price $159,900
-
2026-02-06$164,900 Active
-
2014-01-09soldstatus $67,000 516-char remark
Show marketing remark (516 chars)
Looking for move-in ready maintenance-free home? Super location located in popular WesDel school system. Maint.-free vinyl siding, replacement windows & new ext. doors. Wonderful welcoming front porch w/treated wood floors & posts. Home has convenient entry w/sconces & coat closet. Opens to large Living Room. All new Kitchen has been enlarged & features gorgeous wood cabs, new dishwasher & mwave plus a gas stove for serious cooks! Utility room,W/D remain. 2 BR's on first floor, 1 BR on main.
-
2013-10-02$75,000 516-char remark
Show marketing remark (516 chars)
Looking for move-in ready maintenance-free home? Super location located in popular WesDel school system. Maint.-free vinyl siding, replacement windows & new ext. doors. Wonderful welcoming front porch w/treated wood floors & posts. Home has convenient entry w/sconces & coat closet. Opens to large Living Room. All new Kitchen has been enlarged & features gorgeous wood cabs, new dishwasher & mwave plus a gas stove for serious cooks! Utility room,W/D remain. 2 BR's on first floor, 1 BR on main.
ⓘ Source: listings_history table (triggers on properties + properties_extension) + one-shot
backfill from property_details.listing_events for pre-trigger history.
Tax reassessment forecast IN · Partial reset (capped growth)
- Current annual tax
- $812 · $68/mo
- Projected year-2 tax
- $1,065 · $89/mo
- Expected delta
- +$252/yr (+$21/mo · 31.0%)
ⓘ Screening estimate from a state-policy table — verify with the county assessor before closing.
Climate risk First Street
- Flood 1/10 Low FEMA zone X (unshaded) · 0% chance over 30 yrs
- Wildfire 1/10 Low
- Heat 3/10 Moderate 7 d/yr ≥100°F today · 18 d/yr by 30 yrs out
- Wind 2/10 Low 100% chance of damaging wind over 30 yrs
- Air quality 2/10 Low 1 unhealthy d/yr today · 2 by 30 yrs out
Nearby sold comps map
Loading sold comps map…
Walkable amenities ~0.75 mi
Loading nearby amenities…
Taxation est. · year 1
- Rental income
- $15,651
- − Mortgage interest
- −$8,677
- − Property taxes
- −$812
- − Insurance
- −$774
- − Repairs & maintenance
- −$1,252
- − Management
- −$1,252
- − Depreciation
- −$4,506
- Taxable loss
- −$1,623
- Est. tax savings @ 24.0%
- +$390
- After-tax cash flow
- $1,419/yr
For passive investors: Depreciation is non-cash, so a rental often shows a tax loss while cash-flowing — sheltering income. Rental losses are passive: they offset passive income freely, and up to $25,000/yr can offset ordinary (W-2) income if you actively participate and your MAGI is under $100k (phasing out to $0 by $150k); unused losses carry forward. On sale, claimed depreciation is recaptured at up to 25%, and gains may owe capital-gains tax (a 1031 exchange can defer both). Figures are a year-1 estimate at your 24.0% rate — not tax advice; consult a CPA.
Schools (NCES district)
- District
- Wes-Del Community Schools
- NCES district ID
- 1804500
- Math proficiency
- 27% ▼ -9.00%
- Reading proficiency
- 38% ▼ -3.00%
- Median HH income
- $50,271
- Composite
- 28.26/100
- National rank
- #6795
- State rank
- #209 of 301 in IN
Livability — Muncie
- Score
- 80/100
- State rank
- #18
- US rank
- #1654
Category grades
Schools grade is shown separately in the Schools card above.
Census & demographics
- County
- Delaware County · 84,658 people
- City population
- 84,658
- Metro
- Muncie, IN
- Population (ZIP)
- 31,237
- Household income
- $63,215
- Rent vs Own
- Severe rent burden
- 1141.0
Population outlook (Delaware County) Hauer SSP2
- Today (2025)
- 113,036 people
- By 2030
- 111,313 · -1.5%
- By 2040
- 106,432 · -5.8%
- By 2050
- 100,747 · -10.9%
- By 2075
- 91,000 · -19.5%
- By 2100
- 80,687 · -28.6%
Race, ethnicity, and origin ACS 2023
- Neighborhood character
- Predominantly White (85%)
- Race & ethnicity
- White 85% Two or more races 5% Black 4% Asian 4% Hispanic / Latino 3%
- Common ancestry
- Lithuanian 2% Romanian 2% Slovak 1%
- Foreign-born
- 5% · Canada, Vietnam, China
- Languages at home
- 94% English-only · Spanish 2% Other Indo-European 1% Vietnamese 1%
Political lean MEDSL · Delaware
- 2024 margin
- R (+15.8) · D 41.2% · R 57.0% · Other 1.8%
- 2008→2024 swing
- -30.8pp toward R · 2008: 15.0pp · 2024: -15.8pp
- All cycles
- 2024: R+15.8 2020: R+13.2 2016: R+13.7 2012: D+3.1 2008: D+15.0
Not yet ingested
- Civics
- —
Market trends
- HPI YoY
- ▼ -78.53%
- Current HPI
- 197.5213
- Rent YoY
- ▲ 8.08%
- Metro
- Muncie, IN
- State GDP YoY
- ▲ 2.90%
- F500 in state
- 18
Industry mix (Fortune 500 HQ in IN)
| Industry | F500 HQs | Revenue |
|---|---|---|
| Industrial Machinery | 2 | $37B |
|
||
| Healthcare | 1 | $177B |
|
||
| Pharmaceuticals | 1 | $45B |
|
||
| Metals / Steel | 1 | $18B |
|
||
| Agriculture | 1 | $17B |
|
||
| Packaging | 1 | $12B |
|
||
Price history
+113.2% since first listed4 events — show timeline
- 2026-04-28 Price Changed $159,900 IRMLS
- 2026-02-06 Listed $164,900 IRMLS
- 2014-01-09 Sold (MLS) $67,000 MIBOR as Distributed by MLS Grid
- 2013-10-02 Listed $75,000 MIBOR as Distributed by MLS Grid
Property tax history
+9.3%/yrLatest (2024): $812 · +21.9% YoY. Source: county tax records.
Cash-flow waterfall
monthlySold comps — $/sqft
last 12 mo · ≤1 miLoading sold comps…