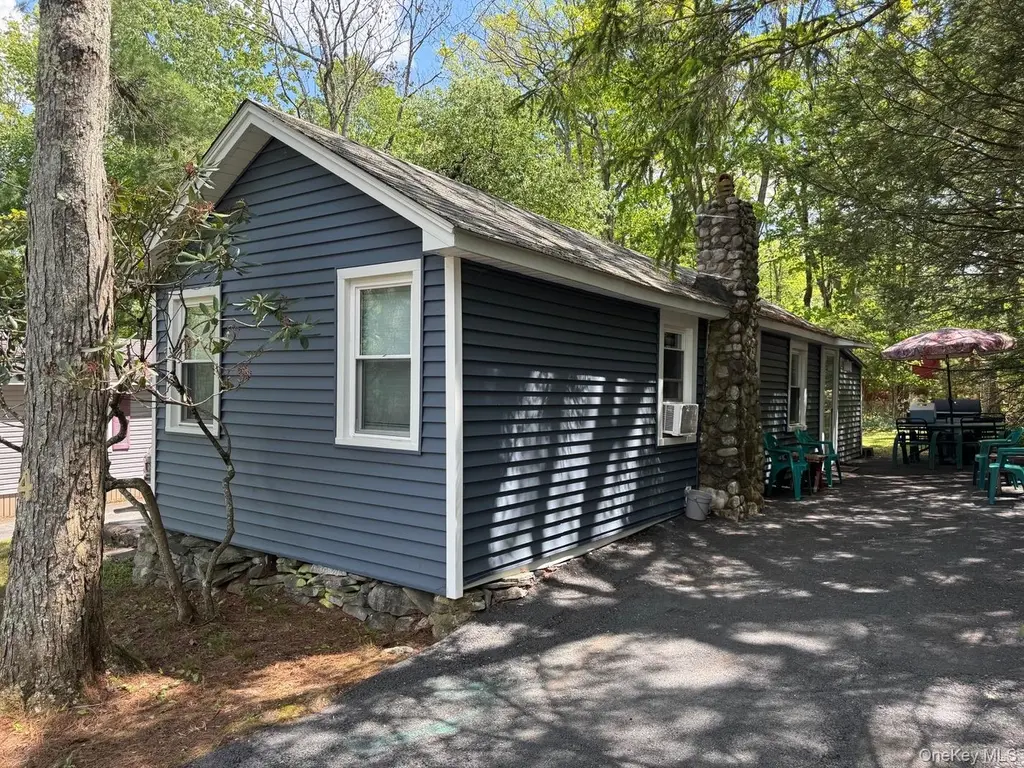
4 Spruce St E · Wurtsboro Hills, NY
Flood risk 1/10 · Minimal
- FEMA flood zone
- X (unshaded)
- Chance of flooding over 30 yrs
- 0.0%
- Est. flood insurance / yr
- $507 – $1,088
Fire risk 5/10 · Moderate
- Est. fire insurance / yr
- $691 – $1,283
Heat risk 2/10 · Minimal
- Hot days now (above 97°F)
- 7 days/yr
- Hot days in 30 yrs
- 15 days/yr
Wind risk 3/10 · Minor
- Chance of severe wind over 30 yrs
- 7.0%
Air-quality risk 2/10 · Minimal
- Unhealthy air days now
- 1 days/yr
- Unhealthy air days in 30 yrs
- 1 days/yr
Risk factors via First Street. Map © Google.
Why this score? — see what drove the B+ grade
The composite is a weighted blend of 9 inputs, each scored 0–100. Each bar is that input's sub-score; the figure is the points it added to the 100-point composite (weight × sub-score).
- Cash flow +30.0/30.0
- 1% rule +10.0/10.0
- DSCR +10.0/10.0
- Appreciation +10.0/10.0
- ARV discount +7.5/15.0
- Rent growth +2.5/5.0
- Schools +2.5/10.0
- Livability +2.5/5.0
- Condition / age +2.5/5.0
$94,900
🖨 Deal sheet 📄 Offer letter ✓ Due diligence
Listing remarks
Cute as a button and affordably priced is this well maintained 3 season bungalow owned by the same owner for 30 years. Why Air BNB when you can own? The best part of the neighborhood is the Community Pool in walking distance from the house and made available to only members for a low annual fee without you having to maintain like a backyard pool. House is on a nice corner lot first house on a dead end road with only one neighbor. Enjoy your morning coffee on the nice stone patio. Just a few miles to the village of Wurtsboro which offers plenty of amenities such as shops and eateries including Canal Towne Emporium, Pasta D'Oro and the Crystal shop.
Key facts
- Walking distance
- Dead end road
- Corner lot
Tags
Property features AI
Finance
- HOA & community: Community amenities include clubhouse and pool; Association fees billed annually
Exterior
- Parking: Driveway
- Utilities: Electricity connected (Orange & Rockland); Cesspool sewer
- Home design: Single family residence; One story; Actual property condition
- Construction: Frame construction
- Exterior features: Back yard; Level lot; Community pool
Interior
- Kitchen: Oven; Refrigerator
- Bedrooms: Total rooms: 5 (includes bedrooms and living spaces)
- Bathrooms: One full bathroom
- Heating & cooling: No heating specified; No cooling specified
- Interior features: First-floor bedroom; Cathedral ceilings; Eat-in kitchen; Open floorplan; Original details
Neighborhood map
What this means for you Summary
Snapshot
- This is a 2-bed/1.0-bath single-family listed at $95k.
Deal economics
- At list price, monthly cash flow is $646 ($8k/yr) — positive.
- The deal already cash-flows at list — no discount required.
- Meets the 1% rule at list price ($2k rent vs $95k).
- Recommended offer: $93k (1.5% below list) — sets the bar for market timing.
- Cap rate 14.5% vs local median 4.1% in Wurtsboro Hills — top-decile yield for the area; either an underpriced asset or a hidden risk that comps aren't pricing in. Stress-test before assuming the spread holds.
Location & tenants
- Location reads: area grade B — affects rentability + tenant quality, not the cash-flow math above.
- Monticello Central School District (town): math 29% / reading 30% proficiency, ranked #577 of 590 in NY (top 98%) — low school quality limits family demand, transient renter base, plan for 1-2y turnover.
- Zoned schools: Emma C Chase School (math 32% / reading 47%, grade F, #1,444 of 2,108 statewide, top 71%, 228 students, 57% FRL); Robert J Kaiser Middle School (math 7% / reading 35%, grade F, #661 of 729 statewide, top 91%, 595 students, 66% FRL); Monticello High School (math 82% / reading 34%, grade C, #879 of 1,100 statewide, top 80%, 844 students, 63% FRL).
- Market conditions: 109 active listings in the ZIP; 1 comparable units currently listed for rent nearby; 739 units permitted in Sullivan County in 2024 (5 in 5+ unit buildings).
Forward outlook
- In year one you build about $10k of equity ($656 loan paydown + $9k appreciation (10.0% local appreciation)).
- Sullivan County population projected at -24% by 2050 — secular population decline; favor cash flow + early exit over multi-decade hold.
- At projected returns (10.0% appreciation + 3.0% rent growth), your $27k cash investment doubles in ~2 years — after that, you're playing with house money.
- By year 4, paydown + projected appreciation supports a ~$36k cash-out refi (75% LTV) — recoverable capital for the next deal without selling this one.
Negotiation context
- It's been on market 29 days — a 2% lower offer ($93k) is reasonable based on typical stale-listing flexibility.
- Current owner paid $19k; list at $95k implies a 399% gain — meaningful room to come down on a strong offer.
Risks & watch-outs
- Watch-outs: built in 1920 — expect roof / HVAC / electrical / plumbing capex.
- Climate carrying-cost: moderate wildfire risk — expect insurance premiums to compound above CPI over the hold.
Questions for the listing agent
- Built in 1920 — when were the roof, HVAC, electrical panel, plumbing, and water heater last replaced?
- Is there a deadline driving the sale (1031 exchange, divorce, estate, relocation)? That informs how much negotiation room exists.
- What's the average days-on-market for RENTAL listings here right now (not sales)? A rising rental-DOM trend means longer vacancies and softer asking-rent achievability than the comps imply.
- What's the recent tenant-quality profile in this submarket — average credit score on applications, eviction rate, late-payment / NSF rate, and stable-employment percentage? A property-management company in the area should have these aggregated.
- How much new for-sale + rental construction is in the pipeline within 1–3 miles? Heavy new supply typically softens prices + rents 12–24 months out; constrained supply supports both.
Investment metrics
- 1% rule
- 1.74% ✓
- Cap rate
- 14.46%
- Cash-on-cash
- 29.17%
- DSCR
- 2.30
- GRM
- 4.8
CMA / ARV
No comps found within radius.
Projected returns pro-forma
10.0% appreciation · 3.0% rent growth · sell at horizon
- IRR
- 46.4%
- Equity multiple
- 4.49×
- Total profit
- $92,854
- Equity at exit
- $85,493
- IRR
- 40.3%
- Equity multiple
- 10.07×
- Total profit
- $241,136
- Equity at exit
- $184,370
Cash invested: $26,572 (down + closing). Projections, not guarantees.
Landlord ↔ Tenant lean methodology
- Overall (STATE)
- 15 Strongly Tenant-Friendly
- State New York
- 15 Strongly Tenant-Friendly · D+10
- County
- — inherits STATE
- City
- — inherits STATE
ZIP-level market 12790
- Home prices YoY
- 26.8%
- Active inventory
- 109
- Price-to-rent
- 4.8×
Monthly cashflow live
- Estimated rent
- $1,650 medium interval (Pro) →
- Mortgage (P&I)
- −$498
- Tax from tax record
- −$120 /mo · $1,444/yr
- Insurance
- −$40
- HOA
- −$0
- Vacancy / Maint / Mgmt
- −$346
- Net cashflow
- $646
Break-even live
Sensitivity live
| Price | -10% $700 | -5% $673 | +0% $646 | +5% $619 | +10% $592 |
|---|---|---|---|---|---|
| Rent | -10% $516 | -5% $581 | +0% $646 | +5% $711 | +10% $776 |
| Rate | -1.0pp $694 | -0.5pp $670 | base $646 | +0.5pp $621 | +1.0pp $596 |
UW: 25.0% down · 7.5% · 30yr · 1.5% tax · 5.0% vac · 8.0% maint · 8.0% mgmt
Financing live
Cash to close
- Down payment
- $23,725
- Closing costs
- $2,847
- Reserves months
- —
- Total cash needed
- —
Loan-product check · same deal, 3 products live
Conventional
25% down · 7.5% · 30yr
- Down + closing
- —
- Monthly P&I
- —
- Monthly cashflow
- —
- DSCR
- —
- Eligible?
- —
Personal DTI + credit; lowest rate.
DSCR
20% down · 8.5% · 30yr
- Down + closing
- —
- Monthly P&I
- —
- Monthly cashflow
- —
- DSCR
- —
- Eligible?
- —
No personal income docs; deal must DSCR.
Hard money
10% down · 12.0% · 12mo
- Down + closing
- —
- Monthly P&I
- —
- Monthly cashflow
- —
- DSCR
- —
- Eligible?
- —
Short-term bridge; refi at stabilization.
Rent comps 1 comps
| Address | Beds | Baths | Sqft | Rent | $/sqft | DOM | Units | Dist |
|---|---|---|---|---|---|---|---|---|
| 64 Yankee Lake Rd Wurtsboro, NY | 1.0 | 1.0 | 700 | $1,650 | $2.36 | 14d | 1 | 1.22mi |
Listing history 17 events
-
2026-06-18days on market $94,900 Active 29 DOM
-
2026-06-17days on market $94,900 Active 28 DOM
-
2026-06-16days on market $94,900 Active 27 DOM
-
2026-06-15days on market $94,900 Active 26 DOM
-
2026-06-14days on market $94,900 Active 24 DOM
-
2026-06-10days on market $94,900 Active 21 DOM
-
2026-06-09days on market $94,900 Active 20 DOM
-
2026-06-08days on market $94,900 Active 19 DOM
-
2026-06-07pricedays on market $94,900 Active 18 DOM
-
2026-06-03days on market $99,900 Active 14 DOM
-
2026-06-02days on market $99,900 Active 13 DOM
-
2026-06-01days on market $99,900 Active 12 DOM
-
2026-05-31days on market $99,900 Active 11 DOM
-
2026-05-31days on market $99,900 Active 10 DOM
-
2026-05-19$99,900 Active
-
1996-08-22soldstatus $19,000
-
1982-11-23soldstatus $10,000
ⓘ Source: listings_history table (triggers on properties + properties_extension) + one-shot
backfill from property_details.listing_events for pre-trigger history.
Tax reassessment forecast NY · Partial reset (capped growth)
- Current annual tax
- $1,444 · $120/mo
- Projected year-2 tax
- $1,524 · $127/mo
- Expected delta
- +$80/yr (+$7/mo · 5.5%)
ⓘ Screening estimate from a state-policy table — verify with the county assessor before closing.
Climate risk First Street
- Flood 1/10 Low FEMA zone X (unshaded) · 0% chance over 30 yrs
- Wildfire 5/10 Major
- Heat 2/10 Low 7 d/yr ≥97°F today · 15 d/yr by 30 yrs out
- Wind 3/10 Moderate 7% chance of damaging wind over 30 yrs
- Air quality 2/10 Low 1 unhealthy d/yr today · 1 by 30 yrs out
Nearby sold comps map
Loading sold comps map…
Walkable amenities ~0.75 mi
Loading nearby amenities…
Taxation est. · year 1
- Rental income
- $19,800
- − Mortgage interest
- −$5,316
- − Property taxes
- −$1,444
- − Insurance
- −$474
- − Repairs & maintenance
- −$1,584
- − Management
- −$1,584
- − Depreciation
- −$2,761
- Taxable income
- $6,637
- Est. tax owed @ 24.0%
- −$1,593
- After-tax cash flow
- $6,159/yr
For passive investors: Depreciation is non-cash, so a rental often shows a tax loss while cash-flowing — sheltering income. Rental losses are passive: they offset passive income freely, and up to $25,000/yr can offset ordinary (W-2) income if you actively participate and your MAGI is under $100k (phasing out to $0 by $150k); unused losses carry forward. On sale, claimed depreciation is recaptured at up to 25%, and gains may owe capital-gains tax (a 1031 exchange can defer both). Figures are a year-1 estimate at your 24.0% rate — not tax advice; consult a CPA.
Schools (NCES district)
- District
- Monticello Central School District
- NCES district ID
- 3619740
- Math proficiency
- 29% ▼ -4.00%
- Reading proficiency
- 30% ▼ -2.00%
- Median HH income
- $44,696
- Composite
- 25.28/100
- National rank
- #7491
- State rank
- #577 of 590 in NY
Livability — Wurtsboro Hills
No livability data for this city. (Only ~50 U.S. cities are tracked.)
Census & demographics
- Census place
- Wurtsboro Hills, NY
- Population (ZIP)
- 4,341
Population outlook (Sullivan County) Hauer SSP2
- Today (2025)
- 68,974 people
- By 2030
- 65,609 · -4.9%
- By 2040
- 58,878 · -14.6%
- By 2050
- 52,500 · -23.9%
- By 2075
- 39,941 · -42.1%
- By 2100
- 28,880 · -58.1%
Race, ethnicity, and origin ACS 2023
- Neighborhood character
- Predominantly White (79%)
- Race & ethnicity
- White 79% Two or more races 9% Black 6% Hispanic / Latino 6% Asian 4%
- Hispanic origin (detail)
- Puerto Rican 3%
- Common ancestry
- Russian 7% Slovak 5% Scotch-Irish 4%
- Foreign-born
- 8% · Canada
- Languages at home
- 87% English-only · Spanish 3% Chinese 3% Russian/Polish/Slavic 3%
Political lean MEDSL · Sullivan
- 2024 margin
- R (+16.7) · D 41.6% · R 58.4%
- 2008→2024 swing
- -26.2pp toward R · 2008: 9.5pp · 2024: -16.7pp
- All cycles
- 2024: R+16.7 2020: R+9.2 2016: R+13.7 2012: D+10.4 2008: D+9.5
Not yet ingested
- Civics
- —
Market trends
- HPI YoY
- ▲ 95.79%
- Current HPI
- 452.7233
- Rent YoY
- —
- Metro
- —
- State GDP YoY
- ▲ 2.60%
- F500 in state
- 92
Industry mix (Fortune 500 HQ in NY)
| Industry | F500 HQs | Revenue |
|---|---|---|
| Financial Services | 10 | $950B |
|
||
| Consumer Goods | 9 | $162B |
|
||
| Insurance | 4 | $225B |
|
||
| Telecommunications | 2 | $144B |
|
||
| Pharmaceuticals | 2 | $112B |
|
||
| Media / Entertainment | 2 | $69B |
|
||
Price history
+899.0% since first listed3 events — show timeline
- 2026-05-19 Listed $99,900 OneKey® MLS as Distributed by MLS Grid
- 1996-08-22 Sold (Public Records) $19,000 Public Records
- 1982-11-23 Sold (Public Records) $10,000 Public Records
Property tax history
-0.4%/yrLatest (2025): $1,444 · -0.6% YoY. Source: county tax records.
Cash-flow waterfall
monthlySold comps — $/sqft
last 12 mo · ≤1 miLoading sold comps…