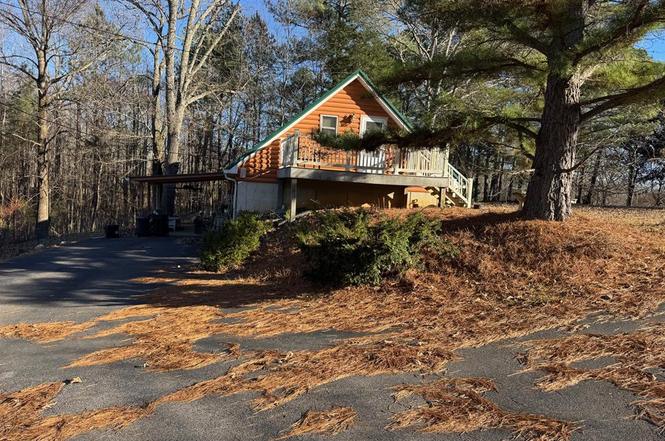
164 Smith Ln · Camden, TN
Flood risk 1/10 · Minimal
- FEMA flood zone
- X (unshaded)
- Chance of flooding over 30 yrs
- 0.0%
- Est. flood insurance / yr
- $507 – $1,088
Fire risk 6/10 · Moderate
- Est. fire insurance / yr
- $949 – $1,763
Heat risk 5/10 · Moderate
- Hot days now (above 108°F)
- 7 days/yr
- Hot days in 30 yrs
- 20 days/yr
Wind risk 4/10 · Minor
- Chance of severe wind over 30 yrs
- 10.0%
Air-quality risk 2/10 · Minimal
- Unhealthy air days now
- 0 days/yr
- Unhealthy air days in 30 yrs
- 1 days/yr
Risk factors via First Street. Map © Google.
Why this score? — see what drove the C- grade
The composite is a weighted blend of 9 inputs, each scored 0–100. Each bar is that input's sub-score; the figure is the points it added to the 100-point composite (weight × sub-score).
- Cash flow +24.0/30.0
- DSCR +7.7/10.0
- ARV discount +7.5/15.0
- 1% rule +5.1/10.0
- Livability +3.3/5.0
- Rent growth +2.5/5.0
- Condition / age +2.5/5.0
- Schools +2.4/10.0
- Appreciation +0.0/10.0
$170,000
🖨 Deal sheet 📄 Offer letter ✓ Due diligence
Listing remarks
This is a three bedroom three bath basement house. two bedrooms and two baths on main level. up stairs has a bedroom bath and large area that could be used as recreation room. Upstirs has outside entrance. with aa porch. Two outbuildings. covered porch on main level.
Key facts
- Covered porch
- Recreation room
- Outbuildings
Tags
Property features AI
Exterior
- Parking: Open parking; No garage; Asphalt parking surface
- Utilities: Public water; Septic tank; Cable available
- Home design: Residential single-family home; Paved road access; Approximately 1.22 acres lot
- Construction: Wood siding; Slab foundation
- Exterior features: Front porch; Side porch; Metal roof; No fencing
Interior
- Kitchen: Electric oven; Electric range; Refrigerator
- Bedrooms: 2 bedrooms on the main level
- Flooring: Laminate flooring
- Bathrooms: 3 full bathrooms total; 2 full bathrooms on the main level
- Heating & cooling: Central air (cooling); Has heating
- Interior features: Insulated windows; Garden area; Storage space
- Laundry & utility: Laundry on the main level
Neighborhood map
What this means for you Summary
Snapshot
- This is a 3-bed/2.0-bath single-family listed at $170k.
Deal economics
- At list price, monthly cash flow is $332 ($4k/yr) — positive.
- The deal already cash-flows at list — no discount required.
- Meets the 1% rule at list price ($2k rent vs $170k).
- Recommended offer: $150k (12.0% below list) — sets the bar for market timing.
Location & tenants
- Location reads 66/100 on livability (#133 in TN) — a middle-class / working-renter tenant base. Strengths: crime A+, cost of living A+, housing A+; Watch: health & safety C-, employment D, amenities F.
- Benton County (town): math 31% / reading 28% proficiency, ranked #66 of 139 in TN (top 48%) — low school quality limits family demand, transient renter base, plan for 1-2y turnover.
- Zoned schools: Camden Elementary (473 students, 0% FRL); Camden Jr High School (math 37% / reading 23%, grade F, #98 of 333 statewide, top 32%, 371 students, 0% FRL); Camden Central High School (math 8% / reading 37%, grade F, #156 of 332 statewide, top 49%, 521 students, 0% FRL) — zoned schools average 0% FRL vs 54% district-wide (54 pts lower); this property's tenant base skews higher-income than the district average.
- Market conditions: 110 active listings in the ZIP; 6 units permitted in Benton County in 2024 (0 in 5+ unit buildings).
Forward outlook
- Local home prices are declining (-3.0%/yr); year-one equity from $1k of loan paydown is wiped out by about $5k of value loss. Plan a longer hold.
- Benton County population projected at -18% by 2050 — secular population decline; favor cash flow + early exit over multi-decade hold.
Negotiation context
- It's been on market 170 days — a 12% lower offer ($150k) is reasonable based on typical stale-listing flexibility.
- 2 sale attempts with the ask held roughly flat each time — persistent listings suggest the price (not the market) is what's stuck; bring a comps-based counter.
- Current owner paid $78k; list at $170k implies a 118% gain — meaningful room to come down on a strong offer.
Risks & watch-outs
- Climate carrying-cost: major wildfire risk; extreme-heat days projected 7→20/yr by 2055 (HVAC capex compounding) — expect insurance premiums to compound above CPI over the hold.
Questions for the listing agent
- It's been on market 170 days. Have you received any prior offers? Is the seller open to a 12% concession, seller financing, or rate buy-down credit?
- Why hasn't it sold? Are there any deal-killer items the seller is aware of (foundation, flood, title, zoning, code violations)?
- Is there a deadline driving the sale (1031 exchange, divorce, estate, relocation)? That informs how much negotiation room exists.
- Schools are D-rated, which usually means shorter tenancies and higher turnover. Who's the typical renter profile here, and what's been the actual vacancy rate?
- What's the average days-on-market for RENTAL listings here right now (not sales)? A rising rental-DOM trend means longer vacancies and softer asking-rent achievability than the comps imply.
- What's the recent tenant-quality profile in this submarket — average credit score on applications, eviction rate, late-payment / NSF rate, and stable-employment percentage? A property-management company in the area should have these aggregated.
- How much new for-sale + rental construction is in the pipeline within 1–3 miles? Heavy new supply typically softens prices + rents 12–24 months out; constrained supply supports both.
Investment metrics
- 1% rule
- 1.01% ✓
- Cap rate
- 8.64%
- Cash-on-cash
- 8.38%
- DSCR
- 1.37
- GRM
- 8.3
CMA / ARV
No comps found within radius.
Projected returns pro-forma
-3.0% appreciation · 3.0% rent growth · sell at horizon
- IRR
- -3.6%
- Equity multiple
- 0.86×
- Total profit
- $-6,443
- Equity at exit
- $25,348
- IRR
- 6.0%
- Equity multiple
- 1.45×
- Total profit
- $21,368
- Equity at exit
- $14,698
Cash invested: $47,600 (down + closing). Projections, not guarantees.
Landlord ↔ Tenant lean methodology
- Overall (STATE)
- 87 Strongly Landlord-Friendly
- State Tennessee
- 87 Strongly Landlord-Friendly · R+13
- County
- — inherits STATE
- City
- — inherits STATE
ZIP-level market 38320
- Home prices YoY
- -6.5%
- Active inventory
- 110
- Price-to-rent
- 8.3×
Monthly cashflow live
- Estimated rent
- $1,709 medium interval (Pro) →
- Mortgage (P&I)
- −$891
- Tax from tax record
- −$55 /mo · $659/yr
- Insurance
- −$71
- HOA
- −$0
- Vacancy / Maint / Mgmt
- −$359
- Net cashflow
- $332
Break-even live
UW: 25.0% down · 7.5% · 30yr · 1.5% tax · 5.0% vac · 8.0% maint · 8.0% mgmt
Financing live
Cash to close
- Down payment
- $42,500
- Closing costs
- $5,100
- Reserves months
- —
- Total cash needed
- —
Loan-product check · same deal, 3 products live
Conventional
25% down · 7.5% · 30yr
- Down + closing
- —
- Monthly P&I
- —
- Monthly cashflow
- —
- DSCR
- —
- Eligible?
- —
Personal DTI + credit; lowest rate.
DSCR
20% down · 8.5% · 30yr
- Down + closing
- —
- Monthly P&I
- —
- Monthly cashflow
- —
- DSCR
- —
- Eligible?
- —
No personal income docs; deal must DSCR.
Hard money
10% down · 12.0% · 12mo
- Down + closing
- —
- Monthly P&I
- —
- Monthly cashflow
- —
- DSCR
- —
- Eligible?
- —
Short-term bridge; refi at stabilization.
Listing history 13 events
-
2026-06-18days on market $170,000 Active 170 DOM
-
2026-06-17days on market $170,000 Active 169 DOM
-
2026-06-16days on market $170,000 Active 168 DOM
-
2026-06-15days on market $170,000 Active 167 DOM
-
2026-06-13statusdays on market $170,000 Active 165 DOM
-
2026-06-01status $170,000 Pending 164 DOM
-
2026-06-01days on market $170,000 Active 164 DOM
-
2026-05-31days on market $170,000 Active 163 DOM
-
2026-01-13status Active
-
2026-01-08historical Active Under Contract
-
2025-12-19$170,000 Active
-
2007-05-18soldstatus $78,000
-
2003-08-29soldstatus $75,000
ⓘ Source: listings_history table (triggers on properties + properties_extension) + one-shot
backfill from property_details.listing_events for pre-trigger history.
Tax reassessment forecast TN · Resets to sale price
- Current annual tax
- $659 · $55/mo
- Projected year-2 tax
- $1,207 · $101/mo
- Expected delta
- +$548/yr (+$46/mo · 83.2%)
ⓘ Screening estimate from a state-policy table — verify with the county assessor before closing.
Climate risk First Street
- Flood 1/10 Low FEMA zone X (unshaded) · 0% chance over 30 yrs
- Wildfire 6/10 Major
- Heat 5/10 Major 7 d/yr ≥108°F today · 20 d/yr by 30 yrs out
- Wind 4/10 Moderate 10% chance of damaging wind over 30 yrs
- Air quality 2/10 Low 0 unhealthy d/yr today · 1 by 30 yrs out
Nearby sold comps map
Loading sold comps map…
Walkable amenities ~0.75 mi
Loading nearby amenities…
Taxation est. · year 1
- Rental income
- $20,502
- − Mortgage interest
- −$9,523
- − Property taxes
- −$659
- − Insurance
- −$850
- − Repairs & maintenance
- −$1,640
- − Management
- −$1,640
- − Depreciation
- −$4,945
- Taxable income
- $1,245
- Est. tax owed @ 24.0%
- −$299
- After-tax cash flow
- $3,691/yr
For passive investors: Depreciation is non-cash, so a rental often shows a tax loss while cash-flowing — sheltering income. Rental losses are passive: they offset passive income freely, and up to $25,000/yr can offset ordinary (W-2) income if you actively participate and your MAGI is under $100k (phasing out to $0 by $150k); unused losses carry forward. On sale, claimed depreciation is recaptured at up to 25%, and gains may owe capital-gains tax (a 1031 exchange can defer both). Figures are a year-1 estimate at your 24.0% rate — not tax advice; consult a CPA.
Schools (NCES district)
- District
- Benton County
- NCES district ID
- 4700240
- Math proficiency
- 31% ▼ -8.00%
- Reading proficiency
- 28% ▼ -7.00%
- Median HH income
- $33,587
- Composite
- 24.24/100
- National rank
- #7722
- State rank
- #66 of 139 in TN
Livability — Camden
- Score
- 66/100
- State rank
- #133
- US rank
- #12196
Category grades
Schools grade is shown separately in the Schools card above.
Census & demographics
- Population (ZIP)
- 10,470
Population outlook (Benton County) Hauer SSP2
- Today (2025)
- 15,046 people
- By 2030
- 14,425 · -4.1%
- By 2040
- 13,296 · -11.6%
- By 2050
- 12,298 · -18.3%
- By 2075
- 10,347 · -31.2%
- By 2100
- 8,594 · -42.9%
Race, ethnicity, and origin ACS 2023
- Neighborhood character
- Predominantly White (91%)
- Race & ethnicity
- White 91% Two or more races 3% Hispanic / Latino 2% Black 2% Asian 1%
- Common ancestry
- Lithuanian 3% Italian 3% Slovak 2%
- Foreign-born
- 2% · China
- Languages at home
- 99% English-only · Spanish 1%
Political lean MEDSL · Benton
- 2024 margin
- Solid R (+62.9) · D 18.1% · R 81.1%
- 2008→2024 swing
- -46.7pp toward R · 2008: -16.2pp · 2024: -62.9pp
- All cycles
- 2024: R+62.9 2020: R+57.0 2016: R+51.3 2012: R+25.6 2008: R+16.2
Not yet ingested
- Civics
- —
Market trends
- HPI YoY
- ▼ -16.25%
- Current HPI
- 233.3477
- Rent YoY
- —
- Metro
- —
- State GDP YoY
- ▲ 2.78%
- F500 in state
- 22
Industry mix (Fortune 500 HQ in TN)
| Industry | F500 HQs | Revenue |
|---|---|---|
| Healthcare | 3 | $91B |
|
||
| Retail | 3 | $72B |
|
||
| Transportation / Logistics | 1 | $88B |
|
||
| Paper / Packaging | 1 | $19B |
|
||
| Insurance | 1 | $13B |
|
||
| Energy | 1 | $12B |
|
||
Price history
+126.7% since first listed5 events — show timeline
- 2026-01-13 Relisted — TVAR
- 2026-01-08 Contingent — TVAR
- 2025-12-19 Listed $170,000 TVAR
- 2007-05-18 Sold (Public Records) $78,000 Public Records
- 2003-08-29 Sold (Public Records) $75,000 Public Records
Property tax history
+0.7%/yrLatest (2025): $659 · +0.0% YoY. Source: county tax records.
Cash-flow waterfall
monthlySold comps — $/sqft
last 12 mo · ≤1 miLoading sold comps…