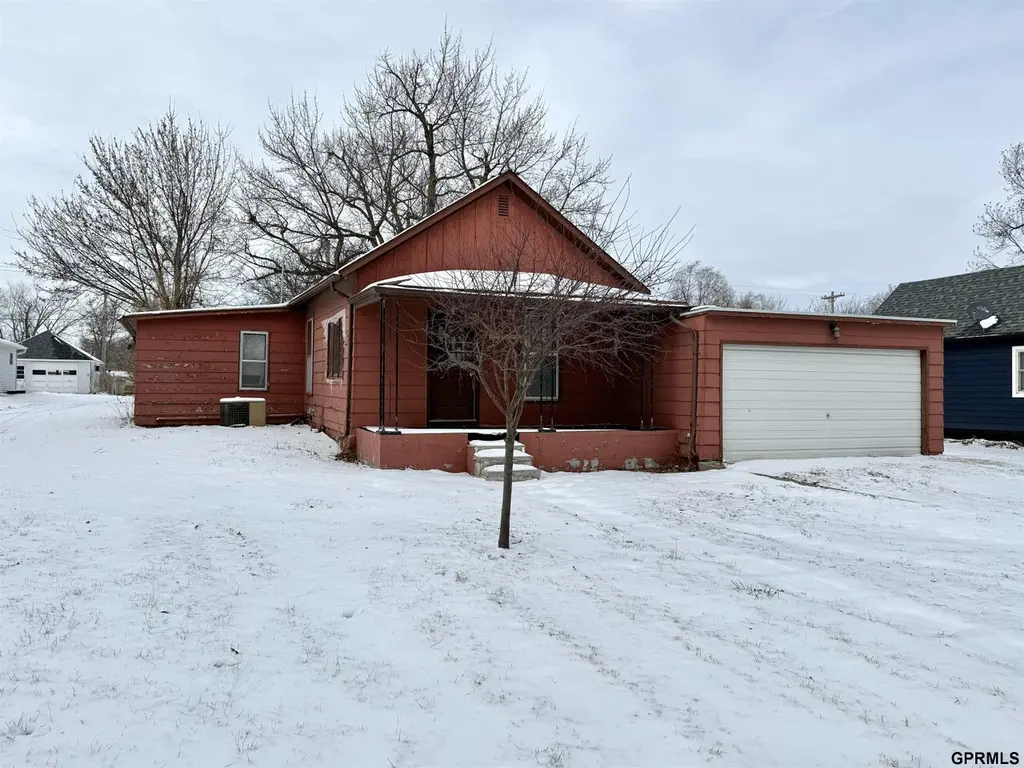
829 7th Ave · Fairmont, NE
Flood risk 1/10 · Minimal
- FEMA flood zone
- X (unshaded)
- Chance of flooding over 30 yrs
- 0.0%
- Est. flood insurance / yr
- $507 – $1,088
Fire risk 1/10 · Minimal
- Est. fire insurance / yr
- $1,161 – $2,155
Heat risk 3/10 · Minor
- Hot days now (above 103°F)
- 7 days/yr
- Hot days in 30 yrs
- 16 days/yr
Wind risk 2/10 · Minimal
- Chance of severe wind over 30 yrs
- —
Air-quality risk 2/10 · Minimal
- Unhealthy air days now
- 1 days/yr
- Unhealthy air days in 30 yrs
- 1 days/yr
Risk factors via First Street. Map © Google.
Why this score? — see what drove the A grade
The composite is a weighted blend of 9 inputs, each scored 0–100. Each bar is that input's sub-score; the figure is the points it added to the 100-point composite (weight × sub-score).
- Cash flow +30.0/30.0
- ARV discount +15.0/15.0
- DSCR +10.0/10.0
- 1% rule +9.3/10.0
- Appreciation +9.2/10.0
- Schools +4.7/10.0
- Livability +3.3/5.0
- Rent growth +2.5/5.0
- Condition / age +2.5/5.0
$60,000
🖨 Deal sheet 📄 Offer letter ✓ Due diligence
Listing remarks MLS
This 2 bedroom, one bath home has a great yard and big garage and is very affordable. Front room for living leads to dining area and kitchen. First bedroom is just off dining room and second bedroom is besides the full bath. Behind the kitchen is a HUGE mudroom / laundry area with a sink. This mudroom leads to the fenced-in back yard that double connects to the alleys. The two-stall garage connects to the house. Modern electrical panel and small basement for mechanicals and storage. Call you Realtor to view this affordable house.
Key facts
- Huge mudroom
- Fenced-in back yard
- 7,405 sq ft lot
Tags
Neighborhood map
What this means for you Summary
Snapshot
- This is a 2-bed/1.0-bath single-family listed at $60k.
Deal economics
- At list price, monthly cash flow is $306 ($4k/yr) — positive.
- The deal already cash-flows at list — no discount required.
- Meets the 1% rule at list price ($860 rent vs $60k).
- Recommended offer: $53k (12.0% below list) — sets the bar for market timing.
Location & tenants
- Location reads 66/100 on livability (#313 in NE) — a middle-class / working-renter tenant base. Strengths: cost of living A+, housing A+; Watch: health & safety C-, schools D+, amenities F.
- Fillmore Central Public Schools (rural): math 56% / reading 54% proficiency, ranked #41 of 111 in NE (top 37%) — acceptable for families but not a draw, mixed tenant base, ~2y average lease.
- Market conditions: 5 active listings in the ZIP; 10 units permitted in Fillmore County in 2024 (0 in 5+ unit buildings).
Forward outlook
- In year one you build about $5k of equity ($415 loan paydown + $5k appreciation (8.4% local appreciation)).
- Fillmore County population projected to shrink 6% by 2050 — rents likely to lag national; underwrite the cash flow, not the appreciation.
- At projected returns (8.4% appreciation + 3.0% rent growth), your $17k cash investment doubles in ~2 years — after that, you're playing with house money.
- By year 6, paydown + projected appreciation supports a ~$31k cash-out refi (75% LTV) — recoverable capital for the next deal without selling this one.
Negotiation context
- It's been on market 180 days — a 12% lower offer ($53k) is reasonable based on typical stale-listing flexibility.
- 2 sale attempts since 6y ago with the ask held roughly flat each time — persistent listings suggest the price (not the market) is what's stuck; bring a comps-based counter.
- Current owner paid $26k; list at $60k implies a 135% gain — meaningful room to come down on a strong offer.
Risks & watch-outs
- Watch-outs: built in 1921 — expect roof / HVAC / electrical / plumbing capex.
Questions for the listing agent
- It's been on market 180 days. Have you received any prior offers? Is the seller open to a 12% concession, seller financing, or rate buy-down credit?
- Built in 1921 — when were the roof, HVAC, electrical panel, plumbing, and water heater last replaced?
- Why hasn't it sold? Are there any deal-killer items the seller is aware of (foundation, flood, title, zoning, code violations)?
- Is there a deadline driving the sale (1031 exchange, divorce, estate, relocation)? That informs how much negotiation room exists.
- Schools are D-rated, which usually means shorter tenancies and higher turnover. Who's the typical renter profile here, and what's been the actual vacancy rate?
- What's the average days-on-market for RENTAL listings here right now (not sales)? A rising rental-DOM trend means longer vacancies and softer asking-rent achievability than the comps imply.
- What's the recent tenant-quality profile in this submarket — average credit score on applications, eviction rate, late-payment / NSF rate, and stable-employment percentage? A property-management company in the area should have these aggregated.
- How much new for-sale + rental construction is in the pipeline within 1–3 miles? Heavy new supply typically softens prices + rents 12–24 months out; constrained supply supports both.
Investment metrics
- 1% rule
- 1.43% ✓
- Cap rate
- 12.40%
- Cash-on-cash
- 21.82%
- DSCR
- 1.97
- GRM
- 5.8
CMA / ARV
- ARV (median comp)
- $81,130
- List price
- $60,000
- Delta
- -26.04%
- Verdict
- UNDERPRICED
- Comps
- 5 within 1.0 mi
Show comp detail 1 sale within ~0.75 mi
| Address | Dist | Beds/Ba | Sqft | Sold | Price | $/sf | Match |
|---|---|---|---|---|---|---|---|
| 506 8th Ave | 0.30mi | 2/1.0 | 944 (+10%) | 6mo | $152,000 | $161 | 65 |
Match score weights: distance 35% · size 25% · config 20% · recency 20%. Top-matched comps best support the ARV.
Projected returns pro-forma
8.41% appreciation · 3.0% rent growth · sell at horizon
- IRR
- 37.9%
- Equity multiple
- 3.72×
- Total profit
- $45,735
- Equity at exit
- $47,257
- IRR
- 33.5%
- Equity multiple
- 8.04×
- Total profit
- $118,317
- Equity at exit
- $95,447
Cash invested: $16,800 (down + closing). Projections, not guarantees.
Landlord ↔ Tenant lean methodology
- Overall (STATE)
- 83 Strongly Landlord-Friendly
- State Nebraska
- 83 Strongly Landlord-Friendly · R+13
- County
- — inherits STATE
- City
- — inherits STATE
ZIP-level market 68354
- Home prices YoY
- 4.3%
- Active inventory
- 5
- Price-to-rent
- 5.8×
Monthly cashflow live
- Estimated rent
- $860 medium interval (Pro) →
- Mortgage (P&I)
- −$315
- Tax from tax record
- −$34 /mo · $410/yr
- Insurance
- −$25
- HOA
- −$0
- Vacancy / Maint / Mgmt
- −$181
- Net cashflow
- $306
Break-even live
UW: 25.0% down · 7.5% · 30yr · 1.5% tax · 5.0% vac · 8.0% maint · 8.0% mgmt
Financing live
Cash to close
- Down payment
- $15,000
- Closing costs
- $1,800
- Reserves months
- —
- Total cash needed
- —
Loan-product check · same deal, 3 products live
Conventional
25% down · 7.5% · 30yr
- Down + closing
- —
- Monthly P&I
- —
- Monthly cashflow
- —
- DSCR
- —
- Eligible?
- —
Personal DTI + credit; lowest rate.
DSCR
20% down · 8.5% · 30yr
- Down + closing
- —
- Monthly P&I
- —
- Monthly cashflow
- —
- DSCR
- —
- Eligible?
- —
No personal income docs; deal must DSCR.
Hard money
10% down · 12.0% · 12mo
- Down + closing
- —
- Monthly P&I
- —
- Monthly cashflow
- —
- DSCR
- —
- Eligible?
- —
Short-term bridge; refi at stabilization.
Listing history 15 events
-
2026-06-09days on market $60,000 Active 180 DOM
-
2026-06-08days on market $60,000 Active 179 DOM
-
2026-06-07days on market $60,000 Active 178 DOM
-
2026-06-05days on market $60,000 Active 176 DOM
-
2026-06-04days on market $60,000 Active 174 DOM
-
2026-06-02days on market $60,000 Active 173 DOM
-
2026-06-01days on market $60,000 Active 172 DOM
-
2026-05-31days on market $60,000 Active 171 DOM
-
2025-12-05$60,000 New 541-char remark
Show marketing remark (541 chars)
This 2 bedroom, one bath home has a great yard and big garage and is very affordable. Front room for living leads to dining area and kitchen. First bedroom is just off dining room and second bedroom is besides the full bath. Behind the kitchen is a HUGE mudroom / laundry area with a sink. This mudroom leads to the fenced-in back yard that double connects to the alleys. The two-stall garage connects to the house. Modern electrical panel and small basement for mechanicals and storage. Call you Realtor to view this affordable house.
-
2020-05-14soldstatus $25,500 226-char remark
Show marketing remark (226 chars)
Pending - Will show for backup offers! MOTIVATED SELLER! 2 Bedrooms/1 Bath! Spacious closets! Newer flooring! Over-sized garage! Large backyard! Quiet neighborhood! This charming home has a lot to offer and priced to sell!
-
2020-05-14soldstatus $25,500
Show marketing remark (226 chars)
Pending - Will show for backup offers! MOTIVATED SELLER! 2 Bedrooms/1 Bath! Spacious closets! Newer flooring! Over-sized garage! Large backyard! Quiet neighborhood! This charming home has a lot to offer and priced to sell!
-
2020-03-17soldstatus $25,500
-
2020-02-03$28,500 226-char remark
Show marketing remark (226 chars)
Pending - Will show for backup offers! MOTIVATED SELLER! 2 Bedrooms/1 Bath! Spacious closets! Newer flooring! Over-sized garage! Large backyard! Quiet neighborhood! This charming home has a lot to offer and priced to sell!
-
2017-01-13soldstatus $20,000
-
1999-10-27soldstatus $10,000
ⓘ Source: listings_history table (triggers on properties + properties_extension) + one-shot
backfill from property_details.listing_events for pre-trigger history.
Tax reassessment forecast NE · Resets to sale price
- Current annual tax
- $410 · $34/mo
- Projected year-2 tax
- $1,038 · $86/mo
- Expected delta
- +$628/yr (+$52/mo · 153.3%)
ⓘ Screening estimate from a state-policy table — verify with the county assessor before closing.
Climate risk First Street
- Flood 1/10 Low FEMA zone X (unshaded) · 0% chance over 30 yrs
- Wildfire 1/10 Low
- Heat 3/10 Moderate 7 d/yr ≥103°F today · 16 d/yr by 30 yrs out
- Wind 2/10 Low
- Air quality 2/10 Low 1 unhealthy d/yr today · 1 by 30 yrs out
Nearby sold comps map
Loading sold comps map…
Walkable amenities ~0.75 mi
Loading nearby amenities…
Taxation est. · year 1
- Rental income
- $10,319
- − Mortgage interest
- −$3,361
- − Property taxes
- −$410
- − Insurance
- −$300
- − Repairs & maintenance
- −$825
- − Management
- −$825
- − Depreciation
- −$1,745
- Taxable income
- $2,851
- Est. tax owed @ 24.0%
- −$684
- After-tax cash flow
- $2,982/yr
For passive investors: Depreciation is non-cash, so a rental often shows a tax loss while cash-flowing — sheltering income. Rental losses are passive: they offset passive income freely, and up to $25,000/yr can offset ordinary (W-2) income if you actively participate and your MAGI is under $100k (phasing out to $0 by $150k); unused losses carry forward. On sale, claimed depreciation is recaptured at up to 25%, and gains may owe capital-gains tax (a 1031 exchange can defer both). Figures are a year-1 estimate at your 24.0% rate — not tax advice; consult a CPA.
Schools (NCES district)
- District
- Fillmore Central Public Schools
- NCES district ID
- 3100118
- Math proficiency
- 56% ▼ -4.00%
- Reading proficiency
- 54% ▼ -3.00%
- Median HH income
- $47,623
- Composite
- 46.72/100
- National rank
- #2396
- State rank
- #41 of 111 in NE
Livability — Fairmont
- Score
- 66/100
- State rank
- #313
- US rank
- #11759
Category grades
Schools grade is shown separately in the Schools card above.
Census & demographics
- Census place
- Fairmont, NE
- City population
- 803
- Population (ZIP)
- 803
Population outlook (Fillmore County) Hauer SSP2
- Today (2025)
- 5,729 people
- By 2030
- 5,696 · -0.6%
- By 2040
- 5,561 · -2.9%
- By 2050
- 5,412 · -5.5%
- By 2075
- 5,437 · -5.1%
- By 2100
- 5,373 · -6.2%
Race, ethnicity, and origin ACS 2023
- Neighborhood character
- Predominantly White (98%)
- Race & ethnicity
- White 98% Hispanic / Latino 1% Two or more races 1%
- Common ancestry
- Iranian 4% Scotch-Irish 2% Portuguese 1%
- Foreign-born
- 1%
- Languages at home
- 98% English-only · Spanish 1% Other Indo-European 1%
Political lean MEDSL · Fillmore
- 2024 margin
- Solid R (+54.9) · D 22.0% · R 76.8% · Other 1.2%
- 2008→2024 swing
- -22.6pp toward R · 2008: -32.3pp · 2024: -54.9pp
- All cycles
- 2024: R+54.9 2020: R+52.9 2016: R+51.8 2012: R+41.8 2008: R+32.3
Not yet ingested
- Civics
- —
Market trends
- HPI YoY
- ▲ 8.41%
- Current HPI
- 204.0051
- Rent YoY
- —
- Metro
- —
- State GDP YoY
- ▲ 0.68%
- F500 in state
- 2
Industry mix (Fortune 500 HQ in NE)
| Industry | F500 HQs | Revenue |
|---|---|---|
| Conglomerate | 1 | $371B |
|
||
Price history
+500.0% since first listed7 events — show timeline
- 2025-12-05 Listed $60,000 GPRMLS
- 2020-05-14 Sold (Public Records) $25,500 Public Records
- 2020-05-14 Sold (MLS) $25,500 GPRMLS
- 2020-03-17 Sold (Public Records) $25,500 Public Records
- 2020-02-03 Listed $28,500 GPRMLS
- 2017-01-13 Sold (Public Records) $20,000 Public Records
- 1999-10-27 Sold (Public Records) $10,000 Public Records
Property tax history
-0.9%/yrLatest (2025): $410 · +26.9% YoY. Source: county tax records.
Cash-flow waterfall
monthlySold comps — $/sqft
last 12 mo · ≤1 miLoading sold comps…