310 6th St · Lincoln, IL
Flood risk 1/10 · Minimal
- FEMA flood zone
- X (unshaded)
- Chance of flooding over 30 yrs
- 0.0%
- Est. flood insurance / yr
- $473 – $860
Fire risk 1/10 · Minimal
- Est. fire insurance / yr
- $804 – $1,492
Heat risk 4/10 · Minor
- Hot days now (above 105°F)
- 7 days/yr
- Hot days in 30 yrs
- 19 days/yr
Wind risk 2/10 · Minimal
- Chance of severe wind over 30 yrs
- 2.0%
Air-quality risk 2/10 · Minimal
- Unhealthy air days now
- 1 days/yr
- Unhealthy air days in 30 yrs
- 2 days/yr
Risk factors via First Street. Map © Google.
Why this score? — see what drove the B- grade
The composite is a weighted blend of 9 inputs, each scored 0–100. Each bar is that input's sub-score; the figure is the points it added to the 100-point composite (weight × sub-score).
- Cash flow +30.0/30.0
- 1% rule +10.0/10.0
- DSCR +10.0/10.0
- ARV discount +7.5/15.0
- Livability +3.4/5.0
- Rent growth +2.5/5.0
- Condition / age +2.5/5.0
- Schools +2.0/10.0
- Appreciation +0.0/10.0
$59,000
🖨 Deal sheet (PDF) 📄 Offer letter ✓ Due diligence
Listing remarks
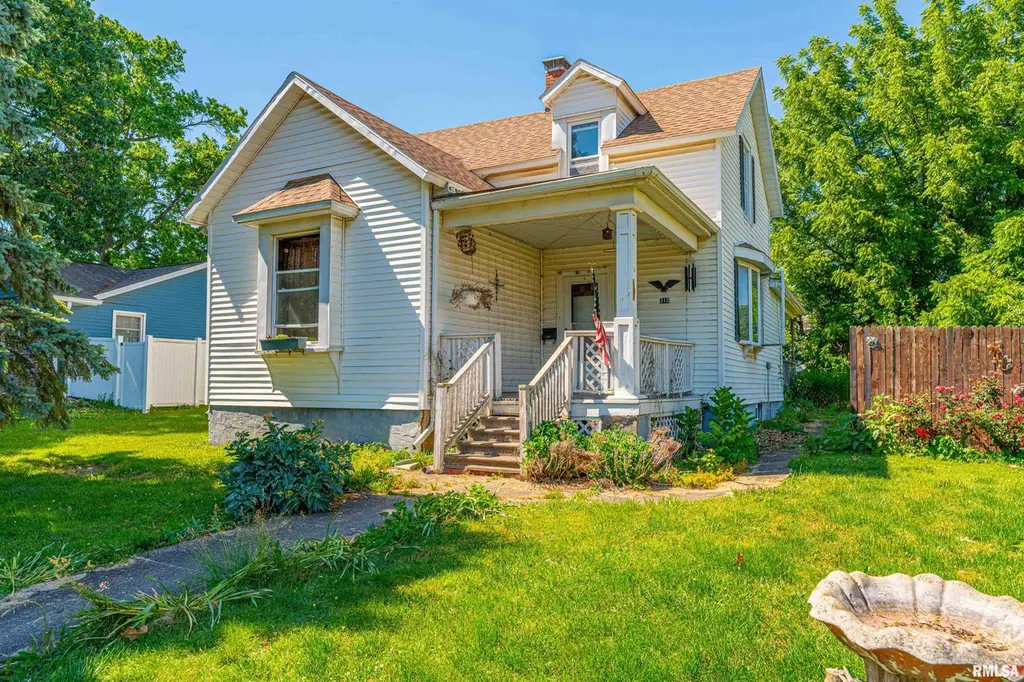
Spacious conveniently located 4-bedroom two story vinyl sided home with SO much potential! Main floor of home features living and dining areas, kitchen, two bedrooms, and a full bath. Upstairs, you will find two additional bedrooms. Property also features a partial basement (exterior access), older rear storage shed, two car detached garage with rear alley access, and a quaint covered front porch. Sold "AS IS, WHERE IS, " this stately residential dwelling needs your creative touch to truly shine for years to come!
Key facts
- 0.28 acre lot
- 2 garage spots
- Built 1892
Property features AI
Exterior
- Parking: Detached 2-car garage with alley access
- Utilities: Public water; Public sewer
- Home design: Single-family residence; Two levels
- Construction: Built in 1892; Shingle roof; Partial, unfinished basement
- Exterior features: Shed(s); Sloped lot
Interior
- Kitchen: Kitchen on main level
- Bedrooms: 4 bedrooms (bedroom sizes vary; primary/main level bedroom approx. 13 x 11)
- Flooring: Carpet in main and upper level living spaces; Vinyl flooring in kitchen
- Bathrooms: 1 full bathroom
- Heating & cooling: Forced air heating; Central air conditioning
- Interior features: Ceiling fans
- Laundry & utility: Laundry room in basement
Neighborhood map
What this means for you Summary
Snapshot
- This is a 4-bed/1.0-bath other listed at $59k.
Deal economics
- At list price, monthly cash flow is $327 ($4k/yr) — positive.
- The deal already cash-flows at list — no discount required.
- Meets the 1% rule at list price ($930 rent vs $59k).
- Recommended offer: $58k (1.5% below list) — sets the bar for market timing.
- Cap rate 12.9% vs local median 4.1% in Lincoln — top-decile yield for the area; either an underpriced asset or a hidden risk that comps aren't pricing in. Stress-test before assuming the spread holds.
Location & tenants
- Location reads 67/100 on livability (#509 in IL) — a middle-class / working-renter tenant base. Strengths: cost of living A+, housing A+, crime A-; Watch: amenities F, commute F, employment D-.
- Lincoln Chsd 404 (town): math 21% / reading 27% proficiency, ranked #367 of 620 in IL (top 59%) — low school quality limits family demand, transient renter base, plan for 1-2y turnover.
- Zoned schools: Lincoln Jr High School (math 22% / reading 44%, grade F, #217 of 665 statewide, top 33%, 341 students, 0% FRL); Lincoln Comm High School (math 21% / reading 27%, grade F, #304 of 693 statewide, top 44%, 786 students, 0% FRL).
- Market conditions: 77 active listings in the ZIP; 1 comparable units currently listed for rent nearby; 10 units permitted in Logan County in 2024 (0 in 5+ unit buildings).
Forward outlook
- Local home prices are declining (-3.0%/yr); year-one equity from $408 of loan paydown is wiped out by about $2k of value loss. Plan a longer hold.
- Logan County population projected at -11% by 2050 — secular population decline; favor cash flow + early exit over multi-decade hold.
- At projected returns (-3.0% appreciation + 3.0% rent growth), your $17k cash investment doubles in ~6 years — after that, you're playing with house money.
Negotiation context
- It's been on market 18 days — a 2% lower offer ($58k) is reasonable based on typical stale-listing flexibility.
Risks & watch-outs
- Watch-outs: built in 1892 — expect roof / HVAC / electrical / plumbing capex.
Questions for the listing agent
- Built in 1892 — when were the roof, HVAC, electrical panel, plumbing, and water heater last replaced?
- Is there a deadline driving the sale (1031 exchange, divorce, estate, relocation)? That informs how much negotiation room exists.
- Schools are D-rated, which usually means shorter tenancies and higher turnover. Who's the typical renter profile here, and what's been the actual vacancy rate?
- What's the average days-on-market for RENTAL listings here right now (not sales)? A rising rental-DOM trend means longer vacancies and softer asking-rent achievability than the comps imply.
- What's the recent tenant-quality profile in this submarket — average credit score on applications, eviction rate, late-payment / NSF rate, and stable-employment percentage? A property-management company in the area should have these aggregated.
- How much new for-sale + rental construction is in the pipeline within 1–3 miles? Heavy new supply typically softens prices + rents 12–24 months out; constrained supply supports both.
Investment metrics
- 1% rule
- 1.58% ✓
- Cap rate
- 12.94%
- Cash-on-cash
- 23.75%
- DSCR
- 2.06
- GRM
- 5.3
CMA / ARV
No comps found within radius.
Projected returns pro-forma
-3.0% appreciation · 3.0% rent growth · sell at horizon
- IRR
- 16.9%
- Equity multiple
- 1.68×
- Total profit
- $11,278
- Equity at exit
- $8,797
- IRR
- 25.5%
- Equity multiple
- 3.22×
- Total profit
- $36,693
- Equity at exit
- $5,101
Cash invested: $16,520 (down + closing). Projections, not guarantees.
Landlord ↔ Tenant lean methodology
- Overall (STATE)
- 43 Moderately Tenant-Leaning
- State Illinois
- 43 Moderately Tenant-Leaning · D+7
- County
- — inherits STATE
- City
- — inherits STATE
ZIP-level market 62656
- Active inventory
- 77
- Price-to-rent
- 5.3×
Monthly cashflow live
- Estimated rent
- $930 medium interval (Pro) →
- Mortgage (P&I)
- −$309
- Tax est. 1.5%
- −$74 /mo · $885/yr
- Insurance
- −$25
- HOA
- −$0
- Vacancy / Maint / Mgmt
- −$195
- Net cashflow
- $327
Break-even live
Sensitivity live
| Price | -10% $368 | -5% $347 | +0% $327 | +5% $307 | +10% $286 |
|---|---|---|---|---|---|
| Rent | -10% $253 | -5% $290 | +0% $327 | +5% $364 | +10% $400 |
| Rate | -1.0pp $357 | -0.5pp $342 | base $327 | +0.5pp $312 | +1.0pp $296 |
UW: 25.0% down · 7.5% · 30yr · 1.5% tax · 5.0% vac · 8.0% maint · 8.0% mgmt
Financing live
Cash to close
- Down payment
- $14,750
- Closing costs
- $1,770
- Reserves months
- —
- Total cash needed
- —
Loan-product check · same deal, 3 products live
Conventional
25% down · 7.5% · 30yr
- Down + closing
- —
- Monthly P&I
- —
- Monthly cashflow
- —
- DSCR
- —
- Eligible?
- —
Personal DTI + credit; lowest rate.
DSCR
20% down · 8.5% · 30yr
- Down + closing
- —
- Monthly P&I
- —
- Monthly cashflow
- —
- DSCR
- —
- Eligible?
- —
No personal income docs; deal must DSCR.
Hard money
10% down · 12.0% · 12mo
- Down + closing
- —
- Monthly P&I
- —
- Monthly cashflow
- —
- DSCR
- —
- Eligible?
- —
Short-term bridge; refi at stabilization.
Rent comps 1 comps
| Address | Beds | Baths | Sqft | Rent | $/sqft | DOM | Units | Dist |
|---|---|---|---|---|---|---|---|---|
| 1103 N State St Lincoln, IL | 1.0–3.0 | 1.0–2.0 | 996 | $930 | $0.93 | 22d | 1 | 1.02mi |
Listing history 13 events
-
2026-06-21days on market $59,000 Active 18 DOM
-
2026-06-21days on market $59,000 Active 17 DOM
-
2026-06-18days on market $59,000 Active 15 DOM
-
2026-06-17days on market $59,000 Active 14 DOM
-
2026-06-16days on market $59,000 Active 13 DOM
-
2026-06-15days on market $59,000 Active 12 DOM
-
2026-06-13days on market $59,000 Active 10 DOM
-
2026-06-12days on market $59,000 Active 9 DOM
-
2026-06-09days on market $59,000 Active 6 DOM
-
2026-06-08days on market $59,000 Active 5 DOM
-
2026-06-07days on market $59,000 Active 4 DOM
-
2026-06-04remarks 519-char remark
-
2026-06-04$59,000 Active 1 DOM
ⓘ Source: listings_history table (triggers on properties + properties_extension) + one-shot
backfill from property_details.listing_events for pre-trigger history.
Climate risk First Street
- Flood 1/10 Low FEMA zone X (unshaded) · 0% chance over 30 yrs
- Wildfire 1/10 Low
- Heat 4/10 Moderate 7 d/yr ≥105°F today · 19 d/yr by 30 yrs out
- Wind 2/10 Low 2% chance of damaging wind over 30 yrs
- Air quality 2/10 Low 1 unhealthy d/yr today · 2 by 30 yrs out
Nearby sold comps map
Loading sold comps map…
Walkable amenities ~0.75 mi
Loading nearby amenities…
Taxation est. · year 1
- Rental income
- $11,160
- − Mortgage interest
- −$3,305
- − Property taxes
- −$885
- − Insurance
- −$295
- − Repairs & maintenance
- −$893
- − Management
- −$893
- − Depreciation
- −$1,716
- Taxable income
- $3,173
- Est. tax owed @ 24.0%
- −$762
- After-tax cash flow
- $3,162/yr
For passive investors: Depreciation is non-cash, so a rental often shows a tax loss while cash-flowing — sheltering income. Rental losses are passive: they offset passive income freely, and up to $25,000/yr can offset ordinary (W-2) income if you actively participate and your MAGI is under $100k (phasing out to $0 by $150k); unused losses carry forward. On sale, claimed depreciation is recaptured at up to 25%, and gains may owe capital-gains tax (a 1031 exchange can defer both). Figures are a year-1 estimate at your 24.0% rate — not tax advice; consult a CPA.
Schools (NCES district)
- District
- Lincoln Chsd 404
- NCES district ID
- 1723050
- Math proficiency
- 21% ▼ -9.00%
- Reading proficiency
- 27% ▼ -8.00%
- Median HH income
- $41,489
- Composite
- 20.4/100
- National rank
- #8590
- State rank
- #367 of 620 in IL
Livability — Lincoln
- Score
- 67/100
- State rank
- #509
- US rank
- #10514
Category grades
Schools grade is shown separately in the Schools card above.
Census & demographics
- Census place
- Lincoln, IL
- City population
- 18,364
- Population (ZIP)
- 18,364
Population outlook (Logan County) Hauer SSP2
- Today (2025)
- 28,066 people
- By 2030
- 27,370 · -2.5%
- By 2040
- 26,078 · -7.1%
- By 2050
- 24,908 · -11.3%
- By 2075
- 22,504 · -19.8%
- By 2100
- 19,226 · -31.5%
Race, ethnicity, and origin ACS 2023
- Neighborhood character
- Predominantly White (83%)
- Race & ethnicity
- White 83% Black 9% Two or more races 5% Hispanic / Latino 3%
- Common ancestry
- Lithuanian 2% Slovak 1% Romanian 1%
- Foreign-born
- 2% · Canada
- Languages at home
- 96% English-only · Spanish 3%
Political lean MEDSL · Logan
- 2024 margin
- Solid R (+41.5) · D 28.2% · R 69.8% · Other 2.0%
- 2008→2024 swing
- -24.6pp toward R · 2008: -16.9pp · 2024: -41.5pp
- All cycles
- 2024: R+41.5 2020: R+39.8 2016: R+40.1 2012: R+32.1 2008: R+16.9
Not yet ingested
- Civics
- —
Market trends
- HPI YoY
- ▼ -181.45%
- Current HPI
- 133.9499
- Rent YoY
- —
- Metro
- —
- State GDP YoY
- ▲ 1.59%
- F500 in state
- 60
Industry mix (Fortune 500 HQ in IL)
| Industry | F500 HQs | Revenue |
|---|---|---|
| Insurance | 4 | $201B |
|
||
| Consumer Goods | 4 | $87B |
|
||
| Industrial Machinery | 3 | $64B |
|
||
| Healthcare | 2 | $55B |
|
||
| Retail / Pharmacy | 1 | $148B |
|
||
| Agriculture / Food | 1 | $86B |
|
||
Price history
1 event — show timeline
- 2026-06-02 Listed $59,000 RMLSA as Distributed by MLS Grid
Property tax history
+1.9%/yrLatest (2024): $3,026 · +4.7% YoY. Source: county tax records.
Cash-flow waterfall
monthlySold comps — $/sqft
last 12 mo · ≤1 miLoading sold comps…