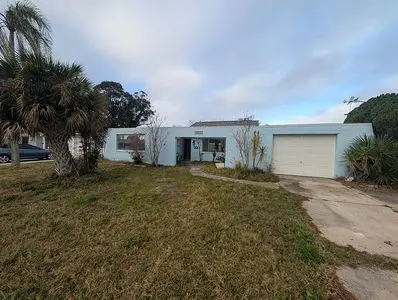
3931 Endicott Dr · Beacon Square, FL
Flood risk 7/10 · Major
- FEMA flood zone
- X (shaded)
- Chance of flooding over 30 yrs
- 0.81%
- Est. flood insurance / yr
- $507 – $1,088
Fire risk 3/10 · Minor
- Est. fire insurance / yr
- $947 – $1,759
Heat risk 10/10 · Severe
- Hot days now (above 109°F)
- 7 days/yr
- Hot days in 30 yrs
- 29 days/yr
Wind risk 10/10 · Severe
- Chance of severe wind over 30 yrs
- 99.0%
Air-quality risk 2/10 · Minimal
- Unhealthy air days now
- 1 days/yr
- Unhealthy air days in 30 yrs
- 1 days/yr
Risk factors via First Street. Map © Google.
Why this score? — see what drove the B- grade
The composite is a weighted blend of 9 inputs, each scored 0–100. Each bar is that input's sub-score; the figure is the points it added to the 100-point composite (weight × sub-score).
- Cash flow +23.8/30.0
- ARV discount +15.0/15.0
- DSCR +7.7/10.0
- 1% rule +6.6/10.0
- Schools +4.3/10.0
- Livability +3.3/5.0
- Rent growth +2.7/5.0
- Condition / age +2.5/5.0
- Appreciation +0.0/10.0
$160,000
🖨 Deal sheet (PDF) 📄 Offer letter ✓ Due diligence
Listing remarks MLS
IMPECCABLE home. .. that has a great feel to it. Walk into the large open walkway and Sunken living room. The dining room is separate and the kitchen is open to the family room. Home has been painted on the outside in the last month. Appliances 2007.Kitchen has a bar which opens to the family room. Sliders lead out to beautiful back porch and yard. Huge porch 35' x 12' with ceiling fan and another screened area perfect for a hot tub. Privacy fenced yard. Central heat and air, duct work and returns and all done in 3/2007. All rooms are large. Ceramic tile throughout and carpet in bedrooms. Freshly painted on the outside. This home has it all.
Key facts
- Built 1971
Neighborhood map
What this means for you Summary
Snapshot
- This is a 3-bed/2.0-bath single-family listed at $160k.
Deal economics
- At list price, monthly cash flow is $241 ($3k/yr) — positive.
- The deal already cash-flows at list — no discount required.
- Meets the 1% rule at list price ($2k rent vs $160k).
- Cap rate 8.6% vs local median 2.7% in Beacon Square — top-decile yield for the area; either an underpriced asset or a hidden risk that comps aren't pricing in. Stress-test before assuming the spread holds.
Location & tenants
- Location reads 66/100 on livability (#600 in FL) — a middle-class / working-renter tenant base. Strengths: cost of living A+, housing A+, health & safety B; Watch: employment D, schools F, amenities F.
- Pasco (suburban): math 50% / reading 52% proficiency, ranked #32 of 73 in FL (top 44%) — acceptable for families but not a draw, mixed tenant base, ~2y average lease.
- Market conditions: Rents flat; 635 active listings in the ZIP; 40 comparable units currently listed for rent nearby; rentals at typical pace (median 16d on market — plan ~3-4 weeks tenant-placement turnaround); 6,765 units permitted in Pasco County in 2024 (1,250 in 5+ unit buildings).
- This rent runs 39% of the median local income ($57k/yr) — at the standard rent-burdened threshold; future hikes will face affordability resistance.
Forward outlook
- Local home prices are declining (-3.0%/yr); year-one equity from $1k of loan paydown is wiped out by about $5k of value loss. Plan a longer hold.
- Pasco County population projected at +29% by 2050 — long-run rental-demand tailwind backs the buy-and-hold thesis.
Negotiation context
- Only 0 days on market — expect competitive offers; lowballing is unlikely to land.
- 2 sale attempts since 13y ago with the ask held roughly flat each time — persistent listings suggest the price (not the market) is what's stuck; bring a comps-based counter.
- Current owner paid $67k; list at $160k implies a 139% gain — meaningful room to come down on a strong offer.
Risks & watch-outs
- Watch-outs: flood insurance adds $66/mo.
- Climate carrying-cost: major flood risk; severe wind risk, 99% chance of damaging wind over 30y; extreme-heat days projected 7→29/yr by 2055 (HVAC capex compounding) — expect insurance premiums to compound above CPI over the hold.
Questions for the listing agent
- Built in 1971 — when were the roof, HVAC, electrical panel, plumbing, and water heater last replaced?
- What's the actual annual flood-insurance premium (NFIP or private), and is the property in a SFHA with mandatory coverage?
- Is there a deadline driving the sale (1031 exchange, divorce, estate, relocation)? That informs how much negotiation room exists.
- Schools are F-rated, which usually means shorter tenancies and higher turnover. Who's the typical renter profile here, and what's been the actual vacancy rate?
- What's the average days-on-market for RENTAL listings here right now (not sales)? A rising rental-DOM trend means longer vacancies and softer asking-rent achievability than the comps imply.
- What's the recent tenant-quality profile in this submarket — average credit score on applications, eviction rate, late-payment / NSF rate, and stable-employment percentage? A property-management company in the area should have these aggregated.
- How much new for-sale + rental construction is in the pipeline within 1–3 miles? Heavy new supply typically softens prices + rents 12–24 months out; constrained supply supports both.
Investment metrics
- 1% rule
- 1.16% ✓
- Cap rate
- 8.60%
- Cash-on-cash
- 8.23%
- DSCR
- 1.37
- GRM
- 7.2
CMA / ARV
- ARV (on-the-fly)
- $249,458
- Comps found
- 12
Show comp detail 12 sales within ~0.75 mi
| Address | Dist | Beds/Ba | Sqft | Sold | Price | $/sf | Match |
|---|---|---|---|---|---|---|---|
| 4245 Crestfield Ave | 0.31mi | 3/2.0 | 1,291 (-3%) | 2mo | $228,000 | $177 | 78 |
| 4011 Grayton Dr | 0.21mi | 2/2.0 (-1) | 1,200 (-10%) | 0mo | $140,000 | $117 | 68 |
| 4250 Pinefield Ave | 0.25mi | 3/2.0 | 1,484 (+11%) | 2mo | $290,000 | $195 | 68 |
| 3524 Cheswick Dr | 0.54mi | 3/2.0 | 1,258 (-6%) | 2mo | $235,000 | $187 | 63 |
| 4214 Ridgefield Ave | 0.43mi | 3/2.0 | 1,196 (-10%) | 1mo | $240,000 | $201 | 62 |
| 4711 Beacon Hill Dr | 0.51mi | 3/2.0 | 1,224 (-8%) | 1mo | $270,000 | $221 | 62 |
| 3707 Pinehurst Dr | 0.27mi | 3/2.0 | 1,534 (+15%) | 2mo | $270,000 | $176 | 61 |
| 4251 Woodfield Ave | 0.27mi | 2/2.0 (-1) | 1,507 (+13%) | 1mo | $195,000 | $129 | 60 |
| 3625 Windham Dr | 0.44mi | 3/1.0 | 1,200 (-10%) | 2mo | $225,000 | $188 | 57 |
| 4434 Tucker Sq | 0.47mi | 2/2.0 (-1) | 1,166 (-13%) | 0mo | $110,000 | $94 | 52 |
| 3701 Devonshire Dr | 0.56mi | 3/2.0 | 1,176 (-12%) | 3mo | $309,000 | $263 | 52 |
| 3608 Edenwood Dr | 0.73mi | 2/2.0 (-1) | 1,200 (-10%) | 2mo | $170,000 | $142 | 42 |
Match score weights: distance 35% · size 25% · config 20% · recency 20%. Top-matched comps best support the ARV.
Projected returns pro-forma
-3.0% appreciation · 0.72% rent growth · sell at horizon
- IRR
- -9.1%
- Equity multiple
- 0.67×
- Total profit
- $-14,647
- Equity at exit
- $23,857
- IRR
- -3.3%
- Equity multiple
- 0.80×
- Total profit
- $-8,880
- Equity at exit
- $13,834
Cash invested: $44,800 (down + closing). Projections, not guarantees.
Landlord ↔ Tenant lean methodology
- Overall (STATE)
- 87 Strongly Landlord-Friendly
- State Florida
- 87 Strongly Landlord-Friendly · R+3
- County
- — inherits STATE
- City
- — inherits STATE
ZIP-level market 34652
- Home prices YoY
- -26.1%
- Rents YoY
- 0.7%
- Active inventory
- 635
- Price-to-rent
- 7.2×
Monthly cashflow live
- Estimated rent
- $1,850 high interval (Pro) →
- Mortgage (P&I)
- −$839
- Tax from tax record
- −$249 /mo · $2,984/yr
- Insurance
- −$67
- Flood insurance flood zone
- −$66 /mo · $798/yr
- HOA
- −$0
- Vacancy / Maint / Mgmt
- −$389
- Net cashflow
- $241
Break-even live
Sensitivity live
| Price | -10% $331 | -5% $286 | +0% $241 | +5% $195 | +10% $150 |
|---|---|---|---|---|---|
| Rent | -10% $95 | -5% $168 | +0% $241 | +5% $314 | +10% $387 |
| Rate | -1.0pp $321 | -0.5pp $281 | base $241 | +0.5pp $199 | +1.0pp $157 |
UW: 25.0% down · 7.5% · 30yr · 1.5% tax · 5.0% vac · 8.0% maint · 8.0% mgmt
Financing live
Cash to close
- Down payment
- $40,000
- Closing costs
- $4,800
- Reserves months
- —
- Total cash needed
- —
Loan-product check · same deal, 3 products live
Conventional
25% down · 7.5% · 30yr
- Down + closing
- —
- Monthly P&I
- —
- Monthly cashflow
- —
- DSCR
- —
- Eligible?
- —
Personal DTI + credit; lowest rate.
DSCR
20% down · 8.5% · 30yr
- Down + closing
- —
- Monthly P&I
- —
- Monthly cashflow
- —
- DSCR
- —
- Eligible?
- —
No personal income docs; deal must DSCR.
Hard money
10% down · 12.0% · 12mo
- Down + closing
- —
- Monthly P&I
- —
- Monthly cashflow
- —
- DSCR
- —
- Eligible?
- —
Short-term bridge; refi at stabilization.
Rent comps 40 comps
| Address | Beds | Baths | Sqft | Rent | $/sqft | DOM | Units | Dist |
|---|---|---|---|---|---|---|---|---|
| 4133 Grayton Dr New Port Richey, FL | 2.0 | 1.5 | 1068 | $1,727 | $1.62 | 5d | 1 | 0.06mi |
| 4301 Straits Ln New Port Richey, FL | 3.0 | 1.5 | 1284 | $1,790 | $1.39 | 25d | 1 | 0.10mi |
| 4010 Stratfield Dr New Port Richey, FL | 3.0 | 2.0 | 1708 | $2,035 | $1.19 | 5d | 1 | 0.18mi |
| 3847 Lighthouse Way New Port Richey, FL | 2.0 | 2.0 | 1144 | $1,595 | $1.39 | 22d | 1 | 0.20mi |
| 4031 Davit Dr New Port Richey, FL | 2.0 | 2.0 | 1144 | $1,600 | $1.40 | 18d | 1 | 0.27mi |
| 4022 Davit Dr New Port Richey, FL | 2.0 | 2.0 | 1144 | $1,600 | $1.40 | 18d | 1 | 0.31mi |
| 4221 Touchton Pl New Port Richey, FL | 2.0 | 2.0 | 888 | $1,300 | $1.46 | 24d | 1 | 0.33mi |
| 4211 Hampton Dr New Port Richey, FL | 2.0 | 2.0 | 1050 | $1,795 | $1.71 | 5d | 1 | 0.43mi |
| 3444 Rosefield Dr Holiday, FL | 3.0 | 2.0 | 1700 | $2,200 | $1.29 | 25d | 1 | 0.45mi |
| 3439 Clydesdale Dr Holiday, FL | 2.0 | 1.0 | 968 | $1,395 | $1.44 | 5d | 1 | 0.47mi |
| 4408 Rustic Dr New Port Richey, FL | 2.0 | 1.0 | 1101 | $1,500 | $1.36 | 25d | 1 | 0.47mi |
| 4411 Rustic Dr Unit 1 New Port Richey, FL | 2.0 | 2.0 | 1050 | $1,450 | $1.38 | 13d | 1 | 0.47mi |
| 3637 Winder Dr Holiday, FL | 4.0 | 1.0 | 1300 | $2,400 | $1.85 | 5d | 1 | 0.53mi |
| 3336 Rosefield Dr Holiday, FL | 4.0 | 1.0 | 1350 | $1,700 | $1.26 | 25d | 1 | 0.57mi |
| 4505 Cottonwood Dr New Port Richey, FL | 4.0 | 2.0 | 1349 | $2,000 | $1.48 | 3d | 1 | 0.59mi |
| 3549 Winder Dr Holiday, FL | 3.0 | 2.0 | 1546 | $2,500 | $1.62 | 0d | 1 | 0.60mi |
| 3301 Rosefield Dr Holiday, FL | 3.0 | 2.0 | 1340 | $2,100 | $1.57 | 18d | 1 | 0.63mi |
| 3612 Springfield Dr Holiday, FL | 2.0 | 1.5 | 1040 | $1,450 | $1.39 | 18d | 1 | 0.66mi |
| 3445 Wiltshire Dr Holiday, FL | 2.0 | 1.5 | 992 | $1,450 | $1.46 | 22d | 1 | 0.73mi |
| 3433 Monticello St Holiday, FL | 3.0 | 1.5 | 960 | $1,650 | $1.72 | 25d | 1 | 0.76mi |
| 3162 Victoria Inlet Dr Holiday, FL | 3.0 | 2.5 | 1632 | $2,375 | $1.46 | 5d | 1 | 0.79mi |
| 4282 Rudder Way New Port Richey, FL | 3.0 | 2.0 | 1454 | $2,000 | $1.38 | 25d | 1 | 0.83mi |
| 4282 Rudder Way New Port Richey, FL | 3.0 | 2.0 | 1310 | $2,000 | $1.53 | 4d | 1 | 0.83mi |
| 3511 Cambridge St New Port Richey, FL | 2.0 | 2.0 | 936 | $2,100 | $2.24 | 5d | 1 | 0.83mi |
| 4645 Irene Loop New Port Richey, FL | 3.0 | 1.0 | 1158 | $1,700 | $1.47 | 0d | 1 | 0.88mi |
| 3431 Overland Dr Holiday, FL | 3.0 | 2.0 | 1236 | $1,850 | $1.50 | 25d | 1 | 0.92mi |
| 4721 Naftis Ln New Port Richey, FL | 3.0 | 2.0 | 1104 | $1,700 | $1.54 | 13d | 1 | 0.93mi |
| 4616 Irene Loop New Port Richey, FL | 2.0 | 1.0 | 898 | $1,600 | $1.78 | 20d | 1 | 0.95mi |
| 4117 Highland Loop New Port Richey, FL | 3.0 | 2.0 | 1384 | $1,599 | $1.16 | 13d | 1 | 1.01mi |
| 3528 Rock Royal Dr Holiday, FL | 2.0 | 1.0 | 1052 | $1,700 | $1.62 | 0d | 1 | 1.01mi |
| 4852 Pompano Dr New Port Richey, FL | 2.0 | 2.0 | 1104 | $2,900 | $2.63 | 25d | 1 | 1.04mi |
| 4348 Plaza Dr Holiday, FL | 1.0–2.0 | 1.0–2.0 | 860 | $1,499 | $1.74 | 0d | 7 | 1.10mi |
| 4554 Nimmer Dr New Port Richey, FL | 3.0 | 2.0 | 1180 | $1,600 | $1.36 | 15d | 1 | 1.13mi |
| 4205 Jordana Way Holiday, FL | 1.0–3.0 | 1.0–2.0 | 1027 | $1,633 | $1.59 | 3d | 13 | 1.15mi |
| 3252 Peterborough St Holiday, FL | 3.0 | 2.0 | 1290 | $1,631 | $1.26 | 5d | 1 | 1.16mi |
| 4548 Belfast Dr New Port Richey, FL | 3.0 | 1.0 | 1075 | $1,575 | $1.47 | 18d | 1 | 1.16mi |
| 5319 Drift Tide Dr New Port Richey, FL | 2.0 | 1.5 | 1142 | $1,500 | $1.31 | 10d | 1 | 1.18mi |
| 4939 Floramar Ter New Port Richey, FL | 2.0 | 2.0 | 1050 | $1,675 | $1.60 | 25d | 2 | 1.25mi |
| 4939 Floramar Ter New Port Richey, FL | 2.0 | 2.0 | 1050 | $1,648 | $1.57 | 17d | 3 | 1.25mi |
| 4939 Floramar Ter New Port Richey, FL | 2.0 | 2.0 | 1050 | $1,600 | $1.52 | 2d | 2 | 1.25mi |
Listing history 6 events
-
2026-05-26$160,000
-
2013-10-29soldstatus $67,000 650-char remark
Show marketing remark (650 chars)
IMPECCABLE home. .. that has a great feel to it. Walk into the large open walkway and Sunken living room. The dining room is separate and the kitchen is open to the family room. Home has been painted on the outside in the last month. Appliances 2007.Kitchen has a bar which opens to the family room. Sliders lead out to beautiful back porch and yard. Huge porch 35' x 12' with ceiling fan and another screened area perfect for a hot tub. Privacy fenced yard. Central heat and air, duct work and returns and all done in 3/2007. All rooms are large. Ceramic tile throughout and carpet in bedrooms. Freshly painted on the outside. This home has it all.
-
2013-10-29soldstatus $67,000
Show marketing remark (650 chars)
IMPECCABLE home. .. that has a great feel to it. Walk into the large open walkway and Sunken living room. The dining room is separate and the kitchen is open to the family room. Home has been painted on the outside in the last month. Appliances 2007.Kitchen has a bar which opens to the family room. Sliders lead out to beautiful back porch and yard. Huge porch 35' x 12' with ceiling fan and another screened area perfect for a hot tub. Privacy fenced yard. Central heat and air, duct work and returns and all done in 3/2007. All rooms are large. Ceramic tile throughout and carpet in bedrooms. Freshly painted on the outside. This home has it all.
-
2013-05-06$74,900 650-char remark
Show marketing remark (650 chars)
IMPECCABLE home. .. that has a great feel to it. Walk into the large open walkway and Sunken living room. The dining room is separate and the kitchen is open to the family room. Home has been painted on the outside in the last month. Appliances 2007.Kitchen has a bar which opens to the family room. Sliders lead out to beautiful back porch and yard. Huge porch 35' x 12' with ceiling fan and another screened area perfect for a hot tub. Privacy fenced yard. Central heat and air, duct work and returns and all done in 3/2007. All rooms are large. Ceramic tile throughout and carpet in bedrooms. Freshly painted on the outside. This home has it all.
-
2001-02-27soldstatus $63,400
-
1994-08-24soldstatus $53,600
ⓘ Source: listings_history table (triggers on properties + properties_extension) + one-shot
backfill from property_details.listing_events for pre-trigger history.
Tax reassessment forecast FL · Resets to sale price
- Current annual tax
- $2,984 · $249/mo
- Projected year-2 tax
- $2,984 · $249/mo
- Expected delta
- $0/yr ($0/mo · -0.0%)
ⓘ Screening estimate from a state-policy table — verify with the county assessor before closing.
Climate risk First Street
- Flood 7/10 Severe FEMA zone X (shaded) · 81% chance over 30 yrs
- Wildfire 3/10 Moderate
- Heat 10/10 Extreme 7 d/yr ≥109°F today · 29 d/yr by 30 yrs out
- Wind 10/10 Extreme 99% chance of damaging wind over 30 yrs
- Air quality 2/10 Low 1 unhealthy d/yr today · 1 by 30 yrs out
Nearby sold comps map
Loading sold comps map…
Walkable amenities ~0.75 mi
Loading nearby amenities…
Taxation est. · year 1
- Rental income
- $22,201
- − Mortgage interest
- −$8,962
- − Property taxes
- −$2,984
- − Insurance
- −$1,598
- − Repairs & maintenance
- −$1,776
- − Management
- −$1,776
- − Depreciation
- −$4,655
- Taxable income
- $450
- Est. tax owed @ 24.0%
- −$108
- After-tax cash flow
- $2,781/yr
For passive investors: Depreciation is non-cash, so a rental often shows a tax loss while cash-flowing — sheltering income. Rental losses are passive: they offset passive income freely, and up to $25,000/yr can offset ordinary (W-2) income if you actively participate and your MAGI is under $100k (phasing out to $0 by $150k); unused losses carry forward. On sale, claimed depreciation is recaptured at up to 25%, and gains may owe capital-gains tax (a 1031 exchange can defer both). Figures are a year-1 estimate at your 24.0% rate — not tax advice; consult a CPA.
Schools (NCES district)
- District
- Pasco
- NCES district ID
- 1201530
- Math proficiency
- 50% ▼ -10.00%
- Reading proficiency
- 52% ▼ -5.00%
- Median HH income
- $45,039
- Composite
- 43.14/100
- National rank
- #3074
- State rank
- #32 of 73 in FL
Livability — Beacon Square
- Score
- 66/100
- State rank
- #600
- US rank
- #11494
Category grades
Schools grade is shown separately in the Schools card above.
Census & demographics
- Census place
- Beacon Square, FL
- County
- Pasco County · 524,098 people
- Metro
- Tampa-St. Petersburg-Clearwater, FL
- Population (ZIP)
- 27,444
- Household income
- $56,931
- Rent vs Own
- Severe rent burden
- 1190.0
Population outlook (Pasco County) Hauer SSP2
- Today (2025)
- 570,045 people
- By 2030
- 605,844 · +6.3%
- By 2040
- 674,806 · +18.4%
- By 2050
- 736,022 · +29.1%
- By 2075
- 862,900 · +51.4%
- By 2100
- 906,364 · +59.0%
Race, ethnicity, and origin ACS 2023
- Neighborhood character
- Predominantly White (78%)
- Race & ethnicity
- White 78% Hispanic / Latino 13% Two or more races 9% Black 4%
- Hispanic origin (detail)
- Mexican 3% Puerto Rican 4% Cuban 4%
- Common ancestry
- Romanian 4% Lithuanian 3% Slovak 2%
- Foreign-born
- 9% · Canada
- Languages at home
- 87% English-only · Spanish 9% Other Indo-European 1% Russian/Polish/Slavic 1%
Political lean MEDSL · Pasco
- 2024 margin
- Strong R (+25.2) · D 36.9% · R 62.1% · Other 1.0%
- 2008→2024 swing
- -21.6pp toward R · 2008: -3.6pp · 2024: -25.2pp
- All cycles
- 2024: R+25.2 2020: R+20.1 2016: R+21.6 2012: R+6.7 2008: R+3.6
Not yet ingested
- Civics
- —
Market trends
- HPI YoY
- ▼ -109.49%
- Current HPI
- 310.8347
- Rent YoY
- ▲ 0.72%
- Metro
- Tampa-St. Petersburg-Clearwater, FL
- State GDP YoY
- ▲ 3.28%
- F500 in state
- 36
Industry mix (Fortune 500 HQ in FL)
| Industry | F500 HQs | Revenue |
|---|---|---|
| Industrial Technology | 2 | $29B |
|
||
| Insurance | 2 | $17B |
|
||
| Retail | 1 | $60B |
|
||
| Technology Distribution | 1 | $58B |
|
||
| Homebuilding | 1 | $35B |
|
||
| Technology Manufacturing | 1 | $35B |
|
||
Price history
+198.5% since first listed6 events — show timeline
- 2026-05-26 Listed $160,000 FSBO.com
- 2013-10-29 Sold (Public Records) $67,000 Public Records
- 2013-10-29 Sold (MLS) $67,000 Stellar MLS as Distributed by MLS Grid
- 2013-05-06 Listed $74,900 Stellar MLS as Distributed by MLS Grid
- 2001-02-27 Sold (Public Records) $63,400 Public Records
- 1994-08-24 Sold (Public Records) $53,600 Public Records
Property tax history
+13.7%/yrLatest (2025): $2,984 · +0.9% YoY. Source: county tax records.
Cash-flow waterfall
monthlySold comps — $/sqft
last 12 mo · ≤1 miLoading sold comps…