 7-Plex
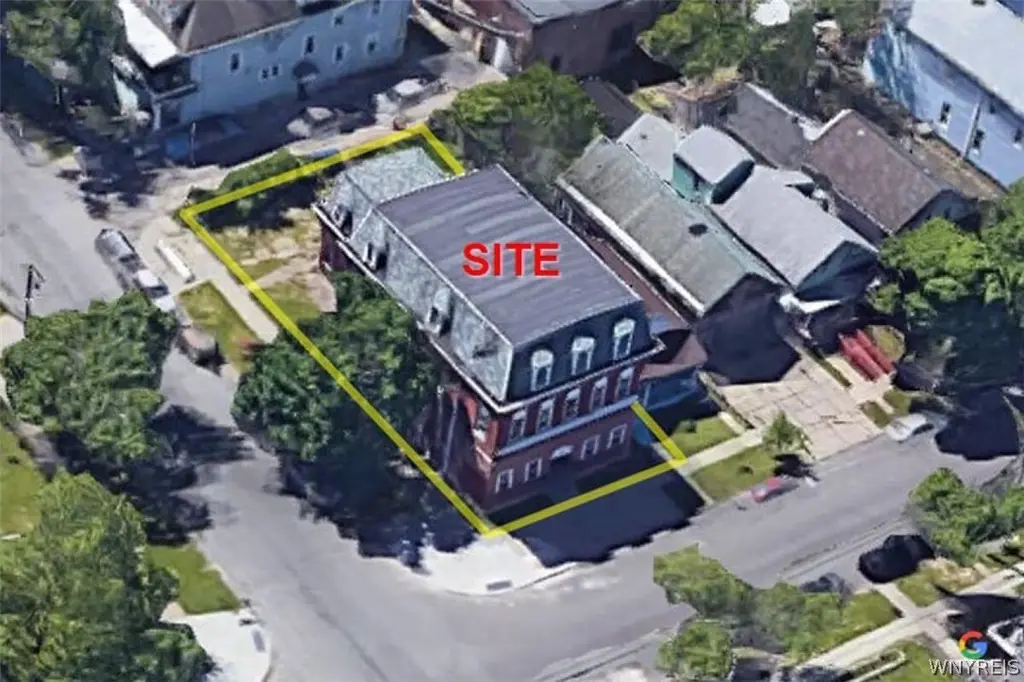
213 Vermont St · Buffalo, NY
Flood risk No data
- FEMA flood zone
- —
- Chance of flooding over 30 yrs
- —
- Est. flood insurance / yr
- —
Fire risk No data
- Est. fire insurance / yr
- —
Heat risk No data
- Hot days now (above threshold)
- —
- Hot days in 30 yrs
- —
Wind risk No data
- Chance of severe wind over 30 yrs
- —
Air-quality risk No data
- Unhealthy air days now
- —
- Unhealthy air days in 30 yrs
- —
Risk factors via First Street. Map © Google.
Why this score? — see what drove the B+ grade
The composite is a weighted blend of 9 inputs, each scored 0–100. Each bar is that input's sub-score; the figure is the points it added to the 100-point composite (weight × sub-score).
- Cash flow +30.0/30.0
- 1% rule +10.0/10.0
- DSCR +10.0/10.0
- Appreciation +8.8/10.0
- ARV discount +7.5/15.0
- Livability +3.9/5.0
- Schools +3.3/10.0
- Rent growth +2.4/5.0
- Condition / age +1.0/5.0
$269,900
🖨 Deal sheet (PDF) 📄 Offer letter ✓ Due diligence
Multi-family units
County records classify this as Multi-Family (5+ Unit). Listing-text estimate: 7 units. confirmed
5+ unit building — per-unit beds/baths from public records are typically unavailable; the breakdown below (if shown) is an estimate from the listing text.
Listing remarks
Buffalo, NY mixed-use/redevelopment opportunity for sale. Approved 7-unit apartment redevelopment. Sale includes approved A/E plans. N-2R zoning allows for a variety of redevelopment opportunities. Building features beautiful masonry features. Located in the heart of the West Side of Buffalo, NY an area seeing a resurgence in recent years with new local restaurants, retail, entertainment, and more. Walking distance to D'Youville University. Located on NFTA bus route allowing for easy access via public transportation. Five-minute drive to NYS I-190 entrance, providing quick access to all of Western New York. Ideal for: Mixed-use development, non-profit, retail, professional office.
Key facts
- Nfta bus route
- Approved a e plans
- N-2r zoning
Tags
Property features AI
Finance
- Financial info: 7 total units; Operating expense inclusions referenced in remarks; Owner pays and rent inclusions referenced in remarks
Exterior
- Parking: Three or more parking spaces; no garage
- Utilities: Public water connected; Sewer connected
- Home design: 3-story building; Brick construction; Flat roof; Existing (resale/fixer) condition
- Construction: Brick construction; Flat roof
- Exterior features: Corner, rectangular lot (34 x 99)
Interior
- Kitchen: Gas water heater
- Bedrooms: 7-unit property (number of individual bedrooms per unit not provided)
- Heating & cooling: Gas heating; Heating details further described in remarks
- Interior features: Full basement; Operating expense details available in remarks
Neighborhood map
What this means for you Summary
Snapshot
- This is a 7 × 1-bed/1-bath units multifamily listed at $270k. Condition is rated poor.
Deal economics
- At list price, monthly cash flow is $7k ($81k/yr) — positive. Per door: $967/mo.
- The deal already cash-flows at list — no discount required.
- Meets the 1% rule at list price ($11k rent vs $270k).
- Recommended offer: $266k (1.5% below list) — sets the bar for market timing.
- Cap rate 36.4% vs local median 8.0% in Buffalo — top-decile yield for the area; either an underpriced asset or a hidden risk that comps aren't pricing in. Stress-test before assuming the spread holds.
Location & tenants
- Location reads 77/100 on livability (#195 in NY, #3,011 nationally) — a middle-class / working-renter tenant base. Strengths: commute A+, housing A+, health & safety A+; Watch: crime F, employment D-.
- Buffalo City School District (urban): math 41% / reading 40% proficiency, ranked #535 of 590 in NY (top 91%) — families likely to look elsewhere, expect single-tenant / working-renter base with shorter leases; 75% free/reduced lunch — lower-income household profile, screen leases tightly.
- Market conditions: Rents soft (-0.5%/yr); 137 active listings in the ZIP; 1 comparable units currently listed for rent nearby; 1,244 units permitted in Erie County in 2024 (563 in 5+ unit buildings).
- At $10,933/mo this rent would consume 244% of the median local household income ($54k/yr) (locally 1501% of renters already pay >50% of income on rent) — very limited rent-growth headroom before tenants either downsize or default.
Forward outlook
- In year one you build about $22k of equity ($2k loan paydown + $20k appreciation (7.5% local appreciation)).
- At projected returns (7.5% appreciation + 0.0% rent growth), your $76k cash investment doubles in ~1 year — after that, you're playing with house money.
- By year 2, paydown + projected appreciation supports a ~$35k cash-out refi (75% LTV) — recoverable capital for the next deal without selling this one.
Negotiation context
- It's been on market 17 days — a 2% lower offer ($266k) is reasonable based on typical stale-listing flexibility.
Risks & watch-outs
- Watch-outs: built in 1885 — expect roof / HVAC / electrical / plumbing capex.
Questions for the listing agent
- Can we see the unit-by-unit rent roll, current vacancy, and any below-market leases? What's the average tenancy length?
- What capital expenditures (roof, boiler, parking lot, exteriors) have been made in the last 5 years, and what's planned in the next 2?
- Have any recent inspections been done? Can we get a copy of the seller's disclosures and any deferred-maintenance estimates?
- Built in 1885 — when were the roof, HVAC, electrical panel, plumbing, and water heater last replaced?
- Is there a deadline driving the sale (1031 exchange, divorce, estate, relocation)? That informs how much negotiation room exists.
- Crime grade is F in this area — have there been break-ins, vandalism, or insurance claims at this property in the last 3 years? What carrier currently insures it and at what premium?
- What's the average days-on-market for RENTAL listings here right now (not sales)? A rising rental-DOM trend means longer vacancies and softer asking-rent achievability than the comps imply.
- What's the recent tenant-quality profile in this submarket — average credit score on applications, eviction rate, late-payment / NSF rate, and stable-employment percentage? A property-management company in the area should have these aggregated.
- How much new apartment / multifamily construction is in the pipeline within 1–3 miles? Heavy new supply (>2% of stock underway) typically softens rents 12–24 months out; light construction supports rent growth.
Investment metrics
- 1% rule
- 4.05% ✓
- Cap rate
- 36.40%
- Cash-on-cash
- 107.53%
- DSCR
- 5.78
- GRM
- 2.1
CMA / ARV
- ARV (on-the-fly)
- $669,636
- Comps found
- 2
Show comp detail 2 sales within ~0.75 mi
| Address | Dist | Beds/Ba | Sqft | Sold | Price | $/sf | Match |
|---|---|---|---|---|---|---|---|
| 439 W Ferry #6 | 0.65mi | 6/— | 8,832 (+0%) | 14mo | $675,000 | $76 | 58 |
| 540-544 Niagara St | 0.56mi | 3/— | 7,731 (-12%) | 16mo | $270,000 | $35 | 40 |
Match score weights: distance 35% · size 25% · config 20% · recency 20%. Top-matched comps best support the ARV.
Projected returns pro-forma
7.51% appreciation · 0.0% rent growth · sell at horizon
- IRR
- —
- Equity multiple
- 7.65×
- Total profit
- $502,250
- Equity at exit
- $196,156
- IRR
- —
- Equity multiple
- 15.27×
- Total profit
- $1,078,320
- Equity at exit
- $381,178
Cash invested: $75,572 (down + closing). Projections, not guarantees.
Landlord ↔ Tenant lean methodology
- Overall (STATE)
- 15 Strongly Tenant-Friendly
- State New York
- 15 Strongly Tenant-Friendly · D+10
- County
- — inherits STATE
- City
- — inherits STATE
ZIP-level market 14213
- Home prices YoY
- 1.7%
- Rents YoY
- -0.5%
- Active inventory
- 137
- Price-to-rent
- 14.4×
Monthly cashflow live
- Estimated rent
- $10,933 high interval (Pro) →
- Mortgage (P&I)
- −$1,415
- Tax est. 1.5%
- −$337 /mo · $4,048/yr
- Insurance
- −$112
- HOA
- −$0
- Vacancy / Maint / Mgmt
- −$2,296
- Net cashflow
- $6,772
Break-even live
Sensitivity live
| Price | -10% $6,958 | -5% $6,865 | +0% $6,772 | +5% $6,679 | +10% $6,585 |
|---|---|---|---|---|---|
| Rent | -10% $5,908 | -5% $6,340 | +0% $6,772 | +5% $7,204 | +10% $7,636 |
| Rate | -1.0pp $6,908 | -0.5pp $6,840 | base $6,772 | +0.5pp $6,702 | +1.0pp $6,631 |
7-unit breakdown (identical units grouped — click to expand)
| Units | Beds | Baths | Est. rent |
|---|---|---|---|
| 7× units | 1 | 1 | $10,934 |
| #1 | 1 | 1 | $1,562 |
| #2 | 1 | 1 | $1,562 |
| #3 | 1 | 1 | $1,562 |
| #4 | 1 | 1 | $1,562 |
| #5 | 1 | 1 | $1,562 |
| #6 | 1 | 1 | $1,562 |
| #7 | 1 | 1 | $1,562 |
| Total (7 units) | $10,933 | ||
UW: 25.0% down · 7.5% · 30yr · 1.5% tax · 5.0% vac · 8.0% maint · 8.0% mgmt
Financing live
Cash to close
- Down payment
- $67,475
- Closing costs
- $8,097
- Reserves months
- —
- Total cash needed
- —
Loan-product check · same deal, 3 products live
Conventional
25% down · 7.5% · 30yr
- Down + closing
- —
- Monthly P&I
- —
- Monthly cashflow
- —
- DSCR
- —
- Eligible?
- —
Personal DTI + credit; lowest rate.
DSCR
20% down · 8.5% · 30yr
- Down + closing
- —
- Monthly P&I
- —
- Monthly cashflow
- —
- DSCR
- —
- Eligible?
- —
No personal income docs; deal must DSCR.
Hard money
10% down · 12.0% · 12mo
- Down + closing
- —
- Monthly P&I
- —
- Monthly cashflow
- —
- DSCR
- —
- Eligible?
- —
Short-term bridge; refi at stabilization.
Rent comps 1 comps
| Address | Beds | Baths | Sqft | Rent | $/sqft | DOM | Units | Dist |
|---|---|---|---|---|---|---|---|---|
| 160 W Ferry St Buffalo, NY | 2.0 | 1.0 | 8192 | $1,100 | $0.13 | 15d | 1 | 0.62mi |
Listing history 13 events
-
2026-06-18days on market $269,900 Active 17 DOM
-
2026-06-17days on market $269,900 Active 16 DOM
-
2026-06-16days on market $269,900 Active 15 DOM
-
2026-06-15days on market $269,900 Active 14 DOM
-
2026-06-13days on market $269,900 Active 12 DOM
-
2026-06-13days on market $269,900 Active 11 DOM
-
2026-06-10days on market $269,900 Active 9 DOM
-
2026-06-09days on market $269,900 Active 8 DOM
-
2026-06-08days on market $269,900 Active 7 DOM
-
2026-06-07days on market $269,900 Active 6 DOM
-
2026-06-03days on market $269,900 Active 2 DOM
-
2026-06-02remarks 689-char remark
-
2026-06-02$269,900 Active 1 DOM
ⓘ Source: listings_history table (triggers on properties + properties_extension) + one-shot
backfill from property_details.listing_events for pre-trigger history.
Nearby sold comps map
Loading sold comps map…
Walkable amenities ~0.75 mi
Loading nearby amenities…
Taxation est. · year 1
- Rental income
- $131,196
- − Mortgage interest
- −$15,119
- − Property taxes
- −$4,048
- − Insurance
- −$1,350
- − Repairs & maintenance
- −$10,496
- − Management
- −$10,496
- − Depreciation
- −$7,852
- Taxable income
- $81,836
- Est. tax owed @ 24.0%
- −$19,641
- After-tax cash flow
- $61,621/yr
For passive investors: Depreciation is non-cash, so a rental often shows a tax loss while cash-flowing — sheltering income. Rental losses are passive: they offset passive income freely, and up to $25,000/yr can offset ordinary (W-2) income if you actively participate and your MAGI is under $100k (phasing out to $0 by $150k); unused losses carry forward. On sale, claimed depreciation is recaptured at up to 25%, and gains may owe capital-gains tax (a 1031 exchange can defer both). Figures are a year-1 estimate at your 24.0% rate — not tax advice; consult a CPA.
Condition & rehab AI · 1 photo
This multi-family property is in poor condition and requires extensive repairs and improvements to increase its resale and rental value.
Repairs flagged
- Major roof — Significant damage and potential leaks are visible.
- Major exterior siding — The exterior siding appears to be in poor condition and may need replacement.
- Major interior walls and flooring — The overall condition of the interior suggests significant repairs are needed.
- Major HVAC/mechanicals — No systems are visible, but the overall condition suggests they may be in poor shape and need replacement.
- Major landscaping — The landscaping is overgrown and in poor condition, detracting from the curb appeal and value of the property.
Value-add opportunities
- Both roof replacement — A new roof would significantly improve the property's condition and curb appeal.
- Both exterior siding repair/replacement — A new exterior siding would improve the property's appearance and increase its value.
- Both interior wall and flooring repairs — Repairing or replacing the interior walls and flooring would improve the property's condition and increase its value.
- Both HVAC/mechanical upgrades — Upgrading the HVAC and mechanical systems would improve the property's functionality and increase its value.
- Both landscaping and curb appeal improvements — Improving the landscaping and curb appeal would enhance the property's overall appearance and increase its value.
Renovation cost estimate screening
| Repair item | Severity | Est. cost |
|---|---|---|
| roof · Significant damage and potential leaks are visible. | Major | $15,000–50,000 |
| exterior siding · The exterior siding appears to be in poor condition and may need replacement. | Major | $15,000–50,000 |
| interior walls and flooring · The overall condition of the interior suggests significant repairs are needed. | Major | $15,000–50,000 |
| HVAC/mechanicals · No systems are visible, but the overall condition suggests they may be in poor shape and need replacement. | Major | $15,000–50,000 |
| landscaping · The landscaping is overgrown and in poor condition, detracting from the curb appeal and value of the property. | Major | $15,000–50,000 |
| Total estimated repair cost · 5 items | $75,000–250,000 |
Value-add ROI direction
- Both roof replacement — A new roof would significantly improve the property's condition and curb appeal. ↑
- Both exterior siding repair/replacement — A new exterior siding would improve the property's appearance and increase its value. ↑
- Both interior wall and flooring repairs — Repairing or replacing the interior walls and flooring would improve the property's condition and increase its value. ↑
- Both HVAC/mechanical upgrades — Upgrading the HVAC and mechanical systems would improve the property's functionality and increase its value. ↑
- Both landscaping and curb appeal improvements — Improving the landscaping and curb appeal would enhance the property's overall appearance and increase its value. ↑
ⓘ Cost ranges are severity-bucket heuristics (US national rule-of-thumb). Get contractor quotes + a written scope before underwriting a rehab budget.
Schools (NCES district)
- District
- Buffalo City School District
- NCES district ID
- 3605850
- Math proficiency
- 41% ▲ 11.00%
- Reading proficiency
- 40% ▲ 7.00%
- Median HH income
- $31,665
- Composite
- 33.17/100
- National rank
- #5544
- State rank
- #535 of 590 in NY
Livability — Buffalo
- Score
- 77/100
- State rank
- #195
- US rank
- #3011
Category grades
Schools grade is shown separately in the Schools card above.
Census & demographics
- Census place
- Buffalo, NY
- County
- Erie County · 714,559 people
- City population
- 440,021
- Metro
- Buffalo-Cheektowaga, NY
- Population (ZIP)
- 24,107
- Household income
- $53,870
- Rent vs Own
- Severe rent burden
- 1501.0
Population outlook (Erie County) Hauer SSP2
- Today (2025)
- 933,037 people
- By 2030
- 935,181 · +0.2%
- By 2040
- 928,531 · -0.5%
- By 2050
- 905,725 · -2.9%
- By 2075
- 834,037 · -10.6%
- By 2100
- 708,033 · -24.1%
Race, ethnicity, and origin ACS 2023
- Neighborhood character
- Highly diverse neighborhood (Simpson 0.70)
- Race & ethnicity
- White 46% Hispanic / Latino 20% Black 18% Asian 12% Two or more races 10%
- Hispanic origin (detail)
- Mexican 1% Puerto Rican 16% Dominican 1%
- Common ancestry
- Romanian 6% Slovak 3% Lithuanian 3%
- Foreign-born
- 16% · Philippines, Canada, India
- Languages at home
- 68% English-only · Spanish 12% Other Asian/Pacific 7% Arabic 3%
Political lean MEDSL · Erie
- 2024 margin
- Lean D (+9.7) · D 54.8% · R 45.2%
- 2008→2024 swing
- -7.9pp toward R · 2008: 17.5pp · 2024: 9.7pp
- All cycles
- 2024: D+9.7 2020: D+14.7 2016: D+4.8 2012: D+15.6 2008: D+17.5
Not yet ingested
- Civics
- —
Market trends
- HPI YoY
- ▲ 7.51%
- Current HPI
- 448.4879
- Rent YoY
- ▼ -0.49%
- Metro
- Buffalo-Cheektowaga, NY
- State GDP YoY
- ▲ 2.60%
- F500 in state
- 92
Industry mix (Fortune 500 HQ in NY)
| Industry | F500 HQs | Revenue |
|---|---|---|
| Financial Services | 10 | $950B |
|
||
| Consumer Goods | 9 | $162B |
|
||
| Insurance | 4 | $225B |
|
||
| Telecommunications | 2 | $144B |
|
||
| Pharmaceuticals | 2 | $112B |
|
||
| Media / Entertainment | 2 | $69B |
|
||
Price history
1 event — show timeline
- 2026-06-01 Listed $269,900 WNYREIS
Cash-flow waterfall
monthlySold comps — $/sqft
last 12 mo · ≤1 miLoading sold comps…