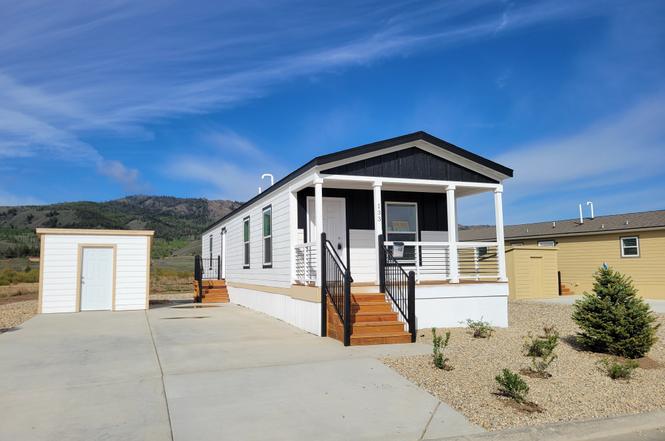
551 Summit Trail 133 Plan · Granby, CO
Flood risk 1/10 · Minimal
- FEMA flood zone
- D
- Chance of flooding over 30 yrs
- 0.0%
- Est. flood insurance / yr
- $544 – $1,084
Fire risk 5/10 · Moderate
- Est. fire insurance / yr
- $939 – $1,743
Heat risk No data
- Hot days now (above threshold)
- —
- Hot days in 30 yrs
- —
Wind risk 1/10 · Minimal
- Chance of severe wind over 30 yrs
- —
Air-quality risk 3/10 · Minor
- Unhealthy air days now
- 2 days/yr
- Unhealthy air days in 30 yrs
- 3 days/yr
Risk factors via First Street. Map © Google.
Why this score? — see what drove the B- grade
The composite is a weighted blend of 9 inputs, each scored 0–100. Each bar is that input's sub-score; the figure is the points it added to the 100-point composite (weight × sub-score).
- Cash flow +30.0/30.0
- DSCR +10.0/10.0
- 1% rule +8.6/10.0
- ARV discount +7.5/15.0
- Schools +4.2/10.0
- Livability +3.5/5.0
- Rent growth +2.5/5.0
- Condition / age +2.5/5.0
- Appreciation +0.0/10.0
$159,995
🖨 Deal sheet 📄 Offer letter ✓ Due diligence
Listing remarks
Brand New Home! Bright and inviting, with light color tones throughout. This 2 bedroom, 2 bathroom home is opening up in February. Highlighting a covered front porch that leads to an open front living space. The kitchen has a breakfast bar with stainless steel, Whirlpool appliances. The fridges comes equipped with a water and ice dispenser and there is a gas range. The primary bathroom has built-in storage, double sinks and walk-in shower with glass doors. Central AC and 8x10 shed also included. Contact our office for more information. Must be able to pass credit and background check, site rent applies and we offer equal housing opportunities.
Key facts
- Covered front porch
- Breakfast bar
- Gas range
Tags
Property features AI
Finance
- Other: Address: 551 Summit Trail 133, Granby, CO 80446; Listing modified Apr 28, 2026
- Financial info: List price $164,995
Exterior
- Home design: Single-family plan (551 Summit Trail 133); Active listing
- Exterior features: Living area of 896
Interior
- Bedrooms: 2 bedrooms
- Bathrooms: 2 bathrooms
- Interior features: Plan home
Neighborhood map
What this means for you Summary
Snapshot
- This is a 2-bed/2.0-bath manufactured listed at $160k.
Deal economics
- At list price, monthly cash flow is $614 ($7k/yr) — positive.
- The deal already cash-flows at list — no discount required.
- Meets the 1% rule at list price ($2k rent vs $160k).
- Recommended offer: $141k (12.0% below list) — sets the bar for market timing.
- Cap rate 10.9% vs local median 1.4% in Granby — top-decile yield for the area; either an underpriced asset or a hidden risk that comps aren't pricing in. Stress-test before assuming the spread holds.
Location & tenants
- Location reads 70/100 on livability (#85 in CO) — a middle-class / working-renter tenant base. Strengths: crime A+, housing A+, employment B+; Watch: commute D+, amenities F, health & safety F.
- East Grand School District No. 2 (rural): math 36% / reading 58% proficiency, ranked #17 of 86 in CO (top 20%) — families likely to look elsewhere, expect single-tenant / working-renter base with shorter leases.
- Market conditions: 424 active listings in the ZIP; 294 units permitted in Grand County in 2024 (82 in 5+ unit buildings).
- This rent runs 35% of the median local income ($75k/yr) — at the standard rent-burdened threshold; future hikes will face affordability resistance.
Forward outlook
- Local home prices are declining (-3.0%/yr); year-one equity from $1k of loan paydown is wiped out by about $5k of value loss. Plan a longer hold.
- Grand County population projected at -16% by 2050 — secular population decline; favor cash flow + early exit over multi-decade hold.
- At projected returns (-3.0% appreciation + 3.0% rent growth), your $45k cash investment doubles in ~8 years — after that, you're playing with house money.
Negotiation context
- It's been on market 149 days — a 12% lower offer ($141k) is reasonable based on typical stale-listing flexibility.
Risks & watch-outs
- Climate carrying-cost: moderate wildfire risk — expect insurance premiums to compound above CPI over the hold.
Questions for the listing agent
- It's been on market 149 days. Have you received any prior offers? Is the seller open to a 12% concession, seller financing, or rate buy-down credit?
- Why hasn't it sold? Are there any deal-killer items the seller is aware of (foundation, flood, title, zoning, code violations)?
- Is there a deadline driving the sale (1031 exchange, divorce, estate, relocation)? That informs how much negotiation room exists.
- What's the average days-on-market for RENTAL listings here right now (not sales)? A rising rental-DOM trend means longer vacancies and softer asking-rent achievability than the comps imply.
- What's the recent tenant-quality profile in this submarket — average credit score on applications, eviction rate, late-payment / NSF rate, and stable-employment percentage? A property-management company in the area should have these aggregated.
- How much new for-sale + rental construction is in the pipeline within 1–3 miles? Heavy new supply typically softens prices + rents 12–24 months out; constrained supply supports both.
Investment metrics
- 1% rule
- 1.36% ✓
- Cap rate
- 10.90%
- Cash-on-cash
- 16.46%
- DSCR
- 1.73
- GRM
- 6.1
CMA / ARV
No comps found within radius.
Projected returns pro-forma
-3.0% appreciation · 3.0% rent growth · sell at horizon
- IRR
- 7.6%
- Equity multiple
- 1.30×
- Total profit
- $13,238
- Equity at exit
- $23,856
- IRR
- 16.9%
- Equity multiple
- 2.39×
- Total profit
- $62,048
- Equity at exit
- $13,833
Cash invested: $44,799 (down + closing). Projections, not guarantees.
Landlord ↔ Tenant lean methodology
- Overall (STATE)
- 38 Tenant-Leaning
- State Colorado
- 38 Tenant-Leaning · D+4
- County
- — inherits STATE
- City
- — inherits STATE
ZIP-level market 80446
- Home prices YoY
- -23.1%
- Active inventory
- 424
- Price-to-rent
- 6.1×
Monthly cashflow live
- Estimated rent
- $2,177 medium interval (Pro) →
- Mortgage (P&I)
- −$839
- Tax est. 1.5%
- −$200 /mo · $2,400/yr
- Insurance
- −$67
- HOA
- −$0
- Vacancy / Maint / Mgmt
- −$457
- Net cashflow
- $614
Break-even live
UW: 25.0% down · 7.5% · 30yr · 1.5% tax · 5.0% vac · 8.0% maint · 8.0% mgmt
Financing live
Cash to close
- Down payment
- $39,999
- Closing costs
- $4,800
- Reserves months
- —
- Total cash needed
- —
Loan-product check · same deal, 3 products live
Conventional
25% down · 7.5% · 30yr
- Down + closing
- —
- Monthly P&I
- —
- Monthly cashflow
- —
- DSCR
- —
- Eligible?
- —
Personal DTI + credit; lowest rate.
DSCR
20% down · 8.5% · 30yr
- Down + closing
- —
- Monthly P&I
- —
- Monthly cashflow
- —
- DSCR
- —
- Eligible?
- —
No personal income docs; deal must DSCR.
Hard money
10% down · 12.0% · 12mo
- Down + closing
- —
- Monthly P&I
- —
- Monthly cashflow
- —
- DSCR
- —
- Eligible?
- —
Short-term bridge; refi at stabilization.
Listing history 15 events
-
2026-06-18days on market $159,995 Active 149 DOM
-
2026-06-17days on market $159,995 Active 148 DOM
-
2026-06-16days on market $159,995 Active 147 DOM
-
2026-06-15days on market $159,995 Active 146 DOM
-
2026-06-14days on market $159,995 Active 144 DOM
-
2026-06-10days on market $159,995 Active 141 DOM
-
2026-06-09days on market $159,995 Active 140 DOM
-
2026-06-08days on market $159,995 Active 139 DOM
-
2026-06-07days on market $159,995 Active 138 DOM
-
2026-06-05days on market $159,995 Active 135 DOM
-
2026-06-03days on market $159,995 Active 134 DOM
-
2026-06-02days on market $159,995 Active 133 DOM
-
2026-06-01days on market $159,995 Active 132 DOM
-
2026-05-31days on market $159,995 Active 131 DOM
-
2026-05-31days on market $159,995 Active 130 DOM
ⓘ Source: listings_history table (triggers on properties + properties_extension) + one-shot
backfill from property_details.listing_events for pre-trigger history.
Climate risk First Street
- Flood 1/10 Low FEMA zone D · 0% chance over 30 yrs
- Wildfire 5/10 Major
- Wind 1/10 Low
- Air quality 3/10 Moderate 2 unhealthy d/yr today · 3 by 30 yrs out
Nearby sold comps map
Loading sold comps map…
Walkable amenities ~0.75 mi
Loading nearby amenities…
Taxation est. · year 1
- Rental income
- $26,128
- − Mortgage interest
- −$8,962
- − Property taxes
- −$2,400
- − Insurance
- −$800
- − Repairs & maintenance
- −$2,090
- − Management
- −$2,090
- − Depreciation
- −$4,654
- Taxable income
- $5,131
- Est. tax owed @ 24.0%
- −$1,231
- After-tax cash flow
- $6,141/yr
For passive investors: Depreciation is non-cash, so a rental often shows a tax loss while cash-flowing — sheltering income. Rental losses are passive: they offset passive income freely, and up to $25,000/yr can offset ordinary (W-2) income if you actively participate and your MAGI is under $100k (phasing out to $0 by $150k); unused losses carry forward. On sale, claimed depreciation is recaptured at up to 25%, and gains may owe capital-gains tax (a 1031 exchange can defer both). Figures are a year-1 estimate at your 24.0% rate — not tax advice; consult a CPA.
Schools (NCES district)
- District
- East Grand School District No. 2
- NCES district ID
- 0804320
- Math proficiency
- 36% ▼ -2.00%
- Reading proficiency
- 58% ▲ 4.00%
- Median HH income
- $64,903
- Composite
- 41.64/100
- National rank
- #3424
- State rank
- #17 of 86 in CO
Livability — Granby
- Score
- 70/100
- State rank
- #85
- US rank
- #7574
Category grades
Schools grade is shown separately in the Schools card above.
Census & demographics
- County
- Grand County · 5,874 people
- City population
- 4,017
- Metro
- nan
- Population (ZIP)
- 4,017
- Household income
- $74,973
- Rent vs Own
- Severe rent burden
- 105.0
Population outlook (Grand County) Hauer SSP2
- Today (2025)
- 14,498 people
- By 2030
- 14,215 · -2.0%
- By 2040
- 13,225 · -8.8%
- By 2050
- 12,186 · -15.9%
- By 2075
- 10,196 · -29.7%
- By 2100
- 8,326 · -42.6%
Race, ethnicity, and origin ACS 2023
- Neighborhood character
- Predominantly White (79%)
- Race & ethnicity
- White 79% Two or more races 19% Hispanic / Latino 6%
- Hispanic origin (detail)
- Puerto Rican 2%
- Common ancestry
- Slovak 8% Portuguese 6% Romanian 2%
- Foreign-born
- 2% · Canada, Jamaica
- Languages at home
- 98% English-only · Russian/Polish/Slavic 1% French/Haitian/Cajun 1% Spanish 1%
Political lean MEDSL · Grand
- 2024 margin
- Toss-up / Even · D 48.0% · R 48.8% · Other 3.2%
- 2008→2024 swing
- +0.3pp no change · 2008: -1.1pp · 2024: -0.8pp
- All cycles
- 2024: R+0.8 2020: R+1.8 2016: R+13.5 2012: R+7.2 2008: R+1.1
Not yet ingested
- Civics
- —
Market trends
- HPI YoY
- ▼ -104.78%
- Current HPI
- 347.8691
- Rent YoY
- —
- Metro
- nan
- State GDP YoY
- ▲ 1.95%
- F500 in state
- 14
Industry mix (Fortune 500 HQ in CO)
| Industry | F500 HQs | Revenue |
|---|---|---|
| Technology Distribution | 1 | $31B |
|
||
| Food / Agriculture | 1 | $18B |
|
||
| Packaging | 1 | $14B |
|
||
| Healthcare | 1 | $13B |
|
||
| Energy | 1 | $10B |
|
||
| Technology | 1 | $4B |
|
||
Cash-flow waterfall
monthlySold comps — $/sqft
last 12 mo · ≤1 miLoading sold comps…